Supply and demand
- Indicateurs
- Evgeny Raspaev
- Version: 1.1
- Mise à jour: 25 octobre 2020
- Activations: 10
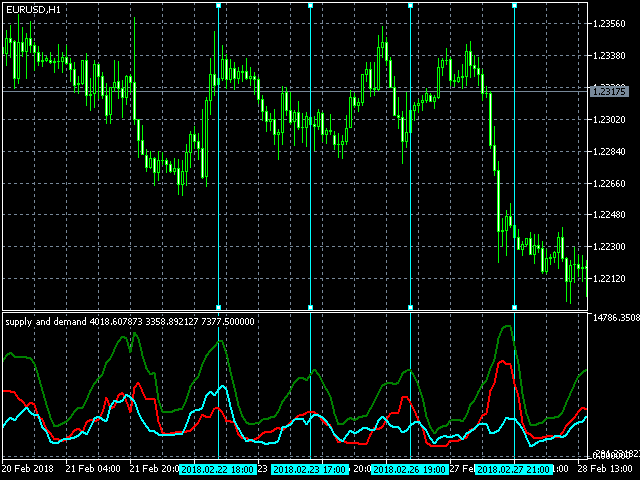
The indicator shows supply and demand degenerated through tick volume.
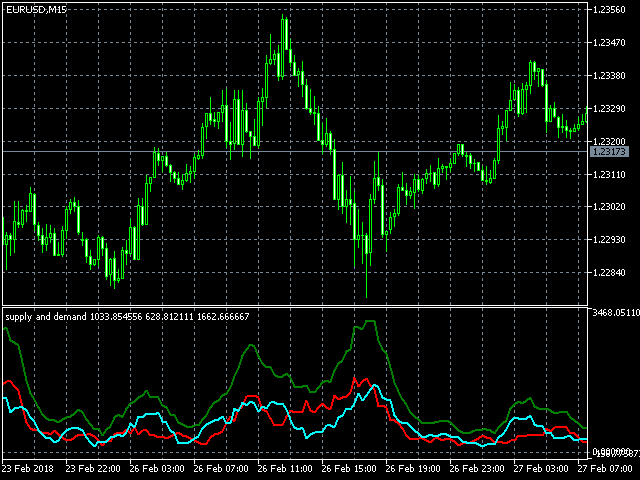
The red line is the supply line.
The blue line is the demand line.
The green line is the total volume line.
Typical situations of indicator readings:
red is higher than blue - supply is higher than demand - the price is falling.
blue is higher than red - demand is higher than supply - the price is growing.
the red and blue lines tend to go down, but the blue is above the red - demand prevails, the price rises, but volatility decreases.
the red and blue lines tend to go down, but the red ones are higher than the blue ones - supply prevails, the price decreases, but volatility decreases.
red and blue lines tend to go up, but blue is higher than red - demand prevails, the price rises, volatility increases.
the red and blue lines tend to go up, but the red is higher than the blue - supply prevails, the price tends to go down, volatility increases.
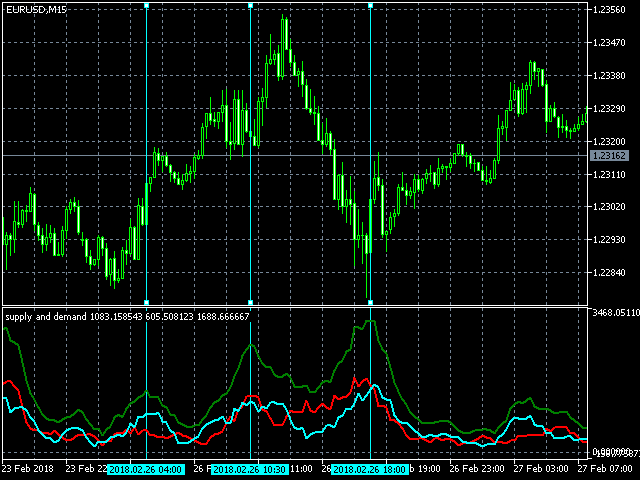
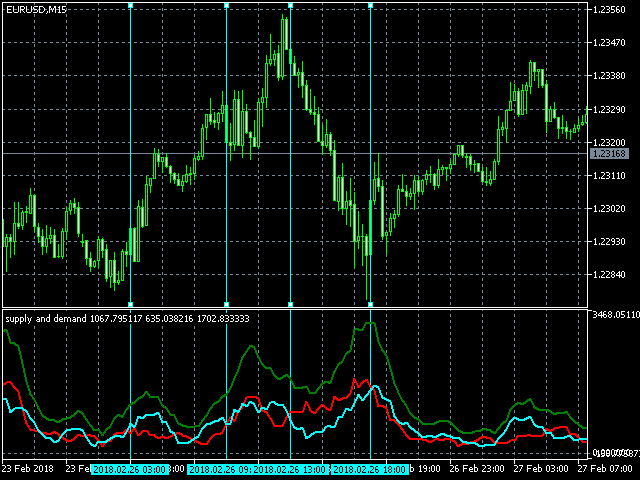
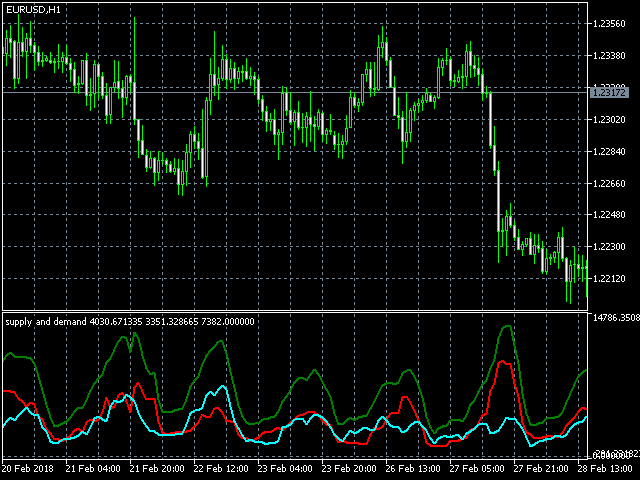
The indicator also shows sessions (European, Asian, American) - this is expressed by a wavy change in the total volume (green line), supply and demand (typical for any currency pair on the chart with a period of 15 minutes. Up to 1 hour)
The crossing of the blue and red lines signals the equilibrium of supply and demand, at this moment the price is in the middle of its movement.
Screenshots will show more and more clearly.
Average margin - averaging parameter.






Классный индикатор