BalanceLines
- Indicateurs
- Andrei Kossarev
- Version: 1.0
- Activations: 5
"Balance cost" analysis method
Created by Trader AFI_man.
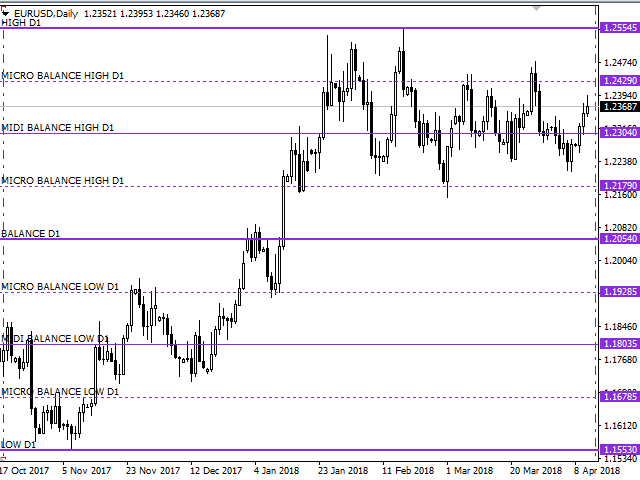
The BalanceLines indicator plots balance levels for a given time interval. The balance line divides the market volume into sellers (above the balance level) and buyers (below the balance level). In any movement, if the price is fixes above the balance level, there comes a moment when sellers are unable to hold off buyers, which leads to a growth. Similarly, when the price is fixed below the balance level, there comes a moment when buyers are unable to hold off sellers, which leads to a decrease. Thus, the price moves from one balance level to the next.
Features of the BalanceLines indicator
- Plots the balance cost lines
- Plots the midi balance lines
- Plots the micro balance lines
- The price levels are rounded up to a multiple of 5 according to the selected rounding method
- If the price is above the balance level, buying is preferable
- If the price is below the balance level, selling is preferable
- If the price of the balance cost line reached the micro balance from the candle High, it is highly likely to move towards the midi balance level from the candle High
- If the price of the balance cost line reached the micro balance from the candle Los, it is highly likely to move towards the midi balance level from the candle Low
- If the price was not fixed below/above the midi balance line, then there will be a rollback towards the balance cost
Indicator parameters
- BalancePrefix - prefix of the balance line, required if more than one instance of the indicator is used on the chart
- BRoundType - rounding method, the following options are available:
- no rounding
- rounding in pips multiples of 5
- rounding in points
- BLColor - color of the balance line
- BLWidth - width of the balance line
- BLStyle - style of the balance line
- BLMDEnable - show the midi balance lines
- BLMDColor - color of the midi balance line
- BLMDWidth - width of the midi balance line
- BLMDStyle - style of the midi balance line
- BLMREnable - show the micro balance lines
- BLMRColor - color of the micro balance line
- BLMRWidth - width of the micro balance line
- BLMRStyle - style of the micro balance line
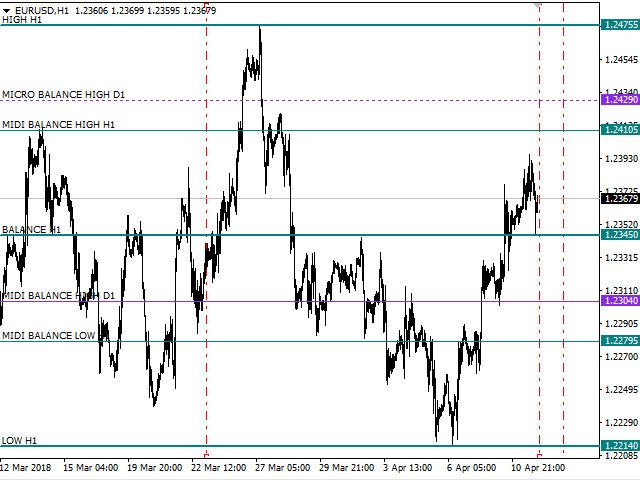
The period for plotting the balance cost is set by vertical lines on the chart. The indicator does not redraw, simply move the right vertical line to update the period. More than one instance of the indicator can be used on the chart. In this case, the prefix should be defined in the indicator settings.
Example of Use
Place the balance cost indicator on the last impulse of the higher timeframe. Position of the price relative to the balance cost indicates the preferable movement direction. Go to the working timeframe and look for entries on rollbacks in the direction of the higher timeframe. To look for rollbacks on the working timeframe, you can also use the balance cost indicator. In this case, look for a retracement from one balance level to another, for example, from midi balance to the balance cost.


