Middle Volume
- Indicateurs
- Stefan Stoyanov
- Version: 1.0
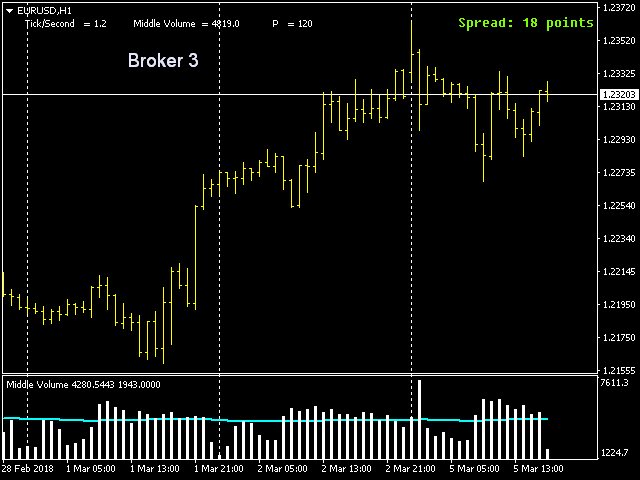
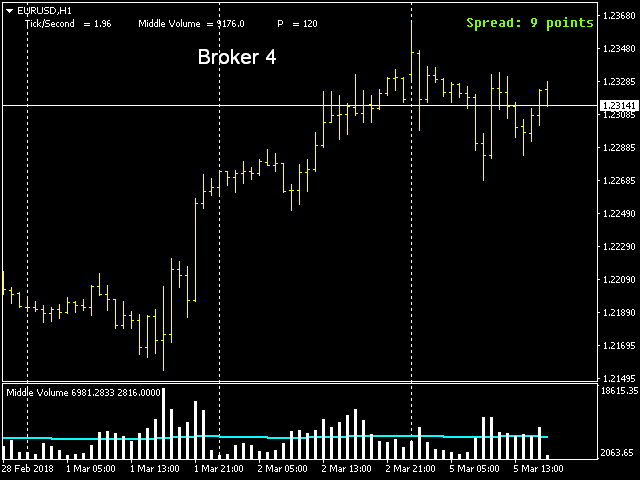
The indicator measures volumes on different charts and instruments.
Its main advantage is the ability to compare separate brokers.
The less Middle Volume and Tick / Second, the more reliable is the broker.
There is a comment in the upper left corner
Comment data:
- Tick/Second — number of ticks per second for a selected instrument
- Middle Volume — average volumes in the penultimate bar
This indicator allows tracking a relative market activity for different timeframes.
- If the volumes are lower than the average middle line, the market is inactive;
- If the volumes exceed the blue middle line, the market is trendy
How to configure the indicator?
- Bar — dimension of the array where the indicator is calculated
- P — volumes averaging period
To change the parameters, right-click on the chart, Charts => Indicators List => Midl Volume => Edit.
The indicator window will appear. Set the parameters.
Save the template: right-click on the chart, Charts => Template => Save Template.


I found it useful on a 4 hour charts to see the best time to trade with good volume.