• Aperçu
  • Avis (3)
  • Commentaires (1)
  • Nouveautés

Quick response

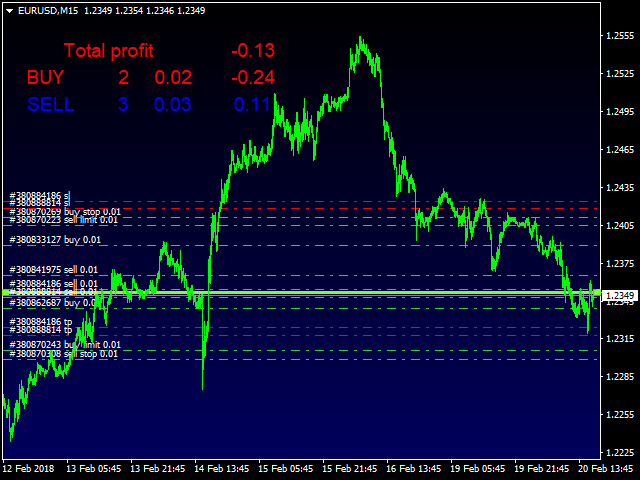
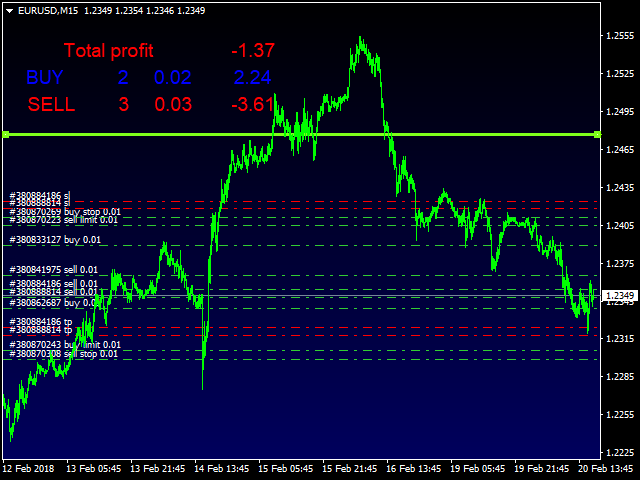
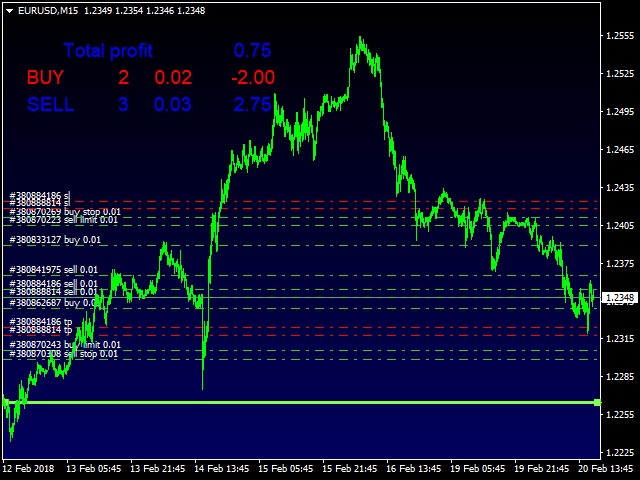
If you need to quickly evaluate the results of trading on a current financial instrument by hypothetical price movement in the chosen direction and up to a certain level, set the indicator on any chart that contains open positions and move the line to the desired level after it appears together with the results tab. This is all you need to understand what happens to your deposit if the price is at this level without taking into account existing stop loss and take profit. Enable considering pending orders to evaluate the situation when they are virtually triggered. You can change the situation based on the obtained results.


Parameters

  • Drawing options for the line — fast result line parameters;
  • Color line Quick response — line color;
  • The width of the lines Quick response — line thickness;
  • Information window parameters — info window parameters;
  • The angle of the graph for the reference — data display window angle;
  • Taking into account pending orders — consider pending orders (disabled by default);
  • Color text — neutral calculation result color;
  • Color plus — positive calculation result color;
  • InpColorMinus — negative calculation result color.


Produits recommandés
The indicator provides a superior alternative to price action analysis. It enables the identification of normalized patterns, which are then transformed into a graphical representation to forecast future steps within a time series. In the top-left corner, you'll find information regarding the expected prediction accuracy, determined through a complex MSQE calculation. You have the flexibility to adjust the time window, making it easy to validate the indicator's performance. Additionally, you can
KopierMaschine - локальный копировщик сделок между различными счетами MetaTrader 4 и MetaTrader 5 в любом направлении расположенных на одном компьютере с интуитивно понятным интерфейсом. Направления копирования: MT4 --> MT5 MT4 --> MT4 MT5 --> MT5 MT5 --> MT4 для копирования между терминалами MetaTrader 4 и MetaTrader   5 необходимо приобрести версию продукта KopierMaschine  для  MetaTrader   5 Особенности Программа работает в двух режимах Master и Slave На один подчиненный счет можно копировать
Le Capteur de Tendance : La Stratégie du Capteur de Tendance avec Indicateur d'Alerte est un outil d'analyse technique polyvalent qui aide les traders à identifier les tendances du marché et les points d'entrée et de sortie potentiels. Elle présente une stratégie dynamique de Capteur de Tendance, s'adaptant aux conditions du marché pour une représentation visuelle claire de la direction de la tendance. Les traders peuvent personnaliser les paramètres selon leurs préférences et leur tolérance a
FREE
L'indicateur construit un éventail de lignes de tendance (après avoir cliqué sur une certaine bougie), similaire aux angles de Gann classiques. La particularité de l'indicateur est qu'il construit des angles non seulement sur une échelle fixe, mais utilise également le prix moyen d'un certain nombre de barres (facultatif). Il existe deux façons de calculer le prix moyen des cornières dans l'indicateur (facultatif) : 1) calcul du mouvement de prix moyen (pour un certain nombre de barres) du plu
ZigZag Professional
Dmitriy Kashevich
5 (1)
the zigzag indicator draws lines on the chart from the highest point to the lowest There are built-in fibonacci levels built-in sound alert the indicator highlights trends on small timeframes with a thin line and trends highlights with a coarse line Fibonacci levels can be turned on and off in the settings settings are very simple and clear the same sound alert can be turned on and off, you can change the colors of the lines.
Trend Ray
Andriy Sydoruk
The indicator shows the potential trend direction by cyclical-wave dependence. Thus, all the rays of the intersection will be optimal rays, in the direction of which the price is expected to move, taking into account the indicator period. Rays can be used as a direction for potential market movement. But we must not forget that the approach must be comprehensive, the indicator signals require additional information to enter the market.
Day Pattern
Oleksandr Martsynyshen
Description: - D ay Pattern - an indicator that helps to identify patterns of price changes for the development of trading algorithms and strategies. For whom this tool? - For developers of trading strategies and algorithms. - Medium- and long-term traders. Time frames H1-W1. Features of the indicator: - There is a function of exporting indicator values to a file of the csv format. - Using the information panel, you can conduct an express analysis of trading tool. - The indicator is sui
The indicator detects and displays Shark harmonic pattern (see the screenshot). The pattern is plotted by the extreme values of the ZigZag indicator (included in the resources, no need to install). After detecting the pattern, the indicator notifies of that by a pop-up window, a mobile notification and an email. The indicator highlights the process of the pattern formation and not just the complete pattern. In the former case, it is displayed in the contour triangles. After the pattern is comple
The Penta-O is a 6-point retracement harmonacci pattern which usually precedes big market movements. Penta-O patterns can expand and repaint quite a bit. To make things easier this indicator implements a twist: it waits for a donchian breakout in the right direction before signaling the trade. The end result is an otherwise repainting indicator with a very reliable trading signal. The donchian breakout period is entered as an input. [ Installation Guide | Update Guide | Troubleshooting | FAQ | A
This indicator is the undisputed leader among the indicators. And for this statement there is a good reason. The indicator builds a very high quality channel in which it generates signals to enter! What is the ideal strategy for the trader, since the trader always hesitates when choosing a strategy for the job. That is, this indicator will allow you to solve the dilemma of choosing a job by trend or to the channel, since it combines these two basic concepts. Working with the indicator is very
Market Profile 3
Hussien Abdeltwab Hussien Ryad
3 (2)
Market Profile 3 MetaTrader 4 indicator  — is a classic Market Profile implementation that can show the price density over time, outlining the most important price levels, value area, and control value of a given trading session. This indicator can be attached to timeframes between M1 and D1 and will show the Market Profile for daily, weekly, monthly, or even intraday sessions. Lower timeframes offer higher precision. Higher timeframes are recommended for better visibility. It is also possible t
FREE
The indicator detects and displays М. Gartley's Butterfly pattern. The pattern is plotted by the extreme values of the ZigZag indicator (included in the resources, no need to install). After detecting the pattern, the indicator notifies of that by the pop-up window, a mobile notification and an email. The pattern and wave parameters are displayed on the screenshots. The default parameters are used for demonstration purposes only in order to increase the amount of detected patterns. Parameters z
MetaWaves
Stanislav Korotky
This indicator was inspired by М & W Wave Patterns by A. Merrill. 5 extremums or 4 edges of ZigZag are enough to build M or W pattern at arbitrary offset in the history. The classical approach includes a table of predefined figures of ZigZag waves, which can transform into each other under special rules—so that next edge can be forecasted based on these rules. Unlike to this approach, the indicator analyses available history and builds statistics for all M and W patterns, which differ in their c
Reversal Pattern Pro
Boonyapagorn Rodvattanajinda
Reversal Patterns Pro Reversal Patterns Pro is a Price Action (PA) analytical tool that scans the reversal patterns.  - Finds and marks the most dependable Japanese candlestick patterns in real-time. - Supports all time frames (Best for Scalping) - Doesn't repaint making it an exceptional indicator for Expert Advisors. Input parameters : - Support & Resistance Mode ( true or false ) for enabling advanced filtering - Donchian Period - RSI Period - RSI Oversold Level - RSI Overbought Level - Al
FreqoMaster
Stanislav Korotky
The main idea of this indicator is rates analysis and prediction by Fourier transform. The indicator decomposes exchange rates into main harmonics and calculates their product in future. The indicator shows 2 price marks in history, depicting price range in the past, and 2 price marks in future with price movement forecast. Buy or sell decision and take profit size are displayed in a text label in the indicator window. The indicator uses another indicator as an engine for calculations - FreqoMet
Free automatic Fibonacci is an indicator that automatically plots a Fibonacci retracement based on the number of bars you select on the BarsToScan setting in the indicator. The Fibonacci is automatically updated in real time as new highest and lowest values appears amongst the selected bars. You can select which level values to be displayed in the indicator settings. You can also select the color of the levels thus enabling the trader to be able to attach the indicator several times with differe
FREE
The indicator detects and displays 3 Drives harmonic pattern (see the screenshot). The pattern is plotted by the extreme values of the ZigZag indicator (included in the resources, no need to install). After detecting the pattern, the indicator notifies of that by a pop-up window, a mobile notification and an email. The indicator highlights the process of the pattern formation and not just the complete pattern. In the former case, it is displayed in the contour triangles. After the pattern is com
Expert Advisor designed for trading Engulfing Candle Patterns within a manually input price range the D point of harmonic patterns , gartley , bat cypher butterfly ect.  This is the  full version , word test in the title is an error How Does It Work Step 1 Identify a price range around the end point D of your harmonic pattern. Input two prices into the EA settings   Inp9 Upper Level- type the highest price where an engulfing candle pattern can occur. Inp9 Lower Level - type the lowest price whe
FREE
KT Renko Patterns MT4
KEENBASE SOFTWARE SOLUTIONS
2.33 (3)
KT Renko Patterns scans the Renko chart brick by brick to find some famous chart patterns that are frequently used by traders across the various financial markets. Compared to the time-based charts, patterns based trading is easier and more evident on Renko charts due to their uncluttered appearance. KT Renko Patterns features multiple Renko patterns, and many of these patterns are extensively explained in the book titled Profitable Trading with Renko Charts by Prashant Shah. A 100% automated
Description:  For a comprehensive understanding of our indicators, we invite you to explore the entire Q&A section within this MQL5 blog post   here . The "Divergence Strategy Indicator" is an advanced technical analysis tool designed to identify potential trend reversals and trend continuation opportunities in the market. It leverages the concept of divergence, a powerful phenomenon that occurs when price action diverges from an oscillator, indicating underlying shifts in market sentiment. Spot
Noize Absorption Index MT4
Ekaterina Saltykova
5 (1)
Noize Absorption Index - is the manual trading system that measures the difference of pressure between bears forces and bulls forces. Green line - is a noize free index that showing curent situation. Zero value of index shows totally choppy/flat market.Values above zero level shows how powerfull bullish wave is and values below zero measures bearish forces.Up arrow appears on bearish market when it's ready to reverse, dn arrow appears on weak bullish market, as a result of reverse expectation. S
Les motifs harmoniques sont les mieux adaptés pour prédire les points de retournement du marché. Ils offrent un taux de réussite élevé et de nombreuses opportunités de trading en une seule journée de trading. Notre indicateur identifie les motifs harmoniques les plus populaires en se basant sur les principes énoncés dans la littérature sur le trading harmonique. REMARQUES IMPORTANTES : L'indicateur ne repeint pas, ne prend pas de retard (il détecte un motif au point D) et ne redessine pas (le mo
FREE
Description: The indicator shows the TDI indicator in a separate window, and with the RSI component, the indicator finds possible divergences with M or W patterns. KEY LINKS:   How to Install  -   Frequent Questions  -  All Products  Functions: Finds Market Makers patterns. Finds extremes or exhaustion into the market. Looks for a trend continuation. Content: TDI Indicator Divergence and M or W Signals Note 1:  This indicator should only be considered as a part of any trading strategy. You shoul
Trade with Gann on your side!! MASTER CIRCLE 360 CIRCLE CHART, originally created by Gann admitted that this is “The Mother of all charts”. It is one of the last studies that this great trader left for us. The numeric tab le is apparently quite simple like all the tables and is based on square numbers, the SQUARE OF 12 and is by evolution, one of the most important square numbers. Here we can find CYCLE, PRICE AND TIME thanks to angles and grades, to show past and future support and resistance.
L'indicateur construit les cotations actuelles, qui peuvent être comparées aux cotations historiques et, sur cette base, faire une prévision de l'évolution des prix. L'indicateur dispose d'un champ de texte pour une navigation rapide jusqu'à la date souhaitée. Option : Symbole - sélection du symbole que l'indicateur affichera ; SymbolPeriod - sélection de la période à partir de laquelle l'indicateur prendra des données ; IndicatorColor - couleur de l'indicateur ; HorisontalShift - décalage
TrendPlus
Sivakumar Subbaiya
4 (13)
Trend Plus   Trendplus  Indicator   Time Frame: Suitable for any time frame.  Purpose: Trend Prediction. Blue and red candle indicate the buy and sell call respectively. Buy: When the blue candle is formed buy call is initiated. close the buy trades when the next red candle will formed.   Sell: When the Red candle is formed Sell call is initiated. close the Sell trades when the next blue candle will formed.   Happy trade!!
FREE
The main idea of this indicator is rates analysis and prediction by Fourier transform. Indicator decomposes exchange rates into main harmonics and calculates their product in future. You may use the indicator as a standalone product, but for better prediction accuracy there is another related indicator - FreqoMaster - which uses FreqoMeterForecast as a backend engine and combines several instances of FreqoMeterForecast for different frequency bands. Parameters: iPeriod - number of bars in the ma
Indicateur Crypto_Forex "WPR et 2 moyennes mobiles" pour MT4, sans repeinture. - WPR lui-même est l'un des meilleurs oscillateurs pour le scalping. - L'indicateur "WPR et 2 moyennes mobiles" vous permet de voir les moyennes mobiles rapides et lentes de l'oscillateur WPR. - L'indicateur donne la possibilité de voir les corrections de prix très tôt. - Il est très facile de configurer cet indicateur via des paramètres, il peut être utilisé sur n'importe quelle période. - Vous pouvez voir les cond
Night Scalper EA Lite
Robots4Forex Ltd
2.33 (3)
The Night Scalper EA Lite is a fully automated Expert Advisor that trades at night and relies on price reversion. The EA trades using market orders and has the option to use time averaging to improve performance. This EA works best on EURUSD using the M5 timeframe, but will also work on AUDUSD, GBPUSD, NZDUSD, USDCAD, USDCHF and likely many more. A VPS is advisable when trading this system and a low spread and commission based broker is best. Check the comments for back test results and optimiz
FREE
Price Breakout pattern Scanner is the automatic scanner for traders and investors. It can detect following patterns automatically from your chart. Head and Shoulder - Common tradable pattern. Reverse Head and Shoulder - This pattern is the reverse formation of the Head and Shoulder. Double Top - When the price hits resistance level twice and decline toward the support level, the trader can anticipate sudden bearish breakout through the support level. Double Bottom - The double bottom pattern is
Les acheteurs de ce produit ont également acheté
Trade Assistant MT4
Evgeniy Kravchenko
4.43 (181)
It helps to calculate the risk per trade, the easy installation of a new order, order management with partial closing functions, trailing stop of 7 types and other useful functions. Additional materials and instructions Installation instructions   -   Application instructions   -   Trial version of the application for a demo account Line function -   shows on the chart the Opening line, Stop Loss, Take Profit. With this function it is easy to set a new order and see its additional characteris
Bienvenue sur Trade Manager EA, l’outil ultime de gestion des risques conçu pour rendre le trading plus intuitif, précis et efficace. Ce n’est pas seulement un outil d’exécution d’ordres ; c’est une solution complète pour la planification des trades, la gestion des positions et le contrôle des risques. Que vous soyez débutant, trader expérimenté ou scalpeur ayant besoin d’une exécution rapide, Trade Manager EA s’adapte à vos besoins, offrant une flexibilité sur tous les marchés, des devises et i
Local Trade Copier EA MT4
Juvenille Emperor Limited
5 (85)
Découvrez une expérience exceptionnellement rapide de copie de trades avec le Local Trade Copier EA MT4 . Avec sa configuration facile en 1 minute, ce copieur de trades vous permet de copier des trades entre plusieurs terminaux MetaTrader sur le même ordinateur Windows ou Windows VPS avec des vitesses de copie ultra-rapides de moins de 0.5 seconde. Que vous soyez un trader débutant ou professionnel, le Local Trade Copier EA MT4 offre une large gamme d'options pour le personnaliser en fonction d
The product will copy all telegram signal to MT4   ( which you are member  ) , also it can work as remote copier.  Lunar new year 2025 - price 169 until Jan 31, 2025 Easy to set up, copy order instant, can work with almost signal formats, image signal, s upport to translate other language to English Work with all type of channel or group, even channel have "Restrict Saving Content", work with  multi channel, multi MT5 Work as remote copier: with signal have ticket number, it will copy exactly vi
Exp COPYLOT CLIENT for MT4
Vladislav Andruschenko
4.7 (64)
Copieur commercial pour MetaTrader 4.       Il copie les transactions de change, les positions et les ordres de tous les comptes. C'est l'un des meilleurs copieurs commerciaux       MT4 - MT4, MT5 - MT4       pour le       COPYLOTE MT4       version (ou       MT4 - MT5 MT5 - MT5       pour le       COPYLOTE MT5       version). Version MT5 Description complète   +DEMO +PDF Comment acheter Comment installer     Comment obtenir des fichiers journaux     Comment tester et optimiser     Tous les p
Le MT4 to Telegram Signal Provider est un outil facile à utiliser et entièrement personnalisable qui permet d'envoyer des signaux à Telegram, transformant ainsi votre compte en fournisseur de signaux. Le format des messages est entièrement personnalisable ! Cependant, pour une utilisation simple, vous pouvez également opter pour un modèle prédéfini et activer ou désactiver des parties spécifiques du message. [ Démonstration ]   [ Manuel ] [ Version MT5 ] [ Version Discord ] [ Canal Telegram ] C
Custom Alerts MT4
Daniel Stein
5 (4)
Custom Alerts : Surveillez plusieurs marchés et ne ratez plus aucune opportunité clé Vue d’ensemble Custom Alerts est une solution dynamique pour les traders souhaitant suivre, de manière centralisée, les signaux potentiels sur différents instruments. En intégrant les données de nos outils phares — comme FX Power, FX Volume et IX Power — Custom Alerts vous informe automatiquement des évolutions cruciales du marché, sans avoir à jongler entre de multiples graphiques ou risquer de passer à côté
Telegram To MT4 Receiver
Levi Dane Benjamin
5 (4)
Copiez les signaux de n'importe quel canal dont vous êtes membre (y compris privé et restreint) directement sur votre MT4.  Cet outil a été conçu en pensant à l'utilisateur tout en offrant de nombreuses fonctionnalités dont vous avez besoin pour gérer et surveiller les transactions. Ce produit est présenté dans une interface graphique conviviale et visuellement attrayante. Personnalisez vos paramètres et commencez à utiliser le produit en quelques minutes ! Guide de l'utilisateur + Démo  | Ver
Trade Dashboard MT4
Fatemeh Ameri
5 (43)
Tired of complex order placement and manual calculations? Trade Dashboard is your solution. With its user-friendly interface, placing orders becomes effortless, by a single click, you can open trades, set stop loss and take profit levels, manage trade lot size, and calculate risk to reward ratios, allowing you to only focus on your strategy. Say goodbye to manual calculations and streamline your trading experience with Trade Dashboard. Download  Demo Version  right now. You can find  Details of
Négociez automatiquement les zones de support et de résistance ou d'offre et de demande une fois que vous avez identifié les zones clés à partir desquelles vous souhaitez négocier. Cet EA vous permet de dessiner des zones d'achat et de vente en un seul clic, puis de les placer exactement là où vous vous attendez à ce que le prix change. L'EA surveille ensuite ces zones et effectuera automatiquement des transactions en fonction de l'action des prix que vous spécifiez pour les zones. Une fois la
Trade Manager MT4 DaneTrades
Levi Dane Benjamin
4.33 (9)
Trade Manager pour vous aider à entrer et sortir rapidement des transactions tout en calculant automatiquement votre risque. Y compris des fonctionnalités pour vous aider à éviter le sur-trading, le trading de vengeance et le trading émotionnel. Les transactions peuvent être gérées automatiquement et les mesures de performances du compte peuvent être visualisées dans un graphique. Ces fonctionnalités rendent ce panneau idéal pour tous les traders manuels et contribuent à améliorer la plateforme
The News Filter
Leolouiski Gan
5 (24)
Ce produit filtre tous les conseillers experts et les graphiques manuels pendant les heures de publication des actualités, de sorte que vous n'avez pas à vous soucier des pics de prix soudains qui pourraient détruire vos configurations de trading manuelles ou les transactions entrées par d'autres conseillers experts. Ce produit est également livré avec un système de gestion des ordres complet qui peut gérer vos positions ouvertes et vos ordres en attente avant la publication de toute actualité.
Take a Break
Eric Emmrich
5 (28)
The most advanced news filter on MQL market Take a Break has transformed from a basic news filter into a comprehensive account protection solution. It seamlessly pauses any other Expert Advisors during news events or based on your custom filters, all while safeguarding your EA settings - restoring them automatically when trading resumes for complete peace of mind. Typical use cases: A single news filter for all your EAs. Stop trading during news/high volatility (+ close all trades before). Stop
TradePanel MT4
Alfiya Fazylova
4.9 (86)
Trade Panel est un assistant commercial multifonctionnel. L'application contient plus de 50 fonctions de trading pour le trading manuel et vous permet d'automatiser la plupart des opérations de trading. Attention, l'application ne fonctionne pas dans le testeur de stratégie. Avant d'acheter, vous pouvez tester la version démo sur un compte démo. Version démo ici . Instructions complètes ici . Commerce. Permet d'effectuer des opérations de trading en un clic : Ouvrez des ordres et des positions e
The Expert Advisor will help you forward all pop-up alert with screenshot from  MetaTrader 4 to Telegram channel/ group, also forward all notifications to Telegram. Parameters  -  Telegram Bot Token - create bot on Telegram and get token.  -  Telegram Chat ID  - input your Telegram user ID,  group / channel ID  -  Forward Alert - default true, to forward alert.  -  Send message as caption of Screenshot - default false, set true to send message below Screenshot  How to setup and guide  - Telegram
TPSpro Trade PRO
Roman Podpora
4.6 (5)
EN MODE TEST (dans le testeur), la fonctionnalité du panneau n'est PAS ACTIVE. Nous avons seulement fourni une représentation visuelle du panneau lui-même. Un outil capable de calculer instantanément la taille ou le risque de la position en fonction d'un niveau de stop loss donné est essentiel tant pour les traders professionnels que pour les débutants. L'utilitaire de trading TRADE PRO fournit des calculs rapides et précis, vous aidant à prendre des décisions dans des conditions de temps limit
2025 happy new year -50% discount ($199 -> $99) Advanced trading tool: One click smart orders that execute under your conditions Developed by trader for trading community:  position size calculator (lot size), open position after price action, strategy builder, set and forget trading, mobile notifications... Risk Management -  Risk percentage position size calculator, gain percentage, target risk reward ratio, spread and commissions are included in calculations 7 Advanced order types   - Set a
Summer 40% discount ($149 -> $88) Everything for chart Technical Analysis indicator mt4 in one tool Draw your supply demand zone with rectangle and support resistance with trendline and get alerts to mobile phone or email alert -  Risk reward indicator Video tutorials, manuals, DEMO download   here .  Find contacts on my   profile . 1.   Extended rectangles and trendlines Object will be extended to the right edge of the chart when price will draw new candles on chart. This is rectangle extende
Le MT4 to Discord Signal Provider est un outil convivial et entièrement personnalisable conçu pour envoyer directement des signaux de trading à Discord. Cet outil transforme votre compte de trading en un fournisseur de signaux efficace. Personnalisez les formats de messages pour qu'ils correspondent à votre style ! Pour plus de facilité, choisissez parmi des modèles pré-conçus et décidez quels éléments du message inclure ou exclure. [ Démo ] [ Manuel ] [ Version MT5 ] [ Version Telegram ] Confi
The utility is designed to send signals from MT4 to Telegram. It has several unique features, allowing not only the sending of trade signals but also the following functionalities: Send messages directly from the terminal to Telegram Send emojis along with custom text Send text and images from Telegram All of these features enable users to manage a signal channel while focusing on trading and finding quality signals. Customizable Signal Messages You can fully customize the signal message: Specif
Telegram to MT4 Coppy
Sergey Batudayev
5 (2)
Telegram to MT4: The Ultimate Signal Copying Solution Streamline your trading with Telegram to MT4 , the cutting-edge utility designed to copy trading signals directly from Telegram channels and chats to your MetaTrader 4 platform—without the need for DLLs. This robust solution ensures seamless execution of signals with unparalleled precision and customization options, saving you time and boosting your efficiency. [Instructions ] [ DEMO ] Key Features Direct Telegram API Integration Authenticate
Darwin Reports Tool EA Prix de lancement exceptionnel !    35 USD DESCRIPTIONS : Darwin Reports Tool EA est le nouveau produit de la gamme Darwin. Les produits Darwin sont reconnus et réputés sur MQL5 pour les qualités et leurs performances. Cette fois ce n'est pas un Expert Advisor que je vous propose, mais un utilitaire destiné a automatisé des taches. Essentiellement, faire des rapports de vos performances EXPLICATIONS : Effectivement, grâce à cet utilitaire, vous aurez la possibilité
RSI Divergence Scanner is a multi-timeframe and multi-symbol dashboard and alert that checks all timeframes and symbols to find divergences between price chart and RSI indicator. This divergence scanner is integrated with support and resistance zones so you can check the RSI divergences in the most important areas of the chart to find trend reversals in the price chart. Download demo version   (works on M 1,M5,M30,W1 timeframes) Full description of scanner parameters ->   click here . How to get
RedFox Copier Pro
Rui Manh Tien
4.73 (11)
Time saving and fast execution Whether you’re traveling or sleeping, always know that Telegram To Mt4 performs the trades for you. In other words, Our   Telegram MT4 Signal Trader  will analyze the trading signals you receive on your selected Telegram channels and execute them to your Telegram to MT4 account. Reduce The Risk Telegram To Mt4   defines the whole experience of copying signals from   Telegram signal copier to mt4 platforms. Users not only can follow all instructions from the signa
Copieur ->Interaction d'interface pratique et rapide, les utilisateurs peuvent l'utiliser immédiatement       ->>>> Recommandé pour une utilisation sur des ordinateurs Windows ou VPS Windows Caractéristiques: Paramètres de copy trading diversifiés et personnalisés : 1. Différents modes de lot peuvent être définis pour différentes sources de signaux 2. Différentes sources de signaux peuvent être définies pour le copy trading avant et arrière 3. Les signaux peuvent être définis avec des commentai
Unlimited Trade Copier Pro is a tool to copy trade remotely to multiple MT4, MT5 and cTrader accounts at different computers/locations over internet. This is an ideal solution for you if you are a signal provider and want to copy your trades to other receivers globally on your own rules. One provider can copy trades to multiple receivers and one receiver can get trade from multiple providers as well. The provider can even set the subscription expiry for each receiver, so that receiver will not b
Virtual KillerTrade
Antonis Michos
5 (12)
-40% OFF Telegram Group: Find the link in my profile or contact me Welcome. Virtual Killer Trade is an exceptional EA which : Guides you WHEN to open the FIRST trade. After that an intelligent system starts to manage that trade and you do not have to worry when to close it neither when you must open a second or third etc one !!! Attach the EA, wait for the signal,open the trade and then go to sleep !!! FOR more experienced traders,you do not have to wait for a signal.Open the first tra
VirtualTradePad mt4 Extra
Vladislav Andruschenko
4.88 (57)
Panneau de trading pour trader en 1 clic.   Travailler avec des positions et des commandes!   Trading à partir du graphique ou du clavier. En utilisant notre panel de trading, vous pouvez trader en un clic à partir du graphique et effectuer des opérations de trading 30 fois plus rapidement que le contrôle MetaTrader standard. Des calculs automatiques de paramètres et de fonctions qui facilitent la vie d'un trader et aident un trader à mener ses activités de trading beaucoup plus rapidement et pl
Exp Averager
Vladislav Andruschenko
4.81 (21)
Exp-Averager   est conçu pour faire la moyenne de vos transactions qui ont reçu un certain retrait en ouvrant des transactions de moyenne. Le conseiller a la possibilité d'ouvrir de nouvelles positions en tendance ou à contre-courant. Il comprend également une fonction intelligente de stop suiveur qui s'applique à une série de positions. Le conseiller peut augmenter ou diminuer la taille du lot des positions. Il s'agit d'une stratégie largement utilisée pour ramener les positions perdantes au p
Grid Manual MT4
Alfiya Fazylova
4.71 (17)
Grid Manual est un panneau de trading permettant de travailler avec une grille d'ordres. L'utilitaire est universel, possède des paramètres flexibles et une interface intuitive. Il fonctionne avec une grille d'ordres non seulement dans le sens des pertes, mais aussi dans le sens de l'augmentation des profits. Le commerçant n'a pas besoin de créer et de maintenir une grille d'ordres, l'utilitaire le fera. Il suffit d'ouvrir une commande et "Grid Manual" créera automatiquement une grille de comman
Plus de l'auteur
This indicator is designed for monitoring RSI levels on the current and higher timeframes. The control panel is user friendly and consists of buttons, with which you can control the display of lines as per the names of the buttons. The button color matches the line color. Parameters "___| Settings of the main indicator " RSI Period - averaging period for index calculation (default is 14); RSI Price type - price used for calculations (default is the Close price); "___| Color palette " Text color

This is a well-known ZigZag indicator. But it differs by the fact that its plot is based on values of the middle line which is set by a user. It can display Andrews’ Pitchfork and standard or Bobokus Fibo levels. NO REPAINTING. Parameters Period МА — middle line period. Default value is 34. Minimum value is 4. Maximum value is set at your discretion. Used to calculate price - base price to calculate the middle line. The averaging method - method of smoothing the middle line. Turning pitchfork —

This is a well-known ZigZag indicator. But it differs by the fact that its plot is based on values of the middle line which is set by a user. It can display Andrews’ Pitchfork and standard or Bobokus Fibo levels. NO REPAINTING. Parameters Period МА — middle line period. Default value is 34. Minimum value is 4. Maximum value is set at your discretion. Used to calculate price — type of price used for the midline calculations. The averaging method — type of smoothing for the middle line. Turning p
This is an interactive and easy-to-set indicator which allows to form seven equally spaced channels which have your settings simultaneously. All seven channels are enabled by default. But you can easily enable one or another channel using control buttons located in the upper case of the indicator's control panel. You can change a period of the indicator calculation by clicking one of buttons indicating number of the channel in the lower case of the control panel. Two other buttons (one of them i
This EA represents an interactive panel with adjustable parameters destined for installation and deletion of pending orders (orders grid generator). You can place the panel anywhere on the screen or hide it into a dot clicking on the button in the upper left part of the chart (it will be shown after clicking on it for the second time). Number and step of orders, lot size, vertical shift for limit orders - all these things make your work easier. There are functions for restoring according to pend
The purpose of the indicator is drawing an equidistant channel. It is somewhat different from the traditional model. The choice of control parameters is simple and does not require any special description. Enter the calculation interval in hours and the solution to the problem will appear on the screen. Please note that the time involved in calculation of the channel must be greater than the timeframe it will be displayed on. If the parameters you enter are beyond the allowable limits, you will
This indicator is designed for drawing equidistant channels. Two options are available: based on the number of hours in the indicator calculation and by the number of bars. To draw a channel, enter a number 1 or greater. The maximum value is limited by the amount of visible bars. If the parameters you enter are beyond the allowable limits, you will get notified if the indicator restrictions. Please note that the time involved in calculation of the channel must be greater than the timeframe it wi
The indicator displays the moving average of all periods on one chart. It shows the MA of a one step lower timeframe and all the MAs equal to and higher than it. Parameters Period moving average - Moving Average period (default is 34); Used to calculate price - price used for the MA calculation (default is the average price = (high+low)/2); The averaging method - default is linear-weighted; Moving average shift - MA shift (default is 0). Just enter the MA calculation period and its parameters,
This indicator is designed for analyzing your positions on 30 financial instruments with the font size of the output information between 8 and 10. If the font size is 11 you will see only 26 instruments and so on: 12-25, 13-24, 14-20. The font size can range from 8 to 14. The main window contains buttons with names of financial instruments and lines where brief information about all open positions is displayed. Two columns show the total volumes in lots of positions in each trading direction: BU
This is a prototype of the famous Control and management of transactions panel. There are two main differences: Allows to work with all the variety of financial instruments opened by a user and not only with instruments it was attached to; To activate levels of order closure hidden from a broker, it uses not lines but modifiable virtual levels. To enjoy the full functionality of the panel you are advised to have: Desk analytical table . Their combined operation allows to keep the situation under
This is a prototype of the famous Control and management of transactions panel. There are two main differences: Allows to work with all the variety of financial instruments opened by a user and not only with instruments it was attached to; To activate levels of order closure hidden from a broker, it uses not lines but modifiable virtual levels. The EA will independently determine a total number of involved financial instruments, display them in the upper left window and locate the pointer on the
It is widely known that colors affect the emotional state of a human, especially if this human is a trader. Psychologists recommend that you follow your instincts and select the color of your environment that is most comfortable to you. In order to reduce emotional stress, impact of colors on a person should be considered. The optimal range of the most beneficial colors includes green, yellow-green and green-blue ones. This indicator allows you to manage your emotional state and health. Choose a
The indicator is based on the two-buffer scheme and does not require any additional settings. It can be used on any financial instrument without any restrictions. The indicator is a known ZigZag, but it does not redraw . The indicator allows to easily detect significant levels on the price chart, as well as demonstrates the ability to determine the probable direction of a price movement. The calculations are based on the candles' Close prices, thus improving the reliability of the levels. Param
The idea of the indicator stems from the necessity to clearly define the borders of support and resistance levels, which helps to plan the opening and closing of positions in the areas that most appropriately determine the process. Look at the breakdowns of the resistance level that confirm the intention of the price to continue the upward movement, after it passed the support level and entered the channel formed by the two levels. The same is for the case when the price enters the channel downw
This indicator is a logical extension of the product at https://www.mql5.com/en/market/product/12526 . The only difference is that price movement is displayed using a histogram with levels, allowing to assess the direction and strength of the movement. How to interpret the signal: 0 - the middle of the channel; above 0.5 - the breakdown of the channel up; below -0.5 - the breakdown of the channel down. Both indicators are displayed in the attached screenshots. Install the indicator and you will
Simple Line
Valeriy Medvedev
The indicator shows the levels of the past week and day. In addition, it draws a level in percentage. This level is specified relative to the difference between the High and Low of the past month and week. For the daily levels of the past day, the Close levels are additionally displayed. All you need to do is configure the display parameters of the levels to your liking. Parameters Over the past months installations - settings for the last months; PasteMonthsLines - the level display mode is on
This indicator is the logical continuation of the well-known equidistant channel indicator: https://www.mql5.com/en/market/product/8723 . The main purpose of the indicator is the visualization of price levels relative to the parallel channel using Fibo Bobokus levels in a separate window and the price history. This often allows forecasting the future price movement with a sufficiently high degree of probability. The Fibo levels calculation equation is as follows: FiboLevel = (50-(100*((Close[i]-
This simple to use utility allows opening charts from the list of financial instruments by left clicking their names. The chart window is opened using the Default template. The template name can be changed to one of those stored in Charts-Templates section of the terminal. It is possible to customize the background colors of panels and their labels, and also to select the display type for a more comfortable working environment. This is all you need to know in order to see the result quickly. Pa
This is an individual tool for analyzing the market situation. It is very simple to use. After attaching the indicator to the chart, you will see three vertical lines named "VLine 1", "VLine 2" and "VLine 3", following in this order from left to right. For the utility to operate correctly, this sequence should always be observed. Please note: at the first start, the lines are not bound to specific price levels on the chart. This should be done by user in accordance with the following rule: if li
This indicator displays a set of moving average lines across all higher timeframes. The indicator can be installed on any financial instrument and any timeframe. For the analysis of the lines, a panel with timeframe values is provided in the lower right corner. Using the panel, you can easily enable/disable the display of the MA line of any higher timeframe. This allows a more thorough analysis of the market situation. The color of the button matches the color of the moving average line. Parame
Этот индикатор предназначен для контроля уровней CCI на текущем и старших от него таймфреймах. Панель управления проста в понимании и состоит из кнопок, с помощью которых можно управлять отображением линий, соответствующим указанным на наименовании кнопок. Цвет кнопки совпадает с цветом линии. Этот индикатор из серии подобных индикаторов, которые уже успели завоевать популярность: https://www.mql5.com/ru/market/product/30276 и https://www.mql5.com/ru/market/product/30403 Параметры "___| Setti
The indicator is similar to https://www.mql5.com/en/market/product/12330 . However, it considers the MQL5 platform features. Peaks and bottoms are calculated based solely on external bars. After a swing is formed, the indicator does not redraw providing opportunities for traders working on horizontal level breakthroughs. Traffic can be reduced by changing the amount of calculated bars in the MinBars variable (default value is 500). All you need is to select the output options, so that you can se
The indicator is based on the two-buffer scheme and does not require any additional settings. It can be used on any financial instrument without any restrictions. The indicator is a known ZigZag, but it does not redraw . The indicator allows to easily detect significant levels on the price chart, as well as demonstrates the ability to determine the probable direction of a price movement. The calculations are based on the candles' Close prices, thus improving the reliability of the levels. Param
It is an analogue of the indicator of levels at https://www.mql5.com/en/market/product/24273 for the MetaTrader 5 platform. The indicator shows the levels of the past month, week and day. In addition, it draws a level in percentage relative to the difference between the High and Low of the past month and week. For the daily levels of the past day, the Close levels are additionally displayed. All you need to do is to configure the display parameters of the levels to your liking. In some cases, af
Filtrer:
asaens15
2126
asaens15 2020.10.15 11:29 
 

L'utilisateur n'a laissé aucun commentaire sur la note

Matthew Todorovski
12938
Matthew Todorovski 2018.06.16 11:10 
 

L'utilisateur n'a laissé aucun commentaire sur la note

Singgih Wasito Adhi
355
Singgih Wasito Adhi 2018.04.26 21:05 
 

L'utilisateur n'a laissé aucun commentaire sur la note

Tim Eubanks
5762
Tim Eubanks 2018.03.22 00:29 
 

L'utilisateur n'a laissé aucun commentaire sur la note

Alexey Suvorov
777
Alexey Suvorov 2018.02.28 02:21 
 

L'utilisateur n'a laissé aucun commentaire sur la note

Répondre à l'avis
Version 1.2 2018.12.13
v1.2-устранена ошибка отображения при перезагрузке терминала.
Version 1.1 2018.12.11
v1.1 - добавлена возможность увидеть результат в процентах от депозита