Detrended Price Oscillator SG
- Indicateurs
- Stuart Goodwin
- Version: 1.0
- Activations: 5
The Detrended Price Oscillator (DPO) removes longer term trends, isolating short term price cycles. It allows for determination of cycle length and prediction of the current place in the cycle, determination of bull or bear trends and trend turning points, and provides several trade entry signals.
There are two different ways of calculating the index, both of which are useful, and both of which are provided in the indicator parameters.
The default setting for the SMA Averaging Period (n) will not suit most markets and timeframes, and instead should be 'tuned' before use. Tuning is easy, and is described below.
Current Indicator
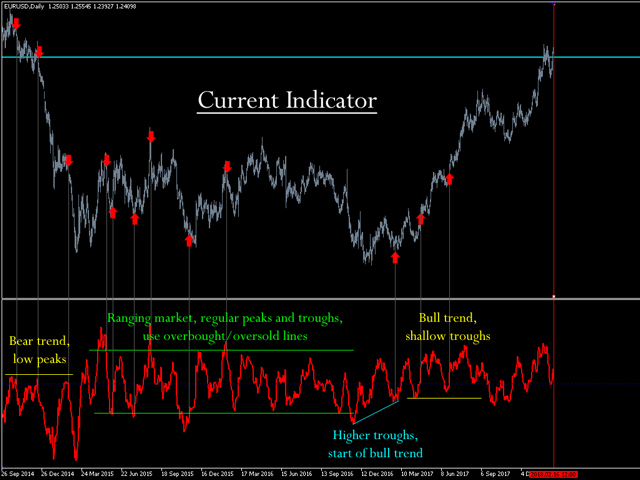
The Current Indicator helps isolate and determine short-term trends, changes in trend and offers several different trading signals.
It is calculated as the Closing Price now minus the SMA from (n/2+1) days ago.
The Indicator needs to be tuned in the same way as the Lagging, though in this case the broader price pattern won't completely disappear, but will instead give trend information. The tuning period will generally be different to the Lagging. I found 15 days to be suitable for the daily EURUSD in Feb 2018.
- Ranging Markets - a ranging market will be characterised by equal indicator highs and lows. Set overbought and oversold levels based on observation or past price behaviour and then sell when leaving an overbought zone / buy when leaving oversold
- Trending markets - a rising market will have normal peaks, but troughs just below the zero line. Only trade in the direction of the trend, and buy when the index crosses back above the zero line. Vice versa for falling markets.
- Trend Change - a change into a rising trend can be indicated by a higher trough than previous, and change to a falling trend by a lower peak. These can be used as aggressive trade entry points.
See the first screenshot below.
Lagging Indicator
This gives an accurate estimation of the short term cycle length, and can be projected to give the current place in the cycle.
It is the Closing Price (n/2+1) bars ago minus the n-period Simple Moving Average (SMA) for the current date, and is shifted backward on the plot to (n/2+1) bars ago.
When a properly tuned value of n is found, the indicator should resemble a simple sinewave giving a regular short-term cycle length.
The indicator is delayed and is drawn shifted to the left so it isn't plotted up to the current time. But it is easy to project forward to the current time since it is delayed by half a cycle. Thus, if the last drawn indicator value is at a minimum, then the projection of the current value would be at a maximum. If the last drawn value is at a maximum then the projection to now would be at a minimum. If last drawn value is rising through zero then the projection would be falling through zero, and so on.
The second screenshot shows a properly tuned Lagging Indicator for EURUSD. Tuned to 40 days, it clearly shows the regular cyclicality, and the projection for the last period is shown.
The Lagging Indicator does not give trade signals by itself, but can be used as supporting evidence for trade signals determined by other technical indicator techniques. For example, if price is nearing a resistance level at the same time that the projected index is nearing a maximum, or price is nearing support when the projected index is at a minimum, then the index gives extra comfort that the resistance or support level will hold, but an approach to a resistance or support line out of cycle might give a warning that the level may be breached.
Tuning
Tuning is easy. Start off with a level that is clearly too high, say 100 days. The indicator drawn then will clearly show patterns from the broader price graph, with higher and lower areas. As you reduce the period, by 10's and then by 5's, then the broader price pattern will start to get smoothed out and disappear and there will come a point where the price pattern is completely gone and the indicator resembles a sinewave graph. If you go too far, then it will lose the sinewave appearance, and will start to look spiky and noisy.
Indicator parameters
- SMA Averaging Period ('n') - the number of bars used for indicator calculation. Needs to be tuned, refer to the 'Tuning' paragraph above.
- Select 'false' for Lagging Indicator, 'true' for Current Price - enables selection which of the two indicators to display.


