AccumZone
- Indicateurs
- Vasiliy Pushkaryov
- Version: 1.0
- Activations: 10
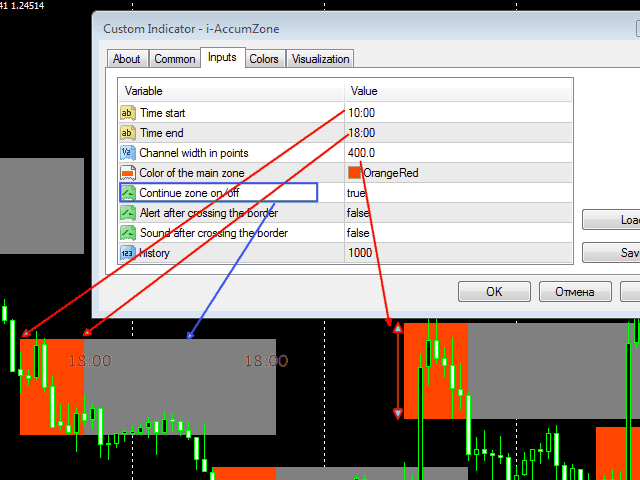
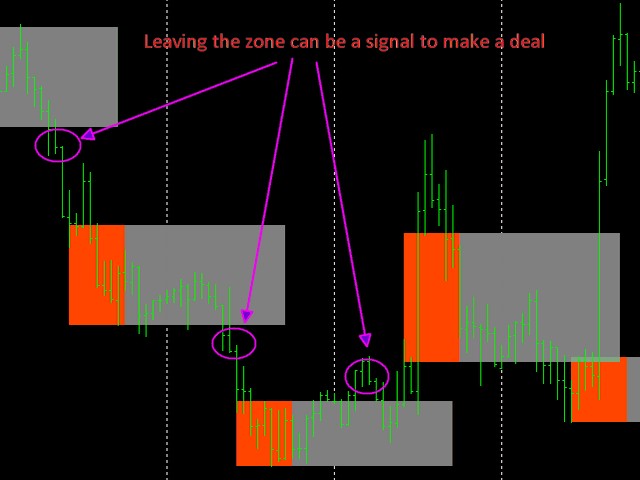
The indicator finds price accumulation areas in a specified price range and time interval. By setting time to 10-18:00 and area width to 40 points, the indicator finds the area having the specified width that was most often touched by the candles in this time interval. Until 19:00, the area within the current day can move. With the first tick from 19:00, the main area is fixed and not re-painted. If Continue zone is enabled, the area having another color is set on this level after fixing the main area up to 18:00 of the next day. This channel can be interpreted as a support, resistance or re-test level.
The indicator works on M1-H1 timeframes. The screenshots provide some options of applying the indicator. It can also be used as a support/resistance level.
General settings
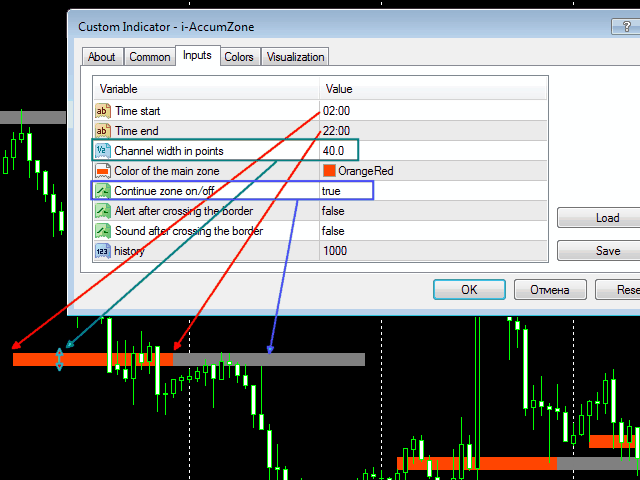
- Time start - time in each new day for starting the countdown of price clusters (00-23:00);
- Time end - time in each new day for ending the countdown of price clusters (00-23:00);
- Channel width in points - area width touched by the price;
- Color of the main zone - main area price (make sure to set different colors on a single chart for two and more indicators);
- Continue zone on/off - extend the area until the next day specified by 'Time end' of another color;
- Alert after crossing the border - trigger a message after an upper or lower border of the area is crossed;
- Sound after crossing the border - trigger a signal after an upper or lower border of the area is crossed;
- history - number of bars back to history to be analyzed for accumulation areas.
