Trend Signal Multi Timeframe mt5
- Indicateurs
- Massimiliano Pirola
- Version: 1.5
- Mise à jour: 20 décembre 2018
- Activations: 5
Do you want to always know in a quick glance where price is going? Are you tired of looking back and forth between different timeframes to understand that?
This indicator might just be what you were looking for.
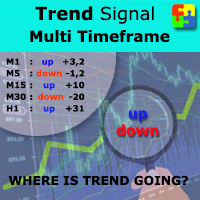
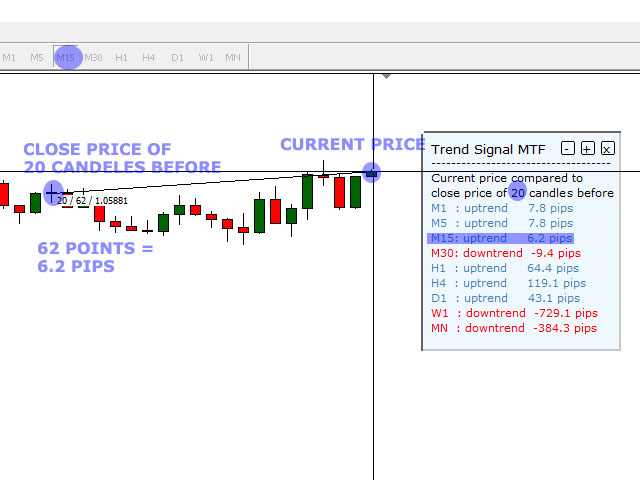
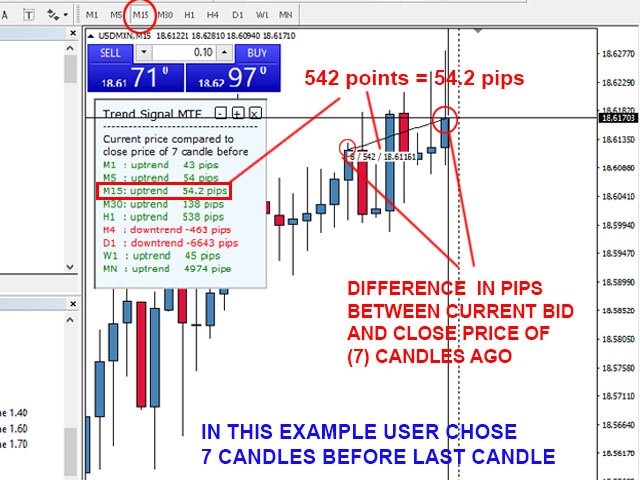
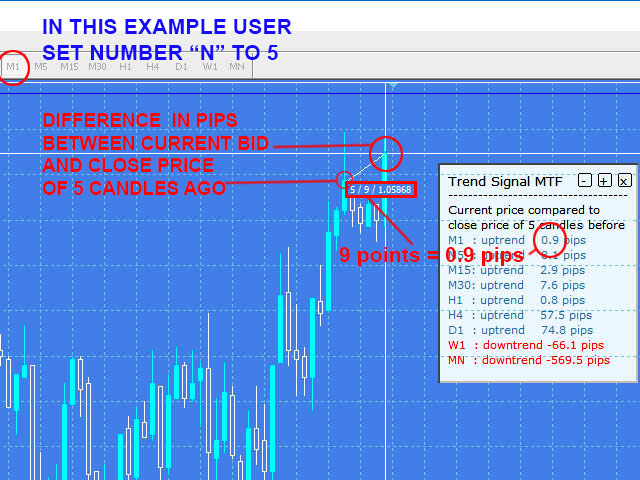
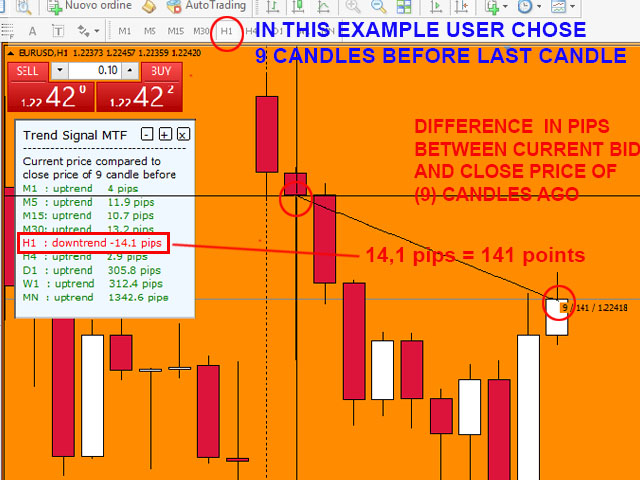
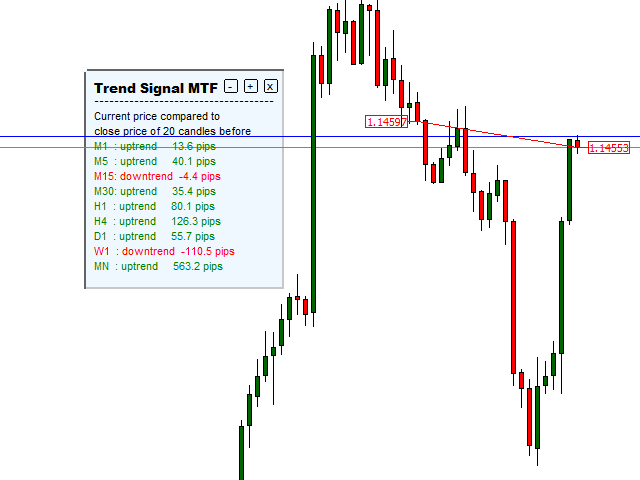
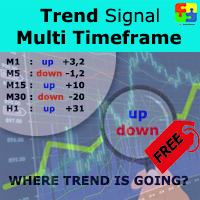
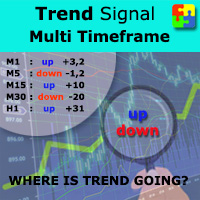
Trend Signal Multitimeframe shows you if the current price is higher or lower than N. candles ago, on the various timeframes. It also displays how many pips higher or lower current price is compared to N. candles ago.
- Number N. is customizable
- The data is shown in a window that you can move around.
- Colors are also customizable.
- You can also choose if you want data to be shown in foreground or background compared to the chart candles.
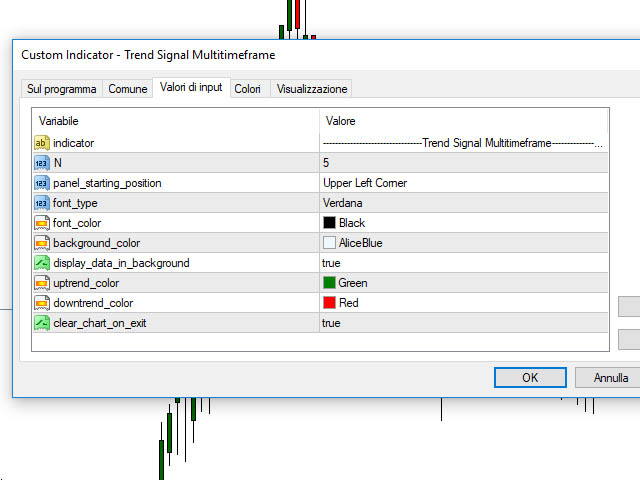
Settings
- N: Number of the candle of reference
- panel_starting_position: Position on the screen where you want data to first appear
- font_type: Font of the writings
- font_color: Color of the main writings
- background_color: Background color of the data displayed
- display_data_in background: if false, data will cover the candles on the chart
- uptrend_color: Color of the writings when trend is up
- downtrend_color: Color of the writings when trend is down
- clear_chart_on_exit: Select true if you want data to disappear on indicator close











Nothing to write home to mom about. Sort of like a CSM, but more simple. Again, as with most of my complaints, the data depends upon the individual Broker and the indicator will give different results on two of my screens. For example, at the time of this review, USDSGD M1 timeframe shows uptrend 10.5 pips. However, the other chart shows uptrend, 1.0 pips. That is quite a difference for me to trade. The daily show an uptrend 41.2 pips, but the other is uptrend with 36.4 pips. This is the problem we face when we buy an indicator that is effected by the different spreads and so the number cannot be relied upon. The nice thing is that I didnt go broke learning this. This is why the 3 stars.