• Aperçu
  • Avis (15)
  • Commentaires (75)
  • Nouveautés

Dashboard Stochastic Multicurrency

5
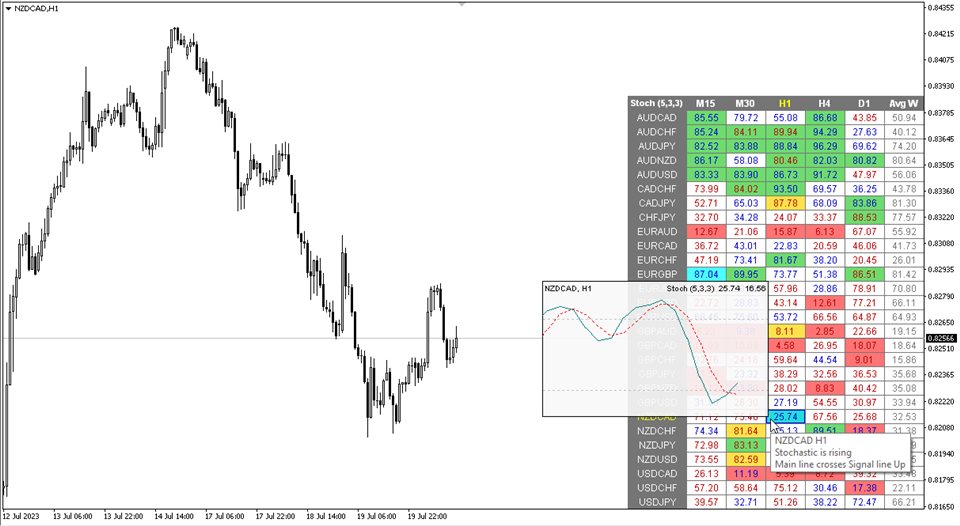
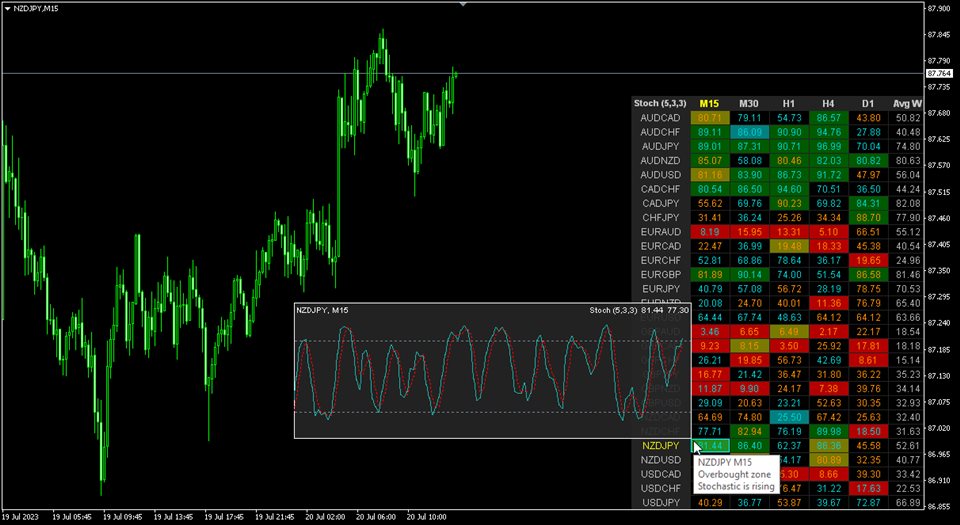
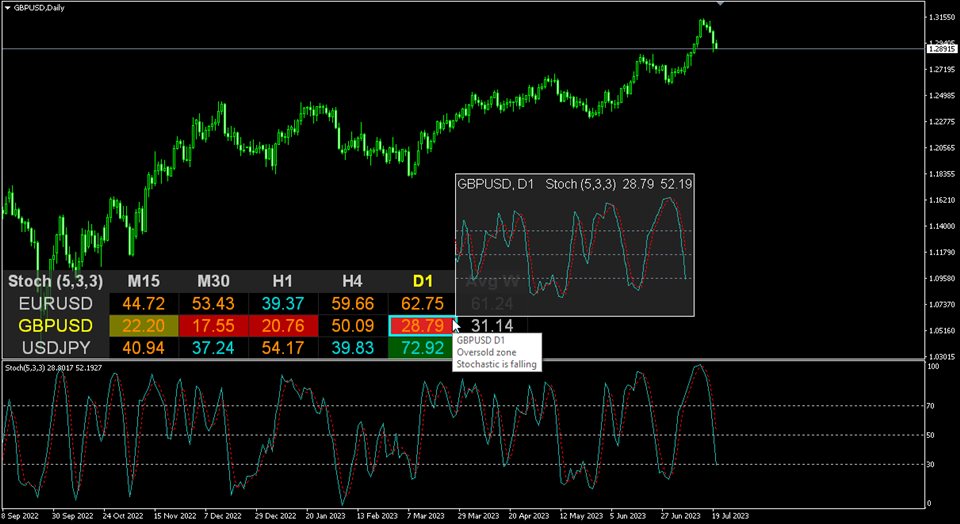
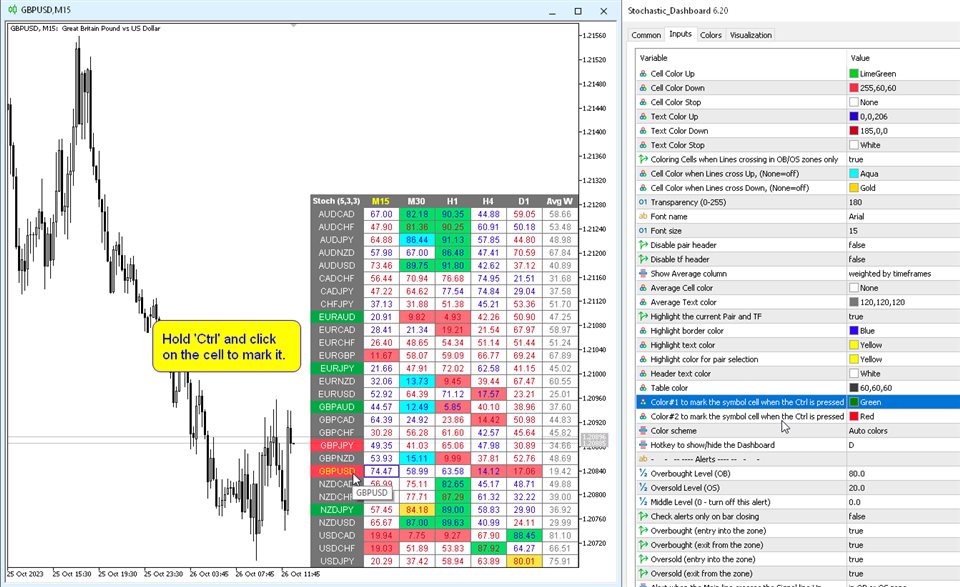
Modification multidevises et multitemporelles de l'oscillateur stochastique. Vous pouvez spécifier les devises et les délais souhaités dans les paramètres. Le panneau affiche les valeurs actuelles et les intersections des lignes — Signal et Principal (croisement stochastique). En outre, l'indicateur peut envoyer des notifications lors du franchissement des niveaux de surachat et de survente. En cliquant sur une cellule avec un point, ce symbole et ce point seront ouverts. Il s'agit du scanner MTF.

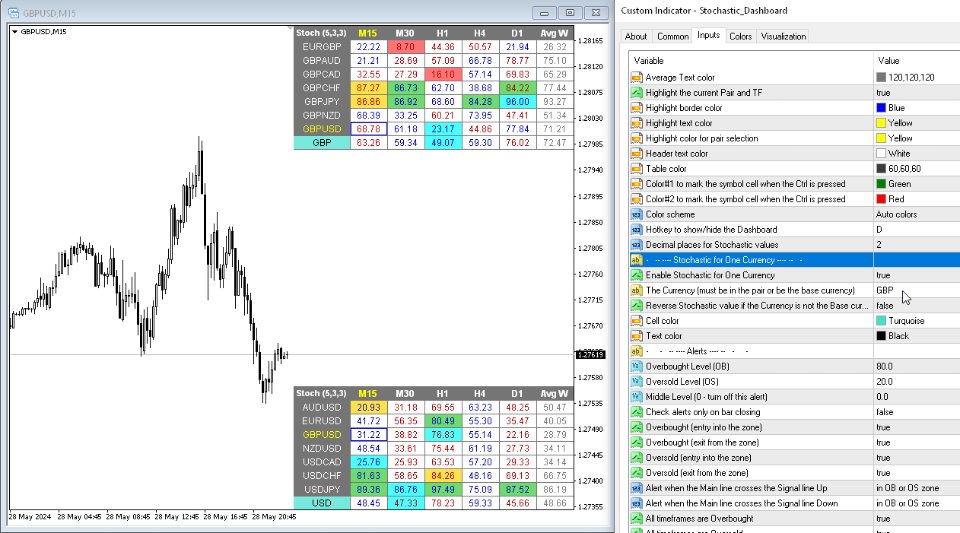
Semblable au Currency Strength Meter (CSM), le tableau de bord peut sélectionner automatiquement les paires qui contiennent une devise spécifiée, ou les paires qui ont cette devise comme devise de base. L'indicateur recherche la devise dans toutes les paires spécifiées dans « Ensemble de paires » ; les autres paires sont ignorées. Et sur la base de ces paires, le stochastique total pour cette devise est calculé. Et vous pouvez voir à quel point cette monnaie est forte ou faible.

La clé pour masquer le tableau de bord du graphique est "D" par défaut.


Paramètres

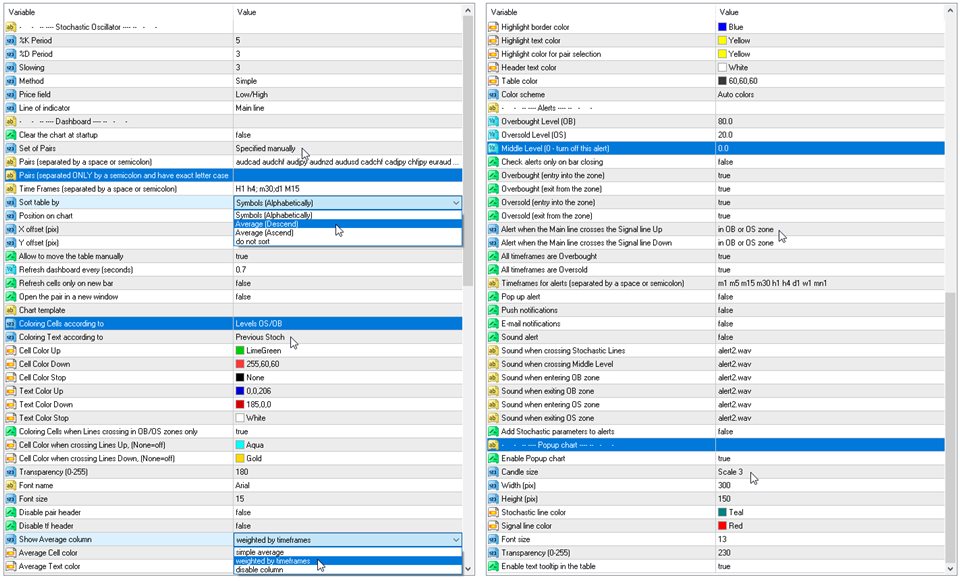
%K Period — la période de la ligne K.
%D Period — la période de la ligne D.
Slowing — ralentissement;
Method — méthode de calcul de la moyenne;
Price field — type de prix.
Line of indicator — indice de ligne.
Clear the chart at startup — effacez le graphique au démarrage.
Set of Pairs — ensemble de symboles :
— Market Watch — paires du « Market Watch ».
— Specified manually — paires spécifiées manuellement, dans les paramètres "Paires".
— Current pair — affiche uniquement la paire actuelle.
Pairs (separated by a space or semicolon) — liste de symboles séparés par des espaces ou des points-virgules. Les noms des devises doivent être écrits exactement comme ceux du courtier, en conservant la casse et le préfixe/suffixe.
Time Frames (separated by a space or semicolon) — liste de délais séparés par des espaces ou des points-virgules (multi-périodes).
Sort pairs — trier la liste des paires.
Position on chart — coin pour afficher le panneau sur la carte.
X offset (pix) — décale le panneau le long de l'axe X ;
Y offset (pix) — décale le panneau le long de l'axe Y ;
Refresh dashboard every (seconds) — période de mise à jour pour toutes les paires et toutes les périodes.
Open the pair in a new window — ouvrez un symbole dans une nouvelle fenêtre graphique en cliquant.
Chart template — nom du modèle du graphique, si le graphique s'ouvre dans une nouvelle fenêtre.
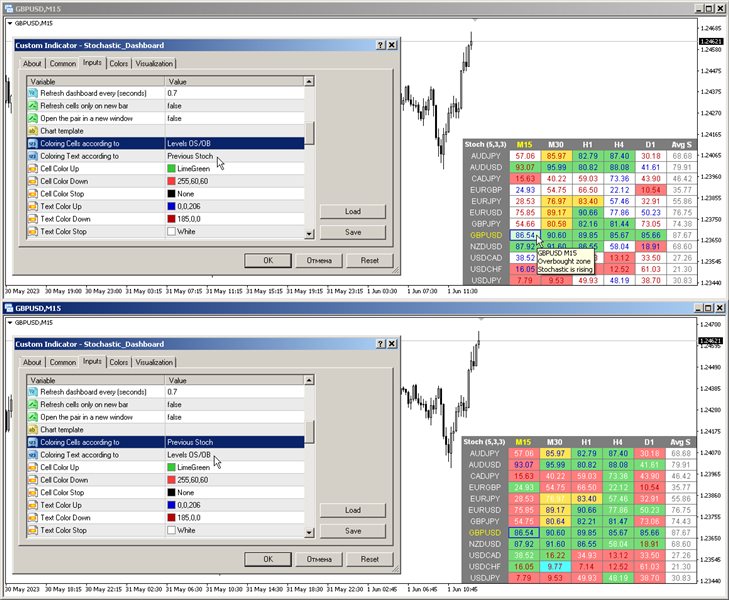
Coloring the cells according to the — couleur des cellules du tableau selon les niveaux de surachat/survente ou selon la direction de la bougie précédente.
Check Lines crossing only in OB/OS zones — déterminez l'intersection des lignes uniquement dans les zones de surachat/survente.

Paramètres de couleur
Color Up — couleur de la cellule si l'indicateur augmente ou dépasse le niveau de surachat.
Color Down — couleur de la cellule si l'indicateur diminue ou dépasse le niveau de survente.
Color Stop — couleur des cellules si l’indicateur ne change pas.
Color when crossing Lines Up — couleur de la cellule lorsque la ligne principale traverse la ligne de signal.
Color when crossing Lines Down — couleur de la cellule lorsque la ligne principale traverse la ligne de signal vers le bas.
Transparency (0-255) — transparence du panneau.
Font name — nom de la police.

Alertes
Overbought level — niveau de surachat pour les alertes.
Oversold level — niveau de survente pour les alertes.
Middle Level (0 — turn off this alert) — contrôle du troisième passage à niveau (alerte uniquement). Si zéro est spécifié, la vérification de ce niveau est désactivée.
Check alerts only on bar closing — vérifiez les alertes uniquement lorsque le bar est fermé.
Overbought/Oversold (entry into the zone) — envoie une alerte lorsque vous entrez dans la zone de surachat ou de survente.
Overbought/Oversold (exit from the zone) — envoie une alerte lorsque vous quittez la zone de surachat ou de survente.
Main line crosses the Signal line Up — alerte lorsque la ligne principale traverse la ligne de signal.
Main line crosses the Signal line Down — alerte lorsque la ligne principale traverse la ligne de signal vers le bas.
All timeframes are Overbought/Oversold — alerte lorsque toutes les périodes entrent dans la zone de surachat ou de survente.
Timeframes for alerts (separated by a space or semicolon) — liste des périodes pour lesquelles l'alerte sera envoyée (séparées par un espace ou un point-virgule).


Avis 15
tranliemkts
44
tranliemkts 2024.06.30 20:39 
 

Wow, thank you so much. Feeling very happy for your 6.80 update. Thank you for creating a great indicator

danmar
1541
danmar 2024.06.01 08:36 
 

HI I already use 2 tool of Taras (dashboard RSI and ADX ) which are really very very interesting. As i have a particular use i ask Taras if he could made in dashboard Stochastic the 2 modifications to be the same as the 2 other dashboard (param for number of decimals and possibility to have intelligent group by currencies (all USD, EUR, ... ). he say that he will mind but in fact if do it in less 2 days , even i do not notice and buy it only 2 days after he release the update !. (note the nice low price ) and i am very satisfied because it complete what i need to have a very interesting view of what happend especially with long sto and short. you already undestand that i am very happy of quality of products, accuracy, and so very good customer service. Again , Sir Taras, a big big thanks for your reactivity and interest in my needs. Very Well Done.

customanalog
154
customanalog 2023.09.29 00:23 
 

This is an _excellent_ tool. Very configurable, and worth every cent. The mouseover popup charts are a nice feature. In a perfect world, the popups might also display standard or HA candles, but the existing (2023) tool works great as-is. Thanks for your hard work to make this available.

Produits recommandés
Coral Heatmap
D Armond Lee Speers
Coral Heatmap is a currency strength meter based on the ATR values for the selected timeframe.  There are two main view modes: All Currencies (default) - see the ranked strength of all currencies in a single view Selected Currency - see the relative strength of all other currencies compared to a selected currency You can optionally display the timeframe selection toolbar; timeframe is always synchronized to the current chart timeframe.  Use keyboard shortcuts to quickly navigate currencies (up/d
Let us introduce you to a new era of neural indicators for financial markets! Intelligent Moving is a unique indicator that trains its neural network in real time! You no longer need to look for the optimal indicator parameters for each specific situation. No more late signals. The artificial intelligence is able to adapt itself and predict any market movements. Visually, the indicator is drawn as a main solid moving average line, two dotted lines of standard deviations and signal arrows. For
Supply / demand zones: observable areas where price has approached many times in the past. My   #1 Utility:  65+ features, including this indicator  |   Contact me  for any questions  |  MT5 version The indicator shows where the price could potentially be reversed again. Usually, the more times the price has been rejected from the level, the more significant it is. In the input settings   you can adjust: Enable or disbale Weak zones; Show or hide zone description; Font size; Set the basic color
Pointer View
Andrei Gerasimenko
The indicator marks the points on the chart where the standard ZigZag indicator has drawn its top or bottom. With this indicator, you can easily understand where the top or bottom was formed, and where it was redrawn. The indicator gives an alert when a new point appears. Warning! Parameter  Applied Price   -   expands the possibilities of building the indicator.   It is possible to build at OPEN, CLOSE and standard HIGH/LOW prices. Input parameters ----------- Depth   - period of the ZigZag ind
FREE
IceFX VelocityMeter Mini is a very unique indicator on MetaTrader 4 platform which measures the speed of the Forex market . It is not a normal volume or other measurement indicator because IceFX VelocityMeter Mini is capable to understand market speed movements which are hidden in ticks and those valuable information cannot be read in an ordinary way from the candles. The software monitors the received ticks (frequency, magnitude of change) within a specified time range, analyzes these info and
The Signal Strength Meter is a Multi-Currency, Dual Timeframe Interactive Indicator, which calculates the strength of buy and sell signals, and displays a score for each symbol on a display board. Get a 7-Day Free Trial Version:  Click  Here  (Full Access to The Indicator for 7 Days) Check Video Below For Complete Demonstration, and User Manual here . Key Features: Allows you to see multiple currency signals from one chart Analyses the signals from more than a dozen classic indicators Identi
Twins
Iurii Tokman
Twins   Oscillator based on the Stochastic indicator. The upper readings of the indicator can be used as buy signals, the lower readings of the indicator can be used as readings for sell signals. Settings: Kperiod - period (number of bars) for calculating the% K line. Dperiod - averaging period for calculating the% D line. slowing - slowing down. method - averaging method (simple, exponential, smoothed, linearly weighted). price - price for calculation (0 - Low / High, 1 - Open / Close). Coeffic
Position Trader EA
LEE SAMSON
4.71 (7)
Transformez n'importe quelle stratégie de trading en une stratégie de trading de positions ou négociez les stratégies de trading de positions éprouvées basées sur le RSI et l'ADR, y compris un système de contrôle automatisé des retraits pour les positions qui évoluent contre vous. Cet EA est une évolution et une simplification de l'EA MRA qui est utilisé depuis de nombreuses années pour les stratégies de trading de positions enseignées sur le site Web Market Structure Trader. Consultez mon prof
Excellent spread indicator. Reflects the spread on each bar as it is. It should be remembered that the spread is displayed at the time of the bar opening. Therefore, the most correct information will be on the minute bars. Spread is one of the basic forex concepts that any trader should know. If explained clearly, you can describe such an example. The trader buys the EUR / USD pair at the rate of 1.1000. However, he immediately goes into negative territory, for example, by 10 points, as if he bo
Fractal Pro
Mikhail Nazarenko
Fractal Pro   is a professional version of the display of fractals with additional filtering. Visualizes fractals by price and volume. Suitable for defining entry points for scalping and swing, as well as for intra-day, mid-term trading. Fractals - candles on which the price turned in the opposite direction. Volumetric fractal is an extremum not only in price, but also maximum in volume. Features Visualizes the location of price reversals. Marks candles that are fractals both in price and volum
Infinity ProfitZone
Evgenii Aksenov
4.45 (31)
L'indicateur montre Sur le graphique de la zone de profit (Profit Zone) affichant le début et la fin de la tendance locale Profit Zone PRO est parfait pour tous les symboles meta Trader: devises, métaux, crypto-monnaies, actions et indices Suivi des comptes réels:   ici   Profit Zone Expert Advisor for auto trading:   here Avantages de l'indicateur Profit Zone PRO: Signaux d'entrée sans redessiner Les algorithmes de l'indicateur vous permettent de trouver les moments idéaux pour entrer
FREE
MCTC is the most advanced multicurrency strength indicator for day trading, that does NOT use moving averages. This versatile strength meter has many settings that can be customized to suit the day traders needs. With up to 12 customization time periods, automatic calculation and graph plotting of previous period high/low values, 2 side meters showing currency strength, pair strength, points movement, points movement from previous periods, percentage, and pressure. Clickable chart for fast switc
Introducing "TG Trade Service Manager" — your all-in-one solution for seamless trade management in both MQL4 and MQL5 environments. With a focus on speed, reliability, and convenience, this powerful library simplifies the complexities of trade execution and management, empowering developers with a single interface for enhanced efficiency. Metatrader5 Version |  All Products  |  Contact Key Features: Unified Interface : TG Trade Service Manager" provides a unified interface for   MQL4   and  
This is an indicator for additional signal filtering. It can be used as an additional filter in a trading system. The indicator does not redraw its data and can be used both in forex trading and with binary options. It has 3 operation modes and flexible sensitivity settings. The indicator uses multiple buffers, therefore it can be easily used in various Expert Advisors.
Un indicateur qui affiche le modèle de chandelier engloutissant. Dans les paramètres, vous pouvez spécifier le type d'engloutissement (corps, ombre et combinaison). Il est possible de filtrer par tendance (2 moyennes mobiles) et par inversion (bandes RSI et Bollinger). Il s'agit d'un modèle d'action des prix très populaire. Un tableau de bord multidevises est disponible. Avec lui, vous pouvez facilement basculer entre les graphiques. Modèles Commerciaux: Retester par tendance. Fausse évasion.
Currency Strength Meter is the easiest way to identify strong and weak currencies. This indicator shows the relative strength of 8 major currencies + Gold: AUD, CAD, CHF, EUR, GBP, JPY, NZD, USD, XAU. Gold symbol can be changed to other symbols like XAG, XAU etc. By default the strength value is normalised to the range from 0 to 100 for RSI algorithm: The value above 60 means strong currency; The value below 40 means weak currency; This indicator needs the data of all 28 major currency pairs
Trader Evolution MT4
Siarhei Vashchylka
5 (2)
" Trader Evolution " - A utility designed for traders who use wave and technical analysis in their work. One tab of the utility is capable of money management and opening orders, and the other can help in making Elliott wave and technical analysis. Manual (Be sure to read before purchasing) | Version for MT5 Advantages 1. Trading in a few clicks. Immediate and pending orders are available in the panel 2. Money management. The program automatically selects the appropriate lot size 3. Simpli
The Compare Graphs indicator is an analysis tool that allows traders to compare two or more graphs on the same chart window. This indicator is commonly used in trading platforms such as MetaTrader and provides a clearer comparison of different financial instruments or time frames. Functions of the Compare Graphs indicator may include: Selecting Charts: The trader can select the charts he wants to compare, such as price charts of different currency pairs or indicators on the same chart. Settin
Currency Spread Calculator Plus
Opengates Success International
Currency Spread Calculator Plus This indicator is created with the aim of letting the Traders know the exact points of the spread on the currency pair they are about to buy or sell. What makes it a PLUS is that Symbol/Time frame Changer is coded with this indicator to make it easier navigating from one currency pair to another and one time frame to another on the same chart window without having to open tens of chart window in order to study more currency pairs. It saves time, energy, stress
Currency Strength Meter Pro for MT4
ALEKSANDR SHUKALOVICH
4.22 (9)
Currency Strength Meter is the easiest way to identify strong and weak currencies. This indicator shows the relative strength of 8 major currencies + Gold: AUD, CAD, CHF, EUR, GBP, JPY, NZD, USD, XAU. Gold symbol can be changed to other symbols like XAG, XAU etc. By default the strength value is normalised to the range from 0 to 100 for RSI algorithm: The value above 60 means strong currency; The value below 40 means weak currency; This indicator needs the data of all 28 major currency pairs
Flat Factor
Artem Kuzmin
5 (1)
The indicator is designed for visual determining market directions. It allows to determine the distance from a price and helps in drawing correct conclusions. Perfectly defines flat zones, horizontal intraday trends and trend movements, and an additional setting allows to use the indicator on any instrument. Does not redraw its readings. You get professional trading indicator for a reasonable price. Settings: Period_FF = 7 - indicator period Sensitivity_FF = 5 - sensitivity in % Wish you all s
Darwin Swing MT4
Guillaume Duportal
4.79 (14)
Darwin SWING Prix de lancement 999 USD , futur prix 1490 USD DESCRIPTIONS : -- Pour comprendre le fonctionnement, venez lire le blog (Cet EA reflète ma philosophie du trading forex…Si vous aimez ma façon de voir les choses, alors vous aimerez mon EA. Prenez le temps de le faire !! (Le forex n’est pas une course) : https://www.mql5.com/en/blogs/post/745790 -- Pour voir les performances passées voici les liens des signaux Live et démo signals : https://www.mql5.com/en/users/tradedea
The Multi Pairs Forex Indicator is an advanced trading too l that allows traders to track and analyze the performance of multiple currency pairs in real-time on a single chart. It consolidates data from various Forex pairs, providing an at-a-glance overview of market conditions across different currencies and helps you save time. Useful for various trading styles, including scalping, day trading, and swing trading. Whether you're monitoring major pairs like EUR/USD, GBP/USD, or more exotic pair
IntradaySignals
Oleg Borisov
5 (1)
Intraday Signals is a visual and effective semi-automatic trading system, that: generates possible entry points to open BUY and SELL trades; displays recommended  Take Profit and Stop Loss; displays current profit on open trade; displays  current spread. The profitability of the indicator is shown in the screenshot on the example of the GBPUSD pair Does not redraw and works on opening bar.  Time frames - M1-H1. Recommended TimeFrame-M5-M15. Signals are produced based on the used of HMA, Laguerre
Tick Sound
Jean Francois Le Bas
5 (2)
Tick Sound will play a different sound each time a tick is triggered. When the tick is higher than the previous one, an "UP" sound is triggered When the tick is lower than the previous one, a "DN" sound is triggered The main sound i chose is a Sheppard Tone : it's an audio effect that simulates and endless ramping sound up or down which is perfect for this task. but you can also select 14 different pre-made up/dn sounds or use your own sounds There are three main parameters for Tick Sound Ask
Volume indicator Effect Volume , in the Forex market volumes are unique (tick). This volume indicator demonstrates the level of financial and emotional involvement. When the indicator forms a new top, it indicates that buyers are stronger than sellers over a certain period of time. If the indicator decreases, this indicates that the bears are stronger. Why is it impossible to track normal volumes in Forex? The fact is that this is an over-the-counter market. Consequently, it is practically im
The trading panel is designed to close trading positions on the current instrument. The panel shows the account situation for the instrument it is attached to. The panel displays the following information: Balance - account balance; Equity - account equity; Margin - used margin; Free margin - free margin; Total Position - the summary position on the account for the current instrument, in lots; Position buy - the summary position of the buy direction for the current instrument, in lots; Position
A "Volume Profile" is an advanced charting indicator that displays total volume traded at every price level over a user specified time period. The main components of the volume profile are POC ( Point Of Control - the price level, at which the maximum number of contracts were executed during a selected period), VAH ( Value Area High - the highest price in the Value Area) and VAL ( Value Area Low - the lowest price in the Value Area). When we settled on the original indicator, we spent a lot o
This indicator alerts you when/before new candle bar formed. In other words,this indicator alerts you every 1/5/30/60/240 minutes. This indicator is especially useful for traders who trade when new bars formed. *This indicator don't work propery in strategy tester.Use Free Version to check functionality in live trading. Input Parameters Alert_Or_Sound =Sound ----- Choose alert or sound or both to notify you when new bar is coming. Enable_1mBarAlert ----- Enable alert for 1 min bar dif
Matrixs
Andriy Sydoruk
Matrix is a Forex arrow indicator. Displays signals simply and clearly! The arrows show the direction of the transaction, and are colored accordingly, which can be seen in the screenshots. As you can see, trading with such an indicator is easy. I waited for an arrow to appear in the desired direction - I opened a deal. An arrow formed in the opposite direction - closed the deal. The indicator also displays the lines with the help of which the arrow signals are formed, taking into account the int
Les acheteurs de ce produit ont également acheté
Gann Made Easy
Oleg Rodin
4.83 (92)
Gann Made Easy est un système de trading Forex professionnel et facile à utiliser qui est basé sur les meilleurs principes de trading en utilisant la théorie de mr. WD Gann. L'indicateur fournit des signaux d'ACHAT et de VENTE précis, y compris les niveaux Stop Loss et Take Profit. Vous pouvez échanger même en déplacement en utilisant les notifications PUSH. S'il vous plaît contactez-moi après l'achat! Je partagerai avec vous mes astuces de trading et d'excellents indicateurs bonus gratuitement!
Bull versus Bear
Mohamed Hassan
4.8 (5)
Official Release price of $65 for the first 27 /3 0  copies (3 copies left). Next price is $120 !  Send us a message after your purchase to receive more information on how to get your  BONUS  for FREE  that works in great combination with Bull vs Bear ! Bull versus Bear is an easy-to-use Forex indicator that gives traders clear and accurate signals based on clear trend retests . Forget about lagging indicators or staring at charts for hours because  Bull vs Bear provides real-time entries w
- Real price is 80$ - 40% Discount ( It is 49$ now ) Contact me for instruction, add group and any questions! Related Products:  Bitcoin Expert , Gold Expert Introduction The breakout and retest strategy is traded support and resistance levels. it involves price breaking through a previous level.  The break and retest strategy is designed to help traders do two main things, the first is to avoid false breakouts. Many false breakouts start with a candlestick that breaks out of a level but ends w
FX Volume
Daniel Stein
4.58 (33)
Obtenez votre mise à jour quotidienne du marché avec des détails et des captures d'écran via notre Morning Briefing ici sur mql5 et sur Telegram ! FX Volume est le PREMIER et SEUL indicateur de volume qui fournit un VRAI aperçu du sentiment du marché du point de vue d'un courtier. Il fournit des informations impressionnantes sur la façon dont les acteurs institutionnels du marché, comme les courtiers, sont positionnés sur le marché des changes, bien plus rapidement que les rapports COT. Voir c
Atomic Analyst
Issam Kassas
5 (2)
Tout d'abord, il convient de souligner que cet indicateur de trading n'est ni repainting, ni redrawing et ne présente aucun délai, ce qui le rend idéal à la fois pour le trading manuel et automatisé. Manuel de l'utilisateur : réglages, entrées et stratégie. L'Analyste Atomique est un indicateur d'action sur les prix PA qui utilise la force et le momentum du prix pour trouver un meilleur avantage sur le marché. Équipé de filtres avancés qui aident à éliminer les bruits et les faux signaux, et à
Gold Stuff
Vasiliy Strukov
4.89 (241)
Gold Stuff est un indicateur de tendance conçu spécifiquement pour l'or et peut également être utilisé sur n'importe quel instrument financier. L'indicateur ne se redessine pas et ne traîne pas. Délai recommandé H1. Au niveau de l'indicateur de travail, l'Expert Advisor EA Gold Stuff est entièrement automatique. Vous pouvez le trouver sur mon profil. Vous pouvez obtenir une copie gratuite de notre indicateur Strong Support et Trend Scanner, veuillez envoyer un message privé. moi! Contactez
Scalper Inside PRO
Alexey Minkov
4.73 (56)
An exclusive indicator that utilizes an innovative algorithm to swiftly and accurately determine the market trend. The indicator automatically calculates opening, closing, and profit levels, providing detailed trading statistics. With these features, you can choose the most appropriate trading instrument for the current market conditions. Additionally, you can easily integrate your own arrow indicators into Scalper Inside Pro to quickly evaluate their statistics and profitability. Scalper Inside
FX Power MT4 NG
Daniel Stein
5 (13)
Obtenez votre mise à jour quotidienne du marché avec des détails et des captures d'écran via notre Morning Briefing ici sur mql5 et sur Telegram ! FX Power MT4 NG est la nouvelle génération de notre très populaire indicateur de force des devises, FX Power. Et qu'est-ce que ce compteur de force de nouvelle génération offre ? Tout ce que vous avez aimé de l'original FX Power PLUS Analyse de la force de l'OR/XAU Des résultats de calcul encore plus précis Périodes d'analyse configurables individuel
FX Levels est un indicateur de support et de résistance exceptionnellement précis qui fusionne la méthode traditionnelle Lighthouse avec une approche dynamique innovante, fonctionnant parfaitement sur tous les symboles de trading. Cela inclut les paires de devises, les indices, les actions ou les matières premières. FX Levels identifie les points d'inversion et les affiche sur le graphique, qui peuvent être idéalement utilisés comme cibles de profit dans vos activités de trading. Pour développe
The Stochastic Basket Currency Strenght  brings the Stochastic indicator to a new level.  Expanding the boundaries of TimeFrames and mono-currency analysis, the SBCS take the movements of each currency that composes the cross and confront them in the whole basket of 7 crosses.  The indicator works with any combination of AUD, CAD, CHF, EUR, GBP, JPY, NZD, USD pairs and with full automation takes in account every stochastic value (main line) for the selected Time Frame.  After that, the indicator
Trend Pulse
Mohamed Hassan
5 (4)
Halloween Promotion   for   24 hours only   with a   40%   discount on the original price!  $̶6̶5̶  $39 ONLY!  Please contact me after purchase to immediately get your PDF strategy + documentation for Trend Pulse !  Introducing Trend Pulse , a unique and robust indicator capable of detecting bullish, bearish, and even ranging trends! Trend Pulse uses a special algorithm to filter out market noise with real precision. If the current symbol is moving sideways, Trend Pulse will send you a
TPSproTREND PrO
Roman Podpora
4.79 (19)
TPSpro TREND PRO   est un indicateur de tendance qui analyse automatiquement le marché et fournit des informations sur la tendance et chacun de ses changements, ainsi que des signaux pour entrer dans des transactions sans redessiner ! L'indicateur utilise chaque bougie et les analyse séparément. faisant référence à différentes impulsions - impulsion ascendante ou descendante. Points d'entrée précis dans les transactions sur les devises, les crypto-monnaies, les métaux, les actions, les indices 
Stratos Pali
Michela Russo
5 (1)
Stratos Pali Indicator   is a revolutionary tool designed to enhance your trading strategy by accurately identifying market trends. This sophisticated indicator uses a unique algorithm to generate a complete histogram, which records when the trend is Long or Short. When a trend reversal occurs, an arrow appears, indicating the new direction of the trend. Important Information Revealed Leave a review and contact me via mql5 message to receive My Top 5 set files for Stratos Pali at no cost! D
Trend Screener
STE S.S.COMPANY
4.81 (88)
Indicateur de tendance, solution unique révolutionnaire pour le trading et le filtrage des tendances avec toutes les fonctionnalités de tendance importantes intégrées dans un seul outil ! Il s'agit d'un indicateur multi-période et multi-devises 100 % non repeint qui peut être utilisé sur tous les symboles/instruments : forex, matières premières, crypto-monnaies, indices et actions. OFFRE À DURÉE LIMITÉE : L'indicateur Support and Resistance Screener est disponible pour seulement 50 $ et à vie. (
Reversal-Arrow : Identification Précise et Fiable des Points de Renversement Reversal-Arrow est un indicateur avancé conçu pour aider les traders à identifier des points de renversement potentiels de tendance. Il fournit des signaux visuels clairs, simplifiant le processus de prise de décision et réduisant l’incertitude dans l'analyse du marché. Il est particulièrement optimisé pour les paires XAUUSD et XAUEUR en périodes de 1 minute, 5 minutes et 15 minutes, où il affiche sa meilleure performan
TPSpro RFI Levels
Roman Podpora
4.82 (22)
INSTRUCTIONS       RUS   -   ANGLAIS       Il   est recommandé de l'utiliser avec un indicateur       -       TPSpro   TENDANCE PRO -   Version MT4         Un élément clé du trading est constitué par les zones ou les niveaux à partir desquels les décisions d'achat ou de vente d'un instrument de trading sont prises. Malgré les tentatives des principaux acteurs de dissimuler leur présence sur le marché, ils laissent inévitablement des traces. Notre tâche était d'apprendre à identifier ces traces
Dynamic Forex28 Navigator
Bernhard Schweigert
5 (2)
Dynamic Forex28 Navigator - L'outil de trading Forex de nouvelle génération. ACTUELLEMENT 49 % DE RÉDUCTION. Dynamic Forex28 Navigator est l'évolution de nos indicateurs populaires de longue date, combinant la puissance de trois en un : Advanced Currency Strength28 Indicator (695 avis) + Advanced Currency IMPULSE avec ALERT (520 avis) + CS28 Combo Signals (Bonus). Détails sur l'indicateur https://www.mql5.com/en/blogs/post/758844 Qu'offre l'indicateur de force de nouvelle génération ? T
Ce tableau de bord affiche les derniers modèles harmoniques disponibles pour les symboles sélectionnés, ce qui vous permettra de gagner du temps et d'être plus efficace / version MT5 . Indicateur gratuit: Basic Harmonic Pattern Colonnes de l'indicateur Symbol : les symboles sélectionnés apparaissent Trend : haussière ou baissière Pattern : type de motif (gartley, papillon, chauve-souris, crabe, requin, cypher ou ABCD) Entry: prix d'entrée SL: prix du stop loss TP1: 1er prix de prise de pr
Scalper Vault
Oleg Rodin
5 (27)
Scalper Vault est un système de scalpage professionnel qui vous fournit tout ce dont vous avez besoin pour un scalpage réussi. Cet indicateur est un système de trading complet qui peut être utilisé par les traders de forex et d'options binaires. Le délai recommandé est M5. Le système vous fournit des signaux fléchés précis dans le sens de la tendance. Il vous fournit également des signaux supérieurs et inférieurs et des niveaux de marché Gann. Les indicateurs fournissent tous les types d'alertes
Gold Channel is a volatility-based indicator, developed with a specific timing algorithm for the XAUUSD pair, which consists of finding possible corrections in the market. This indicator shows two outer lines, an inner line (retracement line) and an arrow sign, where the theory of the channel is to help identify overbought and oversold conditions in the market. The market price will generally fall between the boundaries of the channel. If prices touch or move outside the channel it is a tra
Actuellement 20% de réduction ! La meilleure solution pour tout débutant ou trader expert ! Ce logiciel de tableau de bord fonctionne sur 28 paires de devises. Il est basé sur 2 de nos principaux indicateurs (Advanced Currency Strength 28 et Advanced Currency Impulse). Il donne un excellent aperçu de l'ensemble du marché Forex. Il montre les valeurs de l'Advanced Currency Strength, la vitesse de mouvement des devises et les signaux pour 28 paires de devises dans tous les (9) délais. Imagine
Currency Strength Wizard est un indicateur très puissant qui vous offre une solution tout-en-un pour un trading réussi. L'indicateur calcule la puissance de telle ou telle paire de devises en utilisant les données de toutes les devises sur plusieurs périodes. Ces données sont représentées sous la forme d'un indice de devise facile à utiliser et de lignes électriques de devise que vous pouvez utiliser pour voir la puissance de telle ou telle devise. Tout ce dont vous avez besoin est d'attacher l'
Tout d'abord, il convient de souligner que cet outil de trading est un indicateur non repeint, non redessiné et non retardé, ce qui le rend idéal pour le trading professionnel. Cours en ligne, manuel utilisateur et démonstration. L'indicateur Smart Price Action Concepts est un outil très puissant à la fois pour les nouveaux et les traders expérimentés. Il regroupe plus de 20 indicateurs utiles en un seul, combinant des idées de trading avancées telles que l'analyse du trader Inner Circle et les
ACTUELLEMENT 26% DE RÉDUCTION La meilleure solution pour tout débutant ou trader expert ! Cet indicateur est un outil de trading unique, de haute qualité et abordable car nous avons incorporé un certain nombre de caractéristiques exclusives et une nouvelle formule. Avec seulement UN graphique, vous pouvez lire la force de la devise pour 28 paires Forex ! Imaginez comment votre trading va s'améliorer parce que vous êtes capable de repérer le point de déclenchement exact d'une nouvelle tendan
Ultimate Gold Advisor pour MetaTrader 4 L'Ultimate Gold Advisor est un outil technologique avancé conçu pour optimiser l'expérience de trading sur MetaTrader 4. Créé pour répondre aux besoins des traders expérimentés, cet indicateur combine précision, analyse sophistiquée et fonctionnalité polyvalente, offrant un soutien pour des décisions de trading éclairées. Idéal pour le trading de l'or, mais applicable à une large gamme d'actifs, l'Ultimate Gold Advisor peut vous aider à améliorer vos stra
Gann Swing Structure
Kirill Borovskii
5 (1)
This indicator is based on the mathematics of the great trader W.D. Ganna. With its help, you can easily find strong levels by analyzing swings to find the optimal entry point. The indicator works on all instruments and all timeframes. The indicator is fully manual and has control buttons. All you need to do is press the NEW button, a segment will appear, which you can place on any movement, swing or even 1 candle that you want to analyze. By placing the segment, press the OK button. A grid (th
Nous vous présentons ON Trade Waves Patterns Harmonic Elliot Wolfe, un indicateur avancé conçu pour détecter divers types de schémas sur le marché à l'aide de méthodes manuelles et automatiques. Voici comment il fonctionne : Schémas Harmoniques : Cet indicateur peut identifier les schémas harmoniques qui apparaissent sur votre graphique. Ces schémas sont essentiels pour les traders qui pratiquent la théorie du trading harmonique, telle qu'elle est décrite dans le livre de Scott Carney "Harmonic
Market Structure Patterns MT4
Samuel Manoel De Souza
5 (16)
Market Structure Patterns   is an indicator based on   smart money concepts   that displays   SMC/ICT   elements that can take your trading decisions to the next level. Take advantage of the   alerts ,   push notifications   and   email messages   to keep informed from when an element is formed on the chart, the price crosses a level and/or enters in a box/zone. Developers can access the values of the elements of the indicator using the   global variables  what allows the automation of trading
IX Power MT4
Daniel Stein
4.67 (6)
IX Power apporte enfin la précision imbattable de FX Power aux symboles non-Forex. Il détermine avec précision l'intensité des tendances à court, moyen et long terme de vos indices, actions, matières premières, ETF et même crypto-monnaies préférés. Vous pouvez analyser tout ce que votre terminal a à offrir. Essayez-le et découvrez comment votre timing s'améliore considérablement lors de vos transactions. Caractéristiques principales d'IX Power Résultats de calcul précis à 100 %, sans ré
Advanced Supply Demand
Bernhard Schweigert
4.91 (295)
CURRENTLY 26% OFF !! Best Solution for any Newbie or Expert Trader! This indicator is a unique, high quality and affordable trading tool because we have incorporated a number of proprietary features and a new formula. With this update, you will be able to show double timeframe zones. You will not only be able to show a higher TF but to show both, the chart TF, PLUS the higher TF: SHOWING NESTED ZONES. All Supply Demand traders will love it. :) Important Information Revealed Maximize the potenti
Plus de l'auteur
ZigZag Lines MTF for MT5
Taras Slobodyanik
5 (10)
Multi timeframe ZigZag indicator. It displays the support/resistance horizontal lines and their breakouts, as well as draws the current targets of the market. It can also display lines of the Fractals indicator and candles from other periods (up to Quarterly). So, you can actually see the supply and demand levels. You can also use it as indicator for the Break of Structure(BOS) & Market Structure Shift(MSS). The indicator redraws the last (current) point, and in some cases can change the last 2
Time Scale for MT5
Taras Slobodyanik
4.64 (22)
The indicator draws the time scale on the chart. You can specify the time offset, adjust the size and font to display on the chart ( it is displaying your local time on your chart instead of MT time ). You can also select the desired format for displaying the date and time. You may be interested in my other product , which contains a more advanced version of the Time Scale . Parameters Hours (time shift) — time shift (hours); Minutes (time shift) — time shift (minutes); Show time on mouse — sh
FREE
Symbol Manager for MT5
Taras Slobodyanik
5 (1)
Symbol Manager or Grid Manager, designed to group orders into one position (by symbol and by direction). This utility will be useful to multi-currency traders, who can have multiple orders on several pairs. You will be able to see the total number of lots, the total profit, and set virtual stop loss and virtual take profit. To set a real TP (or SL), you must first set the virtual value, and then enter the command in this cell: "set". If you want to set real TP/SL for all orders at once, then en
Heikin Ashi Dashboard
Taras Slobodyanik
5 (4)
Multi-currency and multitimeframe Heikin Ashi indicator. Shows the current state of the market. On the scanner panel you can see the direction, strength and number of bars of the current trend. The Consolidation/Reversal candles are also shown using color. You can specify any desired currencies and periods in the parameters. Also, the indicator can send notifications when the trend changes or when reversal and consolidation candles (dojis) appear. By clicking on a cell, this symbol and period wi
ZigZag Dashboard for MT4
Taras Slobodyanik
4.75 (4)
Multicurrency and multitimeframe modification of the ZigZag indicator. Displays the current direction of the market, the height of the last movement, the number of bars in this movement and the breaking of the previous point of the ZigZag (horizontal line). This is MTF Scanner, you can actually see the supply and demand levels. You can specify any desired currencies and timeframes in the parameters. Also, the panel can send notifications when the ZigZag changes direction or when there was a b
Multicurrency and multitimeframe modification of the indicator Bollinger Bands. On the dashboard you can see breakouts and touches of the Bollinger Bands. In the parameters you can specify any desired currencies and timeframes. The indicator can also send notifications when the price touches the Bollinger Bands, when the current volatility changes (expands or falls), and when the price touches all the bands. By clicking on a cell with a period, this symbol and period will be opened. This is MTF
MA Dashboard MT5
Taras Slobodyanik
5 (4)
Modification multidevises et multitemporelles de l'indicateur Moving Average (MA). Sur le tableau de bord, vous pouvez voir l'état actuel de l'indicateur - les cassures et les touches (par prix) du Fast MA et du Slow MA, ainsi que l'intersection des lignes MA entre elles (croisement de moyenne mobile). Dans les paramètres, vous pouvez spécifier les devises et les délais souhaités. En outre, l'indicateur peut envoyer des notifications sur le prix touchant les lignes et sur leur franchissement. E
Modification multidevises et multitemporelles de l’indicateur Relative Strength Index (RSI). Vous pouvez spécifier les devises et les délais souhaités dans les paramètres. En outre, le panneau peut envoyer des notifications lors du franchissement des niveaux de surachat et de survente. En cliquant sur une cellule avec un point, ce symbole et ce point seront ouverts. Il s'agit du scanner MTF. La clé pour masquer le tableau de bord du graphique est "D" par défaut. Semblable au Currency Streng
Inside Bar Dashboard
Taras Slobodyanik
5 (2)
Multicurrency and multi-timeframe indicator Inside Bar (IB). In the parameters, you can specify any desired currencies and timeframes. The panel displays the last found Inside Bar (and Mother Bar) pattern, the current price position and the breakout of the levels of the Mother and Inside Bars. You can set the size and color for bars and text in the cells. The indicator can also send notifications when levels are broken. By clicking on a cell with a period, the specified symbol and period will b
Multi-currency and multitimeframe Heikin Ashi indicator. Shows the current state of the market. On the scanner panel you can see the direction, strength and number of bars of the current trend. The Consolidation/Reversal candles are also shown using color. You can specify any desired currencies and periods in the parameters. Also, the indicator can send notifications when the trend changes or when reversal and consolidation candles (dojis) appear. By clicking on a cell, this symbol and period wi
ADX Dashboard MT5
Taras Slobodyanik
5 (4)
L'indicateur ADX est utilisé pour déterminer la tendance et sa force. La direction du prix est indiquée par les valeurs +DI et -DI, ​​et la valeur ADX montre la force de la tendance. Si +DI est supérieur à -DI, ​​alors le marché est dans une tendance haussière, si au contraire, c'est une tendance baissière. Si l’ADX est inférieur à 20, il n’y a pas de direction définie. Dès que l'indicateur dépasse ce niveau, une tendance de force moyenne commence. Les valeurs supérieures à 40 indiquent une ten
Angle Dashboard
Taras Slobodyanik
5 (1)
This is a multicurrency and multitimeframe indicator that calculates the angle between two points. Points for measuring the angle can be taken from the ZigZag (the last two points), or from the Moving Average (between two given bars), or it can be the closing prices of bars. Angle measurement is possible in degrees or in radians. You can select the scale for the calculation. For a better understanding of the indicator, you can study the free Angle High Low indicator. In the parameters you can
Modification multidevises et multitemporelles de l'oscillateur stochastique. Vous pouvez spécifier les devises et les délais souhaités dans les paramètres. Le panneau affiche les valeurs actuelles et les intersections des lignes — Signal et Principal (croisement stochastique). En outre, l'indicateur peut envoyer des notifications lors du franchissement des niveaux de surachat et de survente. En cliquant sur une cellule avec un point, ce symbole et ce point seront ouverts. Il s'agit du scanner M
ZigZag Lines MTF
Taras Slobodyanik
4.38 (13)
Multi timeframe ZigZag indicator. It displays the support/resistance horizontal lines and their breakouts, as well as draws the current targets of the market. It can also display lines of the Fractals indicator and candles from other periods (up to Quarterly). So, you can actually see the supply and demand levels. You can also use it as indicator for the Break of Structure(BOS) & Market Structure Shift(MSS). The indicator redraws the last (current) point, and in some cases can change the last 2
CCI Dashboard for MT5
Taras Slobodyanik
5 (1)
Multicurrency and multitimeframe modification of the Commodity Channel Index (CCI) indicator. You can specify any desired currencies and timeframes in the parameters. Also, the panel can send notifications when crossing overbought and oversold levels. By clicking on a cell with a period, this symbol and period will be opened. This is MTF Scanner. The key to hide the dashboard from the chart is "D" by default. Parameters CCI Period  — averaging period. CCI Applied price  — price type. Clea
Fractals Dashboard MT5
Taras Slobodyanik
5 (3)
Multicurrency and multitimeframe modification of the Fractals indicator. Displays the last two fractals — their sequence (and which one is broken), or the distance between them. You can specify any desired currencies and timeframes in the parameters. Also, the panel can send notifications on a fractal's breakout. By clicking on a cell with a period, this symbol and period will be opened. This is MTF Scanner. The key to hide the dashboard from the chart is "D" by default. Parameters Calculatio
Lines Profit Loss MT5
Taras Slobodyanik
4.58 (12)
L'indicateur affiche le profit (la perte) sur le symbole actuel. Vous pouvez librement faire glisser et déposer la ligne pour afficher le profit ou la perte actuel. Paramètres Calculation in money or in points — calculez le profit/la perte en points ou en argent. Add pending orders to calculate — prenez en compte les commandes en attente dans les calculs. Magic Number (0 - all orders on symbol) — nombre magique, s'il est nécessaire d'évaluer des commandes spécifiques. Offset for first dra
FREE
Modification multidevises et multitemporelles de l’indicateur Relative Strength Index (RSI). Vous pouvez spécifier les devises et les délais souhaités dans les paramètres. En outre, le panneau peut envoyer des notifications lors du franchissement des niveaux de surachat et de survente. En cliquant sur une cellule avec un point, ce symbole et ce point seront ouverts. Il s'agit du scanner MTF. La clé pour masquer le tableau de bord du graphique est "D" par défaut. Semblable au Currency Streng
ADX Dashboard
Taras Slobodyanik
5 (3)
L'indicateur ADX est utilisé pour déterminer la tendance et sa force. La direction du prix est indiquée par les valeurs +DI et -DI, ​​et la valeur ADX montre la force de la tendance. Si +DI est supérieur à -DI, ​​alors le marché est dans une tendance haussière, si au contraire, c'est une tendance baissière. Si l’ADX est inférieur à 20, il n’y a pas de direction définie. Dès que l'indicateur dépasse ce niveau, une tendance de force moyenne commence. Les valeurs supérieures à 40 indiquent une ten
Pro Sessions MT4
Taras Slobodyanik
4.67 (3)
This is an indicator of trading sessions  that can display all levels (Open-High-Low-Close) for four sessions. The indicator can also predict session levels. Sessions can be drawn with lines or rectangles (empty or filled), lines can be extended to the next session. You can easily hide/show each session by pressing hotkeys (by default '1', '2', '3', '4'). You can see ASR (Average Session Range) lines  (default hotkey 'A'). This is similar to the ADR calculation, only it is calculated based on t
MACD Dashboard
Taras Slobodyanik
Multi-currency and multi-timeframe indicator MACD. The dashboard can display both the Traditional (true) MACD and the MACD which is built into MetaTrader. On the panel you can see the current state of the indicator — the direction of movement of the MACD lines, their intersection and a pop-up window with the indicator chart. In the parameters you can specify any desired pairs-symbols and timeframes. The scanner can also send notifications about lines crossing each other and about lines crossing
News Dashboard MT4
Taras Slobodyanik
4.43 (7)
This dashboard displaying current news from ForexFactory.com (calendar FFC) and from the Investing.com website . You can sort news by impact and by country, and display them on the chart with one click. By holding down the 'Ctrl' key, you can select several different 'currencies' or 'impacts' to sort. Also, this utility shows not only the forecast, but also the actual values ​​after they appear on the site. You can set a separate notification for each news. You can read the news using your EA
Multicurrency and multitimeframe indicator of the Standard Deviation Channel. Displays the current direction of the market. On the panel, you can see breakouts and touches (by price) of the levels of the linear regression channel. In the parameters, you can specify any desired currencies and timeframes. Also, the indicator can send notifications when levels are touched. By clicking on a cell, this symbol and period will be opened. This is MTF Scanner. The key to hide the dashboard from the char
Lines Profit Loss
Taras Slobodyanik
4.93 (14)
L'indicateur affiche le profit (la perte) sur le symbole actuel. Vous pouvez librement faire glisser et déposer la ligne pour afficher le profit ou la perte actuel. Paramètres Calculation in money or in points — calculez le profit/la perte en points ou en argent. Add pending orders to calculate — prenez en compte les commandes en attente dans les calculs. Magic Number (0 - all orders on symbol) — nombre magique, s'il est nécessaire d'évaluer des commandes spécifiques. Offset for first dra
FREE
Time Scale
Taras Slobodyanik
4.8 (10)
The indicator draws the time scale on the chart. You can specify the time offset, adjust the size and font to display on the chart (it is displaying your local time on your chart instead of MT time). You can also select the desired format for displaying the date and time. While holding down the middle mouse button, and moving the cursor, a slider will appear on the scale. You may be interested in my other product , which contains a more advanced version of the Time Scale. Parameters Hours (tim
FREE
The indicator has three main tools: Magnifier (Zoom chart), Ruler  ( Time and Price scales ),   and Crosshair. You can move it all around with your mouse and customize different formats for  displaying , customize   size and color of each element. The Magnifier (zoom chart) allows you to display candles from any time frame and at different scales. Hotkeys: 'Q' - higher timeframe, 'A' - lower timeframe, 'W' - decrease candle size, 'S' - increase candle size, 'Z' - show/hide zoom chart. You c
Multicurrency and multitimeframe modification of the indicator Bollinger Bands. On the dashboard you can see breakouts and touches of the Bollinger Bands. In the parameters you can specify any desired currencies and timeframes. The indicator can also send notifications when the price touches the Bollinger Bands, when the current volatility changes (expands or falls), and when the price touches all the bands. By clicking on a cell with a period, this symbol and period will be opened. This is MTF
Fractals Dashboard MT4
Taras Slobodyanik
5 (3)
Multicurrency and multitimeframe modification of the Fractals indicator. Displays the last two fractals — their sequence (and which one is broken), or the distance between them. You can specify any desired currencies and timeframes in the parameters. Also, the panel can send notifications on a fractal's breakout. By clicking on a cell with a period, this symbol and period will be opened. This is MTF Scanner. The key to hide the dashboard from the chart is "D" by default. Parameters Calculati
The indicator has three main tools: Magnifier (Zoom chart), Ruler  ( Time and Price scales ),   and Crosshair. You can move it all around with your mouse and customize different formats for  displaying , customize   size and color of each element. The Magnifier (zoom chart) allows you to display candles from any time frame and at different scales. Hotkeys: 'Q' - higher timeframe, 'A' - lower timeframe, 'W' - decrease candle size, 'S' - increase candle size, 'Z' - show/hide zoom chart. You c
Filtrer:
tranliemkts
44
tranliemkts 2024.06.30 20:39 
 

Wow, thank you so much. Feeling very happy for your 6.80 update. Thank you for creating a great indicator

danmar
1541
danmar 2024.06.01 08:36 
 

HI I already use 2 tool of Taras (dashboard RSI and ADX ) which are really very very interesting. As i have a particular use i ask Taras if he could made in dashboard Stochastic the 2 modifications to be the same as the 2 other dashboard (param for number of decimals and possibility to have intelligent group by currencies (all USD, EUR, ... ). he say that he will mind but in fact if do it in less 2 days , even i do not notice and buy it only 2 days after he release the update !. (note the nice low price ) and i am very satisfied because it complete what i need to have a very interesting view of what happend especially with long sto and short. you already undestand that i am very happy of quality of products, accuracy, and so very good customer service. Again , Sir Taras, a big big thanks for your reactivity and interest in my needs. Very Well Done.

customanalog
154
customanalog 2023.09.29 00:23 
 

This is an _excellent_ tool. Very configurable, and worth every cent. The mouseover popup charts are a nice feature. In a perfect world, the popups might also display standard or HA candles, but the existing (2023) tool works great as-is. Thanks for your hard work to make this available.

Sara Sabaghi
21316
Sara Sabaghi 2023.02.11 11:10 
 

Great job. you did it well. to support and respect for nice and inspiring tools in this market

18104
344
18104 2022.08.26 16:54 
 

Very good indicator !!!

aworex
1807
aworex 2021.12.14 16:54 
 

A very good product and a must have for serious traders. By the way is the new Average column displaying the average Stochastic value of TF's ?

Taras Slobodyanik
70714
Réponse du développeur Taras Slobodyanik 2023.06.01 16:53
The indicator can calculate two different averages. The first "simple average" is a simple sum divided by the number of timeframes. The second "weighted by timeframes" is the sum of values multiplied by the number of minutes of each timeframe, divided by the total amount of minutes.
intan08
1386
intan08 2021.10.29 18:50 
 

Essential tool for my trading, great job by the author.

Nicolas Dobrovsky
804
Nicolas Dobrovsky 2021.08.26 10:02 
 

The best stochastic dashboard I've found. Lots of settings. Everyone will find what they need. The creator answers and solves problems very quickly.

GoodMorningg
529
GoodMorningg 2021.04.16 08:51 
 

Идеальный индикатор! Прям нет к чему придраться. Спасибо Тарас за ваш труд!

1218384201
144
1218384201 2020.11.10 19:19 
 

The dashboard do the right work for my trading!Very good

sunnychow
8932
sunnychow 2020.05.01 10:33 
 

L'utilisateur n'a laissé aucun commentaire sur la note

thapas
937
thapas 2019.11.07 15:34 
 

great product!!!

DTChrisLP
1104
DTChrisLP 2019.10.28 11:17 
 

Great Dashboard.... Thx!

aw1977
279
aw1977 2019.09.06 00:04 
 

This dashboard works well as confirmation for my method....thank you

vghanem
244
vghanem 2019.01.28 06:16 
 

Great product. Great value for money. It helps me in momentum swing trading when stochastics exits OS/OB areas. Good job Taras! And thank you for this brilliant work!

Répondre à l'avis
Version 6.80 2024.06.30
1) Added coloring parameter: "Coloring according to Intersection of the Lines".
Version 6.70 2024.05.29
1) Fixed bugs in history calculation for "Stochastic for One Currency".
Version 6.60 2024.05.28
1) Added parameters "Stochastic for One Currency" and "Reverse Stochastic value". The dashboard will automatically select (from the list) pairs containing the specified Currency or those pairs that have this Currency as the base. The indicator will also calculate the Stochastic for this Currency on a separate row.
2) Added parameter "Decimal places for Stochastic values".
Version 6.50 2024.03.14
1) Changed the behavior of setting the timer at startup. Now the indicator tries to start the timer again when a new tick arrives. If there is no tick for a long time (or it’s a weekend), you can click on the button on the chart and restart the timer yourself.
Version 6.40 2023.11.10
1) Added automatic shifting of the dashboard to the foreground.
Version 6.30 2023.11.02
1) Added reset of all Marks and Alerts from the Symbols column (click on the cell with the indicator name).
Version 6.20 2023.10.26
1) Added the ability to manually mark a cell with a symbol. While holding down the Ctrl key, you need to click on the cell with the symbol.
Version 6.10 2023.10.18
1) Now the "Enable text tooltip in the table" parameter disables all tooltips.
Version 6.0 2023.10.15
1) The "Y-offset (pix, +/-)" parameter can now be negative.
2) Changed the behavior of the pop-up chart when the window is small.
Version 5.90 2023.09.08
1) Fixed a cell coloring bug when specifying None color in the "Cell Color when crossing Lines" parameters.
Version 5.80 2023.09.02
1) For "Popup chart" added parameter "Hotkey to enable/disable the Popup chart".
2) For "Popup chart" added parameter "Y-offset (pix)".
Version 5.70 2023.08.28
1) Added a Dashboard recovery check when running multiple copies on the same chart.
Version 5.60 2023.08.25
1) Returned the deletion of the dashboard from the chart at startup.
Version 5.40 2023.07.29
1) Added a hotkey to hide the dashboard, by default "D".
Version 5.30 2023.07.20
1) Added "Popup chart" parameters. Now, when you hover the mouse over the cells, you can see a pop-up chart from this timeframe.
2) Fixed some minor bugs.
Version 5.20 2023.06.03
1) Added the ability to enable/disable alerts for each Symbol when clicking on the name of the Pair. If no Pair is selected then alerts are enabled for all Symbols.
Version 5.10 2023.06.01
1) Added "Coloring Text according to" parameter.
2) Added tooltips.
3) Changed the color scheme.
4) Added "Color scheme" parameter.
Version 5.0 2023.03.22
1) Added an option to alert when crossing lines "in no zone (neither OB nor OS)".
Version 4.90 2023.01.22
1) Added sorting of rows by the column of Average values.
Version 4.80 2022.11.26
1) Alert "All timeframes" is splitted into two parameters - for Overbought and four Oversold.
Version 4.70 2022.10.04
1) Changed "Show Average column" parameter. Added options: "simple average" and "weighted by timeframes".
Version 4.60 2022.09.08
1) Added parameters to change table colors.
Version 4.50 2022.06.21
1) Added parameter to display stochastic parameters in alert message: "Add Stochastic parameters to alerts".
Version 4.40 2022.06.07
1) Added separate parameters for each alert when entering and exiting the Overbought/Oversold zones.
Version 4.30 2022.06.06
1) Added parameters for sounds when entering and exiting the Overbought/Oversold zones.
Version 4.20 2022.06.03
1) Added "Refresh cells only on new bar" parameter.
2) Added tooltips.
Version 4.10 2022.04.12
1) Changed the alert parameter when the stochastic lines cross. Now you can select an alert zone where the lines crossed.
Version 4.0 2022.04.09
1) The condition of the list of pairs for the second parameter has been changed. Pairs in the second parameter must be typed only with a semicolon and must be in exact case. "Pairs (separated ONLY by a semicolon and have exact letter case)"
Version 3.90 2022.04.09
1) Cell selection is disabled if there is one pair and one timeframe in the table.
Version 3.80 2022.03.26
1) Added a parameter to highlight the current Pair and TF. (Highlight the current Pair and TF).
Version 3.70 2021.11.24
1) Added a column for the average ('Show Average column').
2) Added a parameter for the color of the average column ('Color Average').
Version 3.60 2021.08.24
1) Fixed a bug when launching many indicators with the "Current pair" parameter.
Version 3.50 2021.04.13
1) Added parameter "Allow to move the table manually".
Version 3.40 2021.04.13
1) Fixed cleaning of coordinates when removing the indicator from the chart.
Version 3.30 2021.04.09
1) Added parameter "Color ink (none=default)".
2) Now, after double-clicking on the table headers, you can move it with the mouse. The binding to the corner of the chart remained unchanged.
Version 3.20 2021.03.20
1) Added options to disable the table headers.
Version 3.10 2021.02.01
1) The alert parameter when crossing lines is separated into two parts: alert when crossing up and alert when crossing down.
Version 2.90 2020.12.10
1) Fixed a bug when launching many copies with the same parameters.
Version 2.80 2020.12.09
1) For the parameter "Set of Pairs" added the option "Current pair".
2) Removed the binding of the dashboard to the chart ID.
Version 2.70 2020.09.09
1) Added third level check - Medium level (only alert).
2) Added a choice of sounds for each type of sound alert.
Version 2.60 2020.06.10
1) Recompilation for the new build.
Version 2.50 2020.03.12
1) The condition determining the intersection of lines in the zone is fixed.
Version 2.40 2020.03.11
1) Separate settings for alerts so that you can disable each separately.
Version 2.30 2019.11.06
1) Changed the alert algorithm when the indicator starts.
Version 2.20 2019.10.29
1) The message in the alert has been changed (when crossing the indicator lines).
Version 2.10 2019.10.26
1) Added periods for alerts - "Timeframes for alerts".
2) Added parameter for clearing the chart at startup - "Clear the chart at startup".
3) Added center alignment of the panel - "Centered".
4) Added offsets for the panel - "X offset (pix)" and "Y offset (pix)".
5) Reverse the order of pairs of "Market Watch" without sorting.
Version 2.0 2019.10.14
1) Added parameter: "Check the Lines crossing only in OB/OS zones".
Version 1.90 2019.10.11
1) Added the crossing of the Main line and the Signal line (display in the table and alert).
Version 1.80 2019.01.28
1) Added an alert to exit the overbought / oversold zone.
Version 1.70 2018.11.26
1) Code optimization.
Version 1.60 2018.11.22
1) Added modes for alerts.
Version 1.50 2018.10.15
The color scheme has been fixed, now a white scheme is used for background colors other than black.
Version 1.40 2018.07.09
1) Added the "Set of Pairs" parameter to select the symbols of the Market Watch.
2) Added parameter "Chart template". When open the chart, the specified template will be applied.
3) Code optimization.
Version 1.30 2018.03.23
1) Added one more option for the list of pairs - "Pairs". One line can contain up to 256 characters.
2) Now the names of pairs can be set in both upper and lower case. If the name contains both cases, then the exact name should be specified.
3) Code optimization.
Version 1.20 2018.02.21
1) Added parameter: "Coloring the cells according to the" - color of the cells according to levels or the previous candle.
2) Added the ability to run several indicators on one chart.
Version 1.10 2018.02.05
1) Removed automatic change of the letter case. Now the currency names should be written exactly like the broker's, keeping the case and prefix/suffix.
2) Added a tooltip for each cell.