Higher Highs Lower Lows
- Indicateurs
- Fabio Pacchioni
- Version: 1.1
- Activations: 5
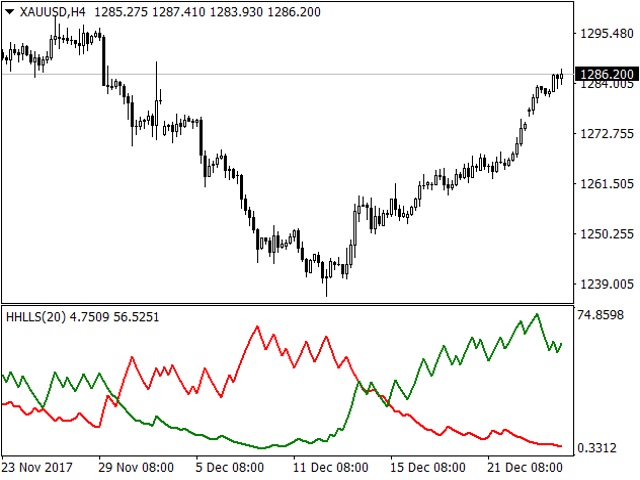
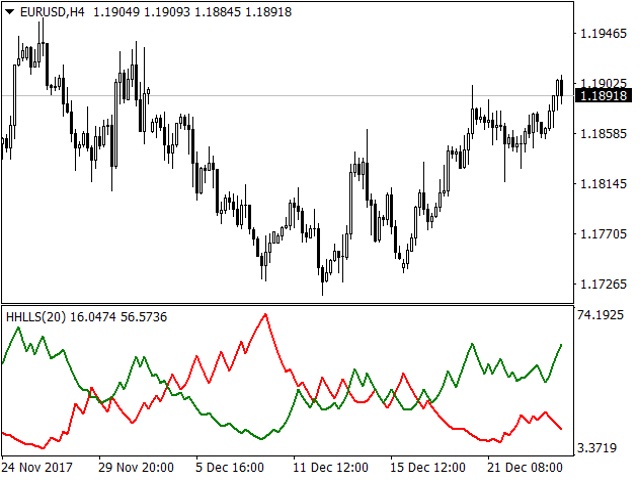
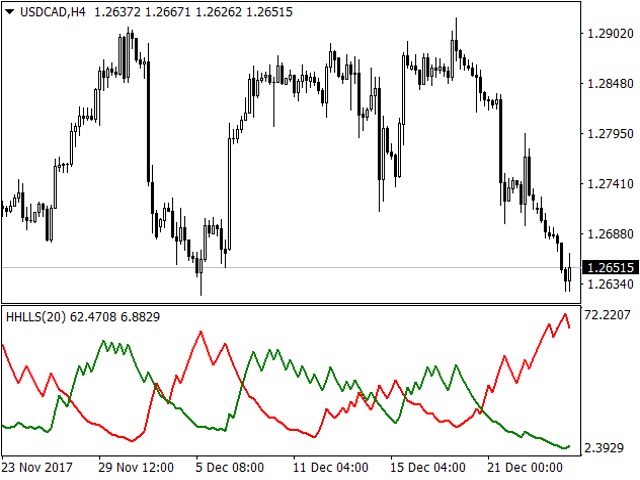
Based on Vitali Apirin's idea, here is a momentum indicator that he describes as a tool to help traders determine the direction of a trend. If the green line is over the red line, the trend is upward; if the red line is over the green one, the trend is downward.
The indicator is made up of two separate calculations: the HHs or higher high stochastic, and the LLs or lower low stochastic, which together comprise the HHLLs. Vitali Apirin uses ideas he discovered while studying the stochastic oscillator and Williams’ %R to form a new indicator based on consecutive highs and lows.
HHLLs (higher high, lower low stochastic) can help to spot emerging trends, define correction periods and anticipate reversals. As with many indicators, HHLLs signals can also be generated by looking for divergences and crossovers. Because the HHLLs is an oscillator, it can also be used to identify overbought and oversold levels.
HHLLs is based on exponentially smoothed ratios of high prices relative to their previous period high and low values, and exponentially smoothed low prices relative to their previous period high and low values. Two stochastic lines are created (HHs and LLs), whose crossovers and divergences with underlying prices indicate reversals and trend continuations. In the picture below, they are visible as green and red lines, respectively.
Parameters
- Indicator Period: number of bars used for the indicator calculations. Proper values - from 5 to 50. Typical value: 20.
- Calculated Bars: number of bars, on which the indicator is computed. The greater this number, the longer the time to show the indicator. Normally, the last 1000 bars are ok. To improve speed, i.e. when changing timeframe on the chart, please decrease this number. This number cannot be less than the number inserted in "Indicator Period".
- Moving Average method - moving average method for calculations. Values: Simple, Exponential, Smoothed, Linear Weighted.
