Support Resistance Tunnel
- Indicateurs
- Leonid Basis
- Version: 2.5
- Activations: 5
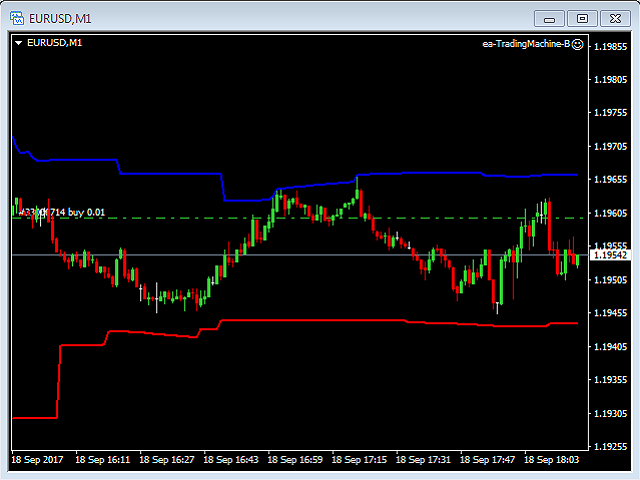
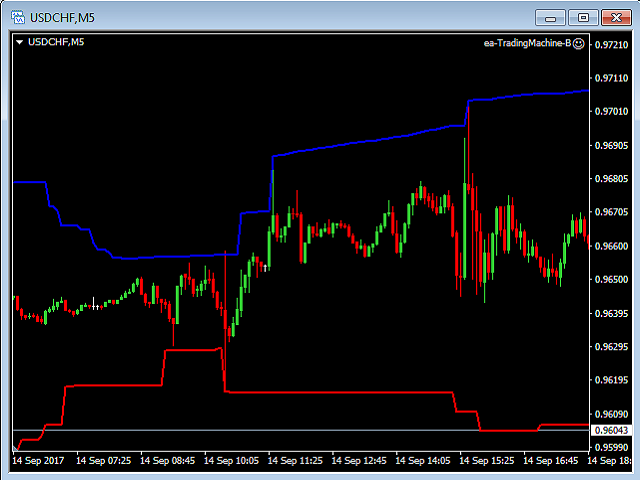
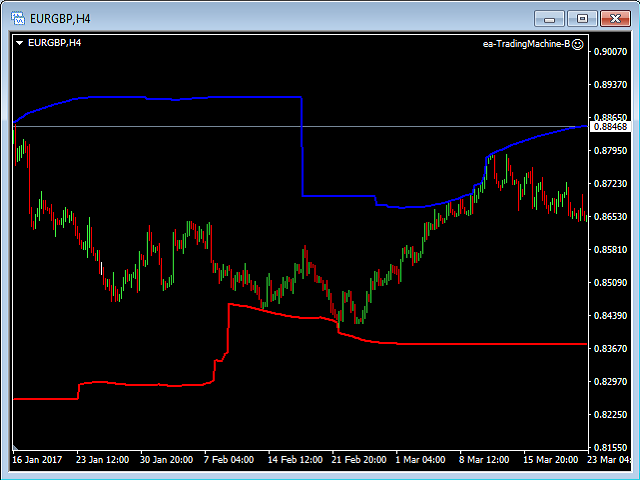
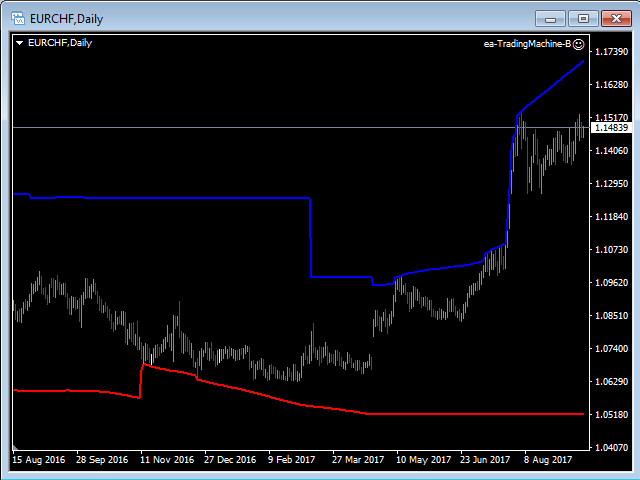
The price is moving between two curve tunnel lines in a trend. The two lines of a tunnel represent support and resistance.
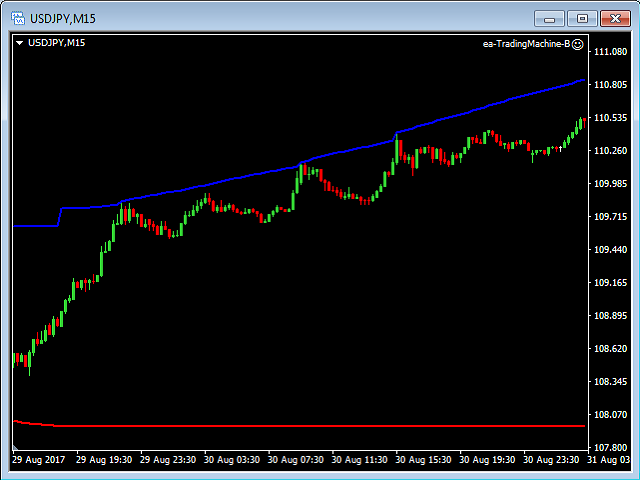
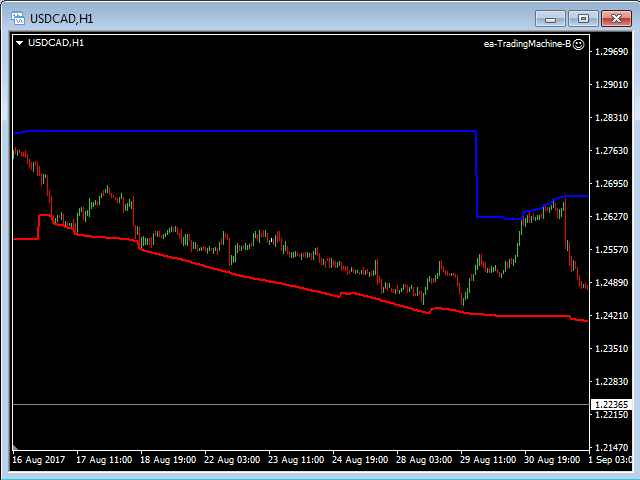
In an uptrend, for instance, a trade might be entered at the support of the trend line (shown by the red line in the chart) and exited at resistance of the upper tunnel line (shown by the blue line). Tunnel show trend direction for any timeframe (if you have enough bars on the chart for higher timeframes).
Trend, or price tunnel, can be up, down or sideways. If the current price is closer to the red line, then the blue line will be horizontal. This situation shows (most definitely) that we have a downtrend. If the current price is closer to the blue line, then the red line is a horizontal line. This situation shows (most definitely) that we have an uptrend. If two indicator lines are decreasing the height of a tunnel and both lines are parallel to each other, then we have a sideways trend.
Inputs
- BarsShow - how many bars in the chart this indicator will show the tunnel lines (starting from the current bar backward).
Note: You should have a history data on the chart, which you are using twice long as your BarsShow input parameter.

