Custom Open Price Line
- Utilitaires
- Francis Dogbe
- Version: 1.3
- Mise à jour: 25 octobre 2020
- Activations: 5
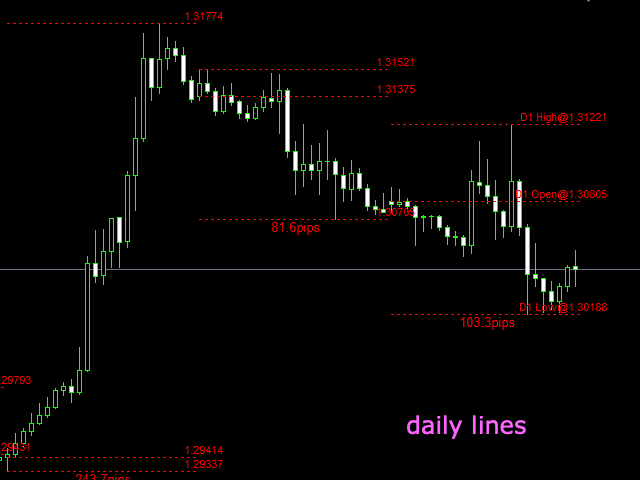
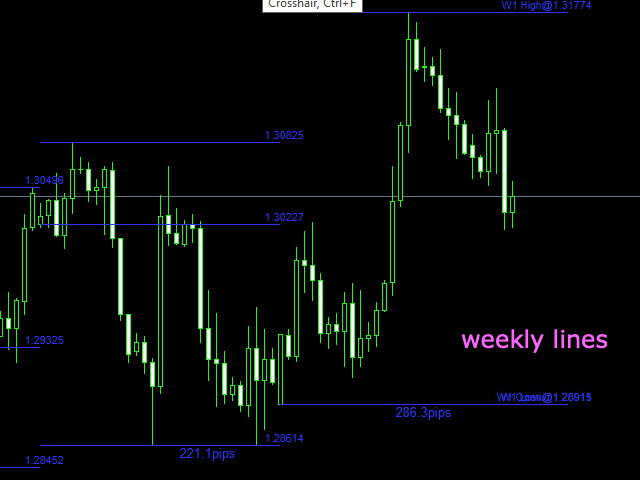
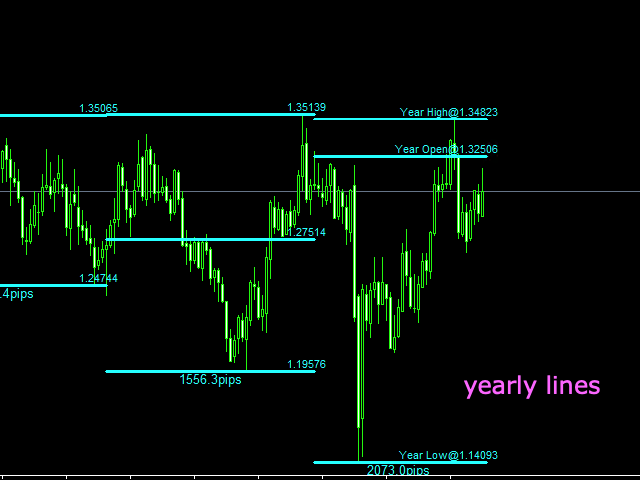
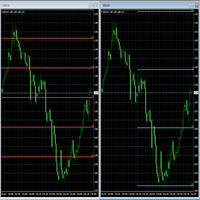
This is a simple leading indicator that will aids in drawing lines for Open price of the day, week, month, and the year. It also draws the High and Low of the periods respectively.
The Open price helps marking off the starting point of the any symbol within a specified period. These lines can be useful in determining the trend of any market (stocks and FX).
It also inclusde ranges of the pip movement of symbol of any given period. These ranges helps you to identify how far the market has moved to aid you in your trading analysis.
Also it serves as first point of identifying Support and Resistance of the symbols. If you are new to trading and you are finding it diffcult to identify your support and resistanace levels, this indicator can help you spot it out.
The indicators does not repaint and works on all symbols and time-frames.
Indicator Parameters
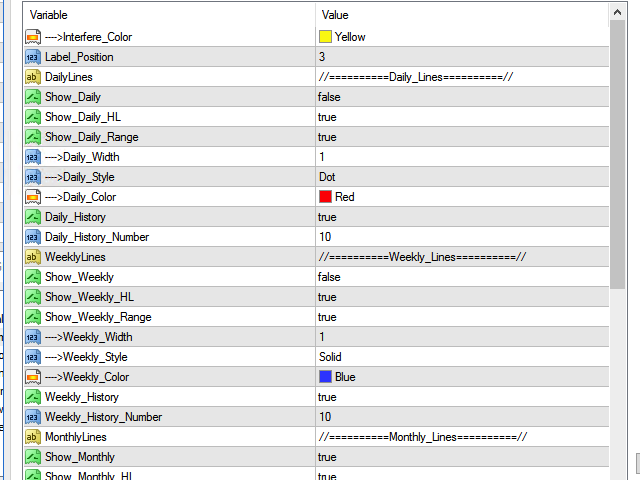
- Interfere Color : This is the color that help display then two or more periods overlaps each other.
- Label_Position : If you want to display the label at differernt positions.
- Show Daily: Display daily Open price line, it can be turned on or off.
- Show_Daily_HL : Displays Daily high and low.
- Show_Daily_Ranges: Display Daily Ranges
- Daily_Width: It helps in selecting how thick or thin the line should be.
- Daily_Style: You can adjust the style of the line, dotted or dashes.
- Daily_Color: Color of the line.
- Daily_History: If you want to display previous days Open price lines and their Highs and Lows.
- Daily_History_Number: Number of days you want the lines to displays.
The above description applies to the both weekly,monthly, yearly setup parameters.













author is very helpful