FrontRunner
- Indicateurs
- Stanislav Korotky
- Version: 1.0
- Activations: 5
Front running is a high frequency trading method of placing orders before large orders available in market book. This increases your chances to hit small take profit and eliminate stop loss behind the large order. This technique is highly profitable in comparison to most others, and is often considered to be illegal, if used by agents to make a profit at the expense of the client.
Unfortunately, Forex does not provide the order 0book. Nevertheless, large orders influence price action in a similar way: when a considerable volume is placed at a specific price level, price can hit and retreat from the level several times. This can be seen on small timeframes, such as M1.
This indicator analyses configuration of successive candles and highlights price levels, where OHLC values, specifically highs and lows, are concentrated in an unusual way.
Hence, the meaning of the name - FrontRunner is slightly different from the conventional "front running". The indicator shows you fronts of consolidated price made of side steps.
One may use classical strategies to trade the levels:
- rebound;
- break through;
depending on the number of detected retreats.
Parameters
- Limit - depth of history to process, 0 means the entire history;
- Period - number of successive bars to lookup for calculating stable levels;
- Threshold - minimal sum of weights on the lookup period required to form a front level;
- WeightOC - weight of a single open/close price of a bar in the lookup period; recommended values - 0 or 1;
- WeightHL - weight of a single high/low price of a bar in the lookup period; recommended values - 1 or 2;
- Deviation - number of Points up or down allowed in price variance to take into consideration for specific level; 0 means exact match in price extremums for bars in the lookup period; recommended values 0 - 10;
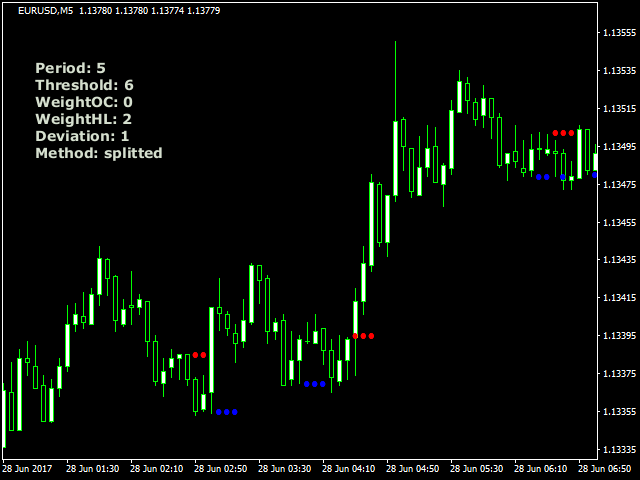
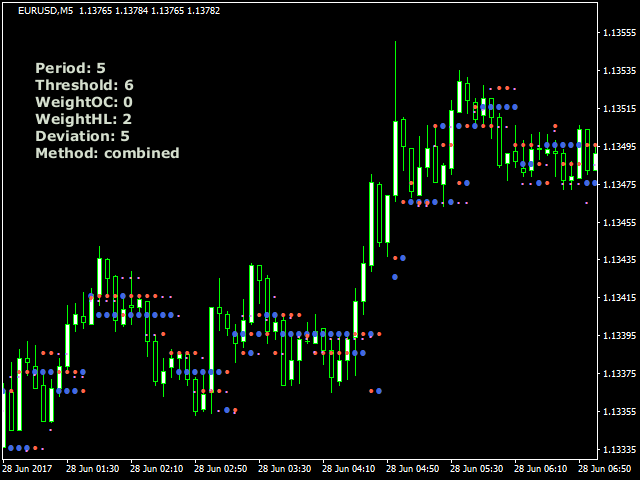
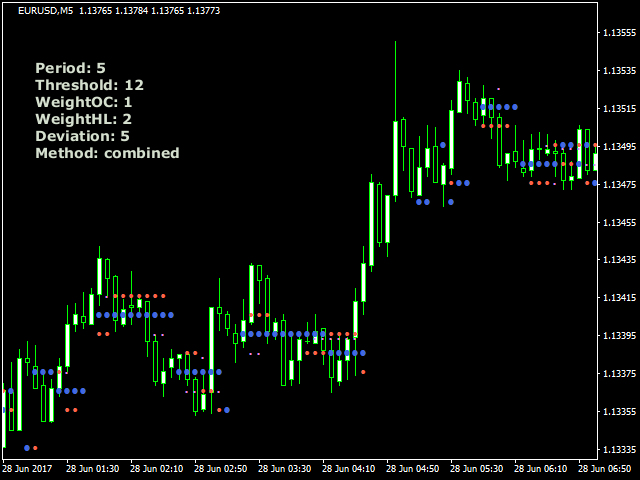
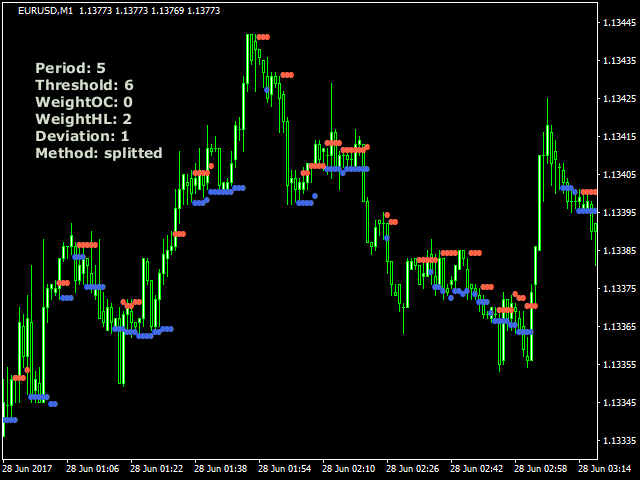
- Method - one of 2 calculation methods: splitted - retreats from above and below are calculated separately; combined - all retreats are summed up irrespective of their direction.
The method splitted shows 2 buffers: blue for upward retracement (buy) and red for downward retracement (sell). The method combined shows 3 buffers with levels of different intensity (1, 2, 3 in order from stronger to weaker).

