Radar of Probability
- Indicateurs
- Leonid Basis
- Version: 3.8
- Activations: 5
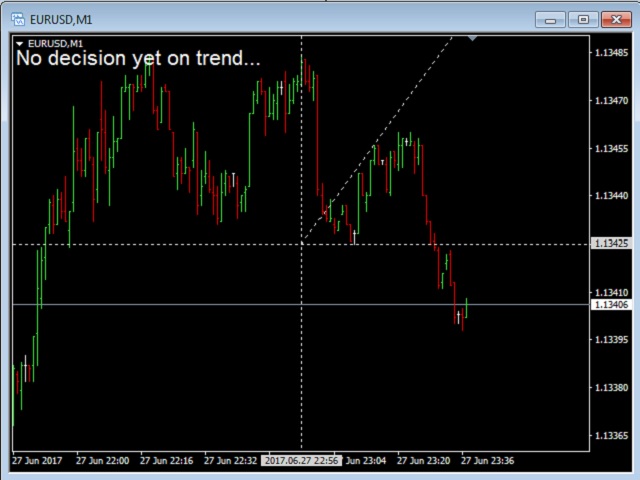
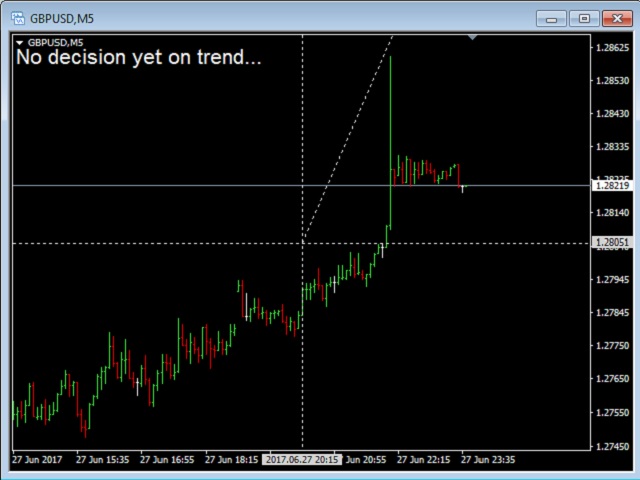
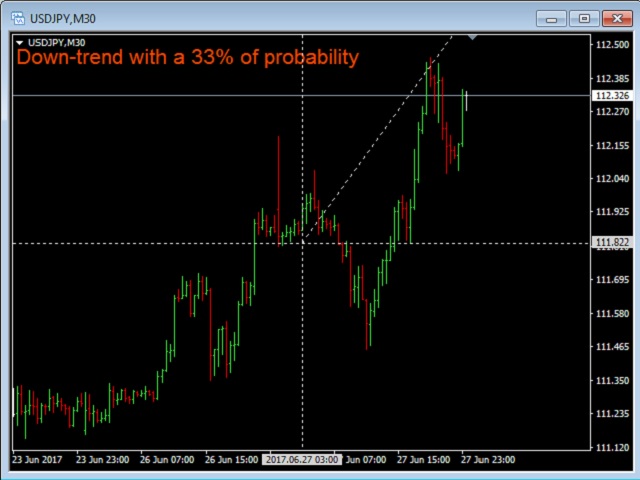
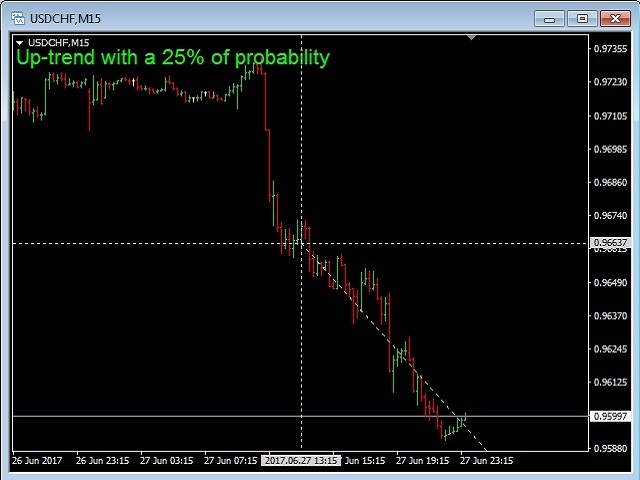
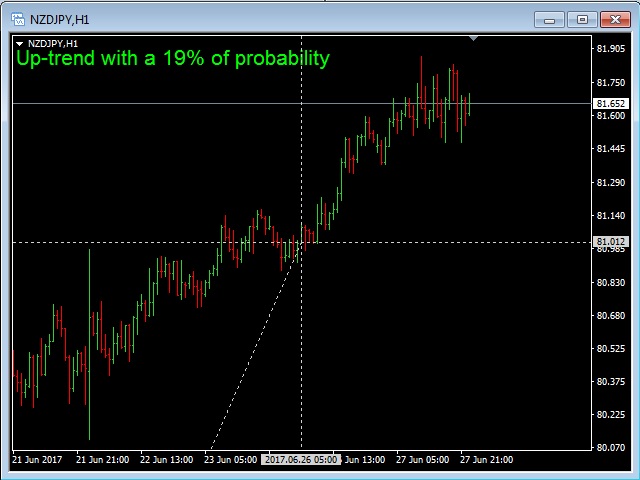
This indicator is constantly calculating the probability of a trend. The result of those calculations is shown in the upper left corner of the chart. It is shown in a green color text if the trend is expecting to go Up, in a red text if the trend is expending to go Down, and in a white text if "no trend" is calculated.
It can show cross lines in color of your choice or you can delete those cross lines by setting Cross color to "None". This indicator can show a radar vector in color of your choice or you can delete those vector by setting Radar color to "None".
Of course, the duration of a trend completely depends on the timeframe. So, for the M1 TF you can expect the right results for the next couple of minutes, for H1 TF - for the next couple of hours, etc.
Input Parameters
- Radar = clrLightGray - color of the vector line;
- Cross = clrLightGray - color of the cross lines;
- clrUp = clrLime - color of the uptrend text;
- clrDn = clrOrangeRed - color of the downtrend text;
- clrNull = clrWhite - color of the text message "No decision yet on trend...";
- Font_Size = 16 - size of font;
- Chart_Shift = true/false - turn on/off the chart shift;

