Price Action Breakout
- Indicateurs
- Cai Liang
- Version: 1.0
- Activations: 20
Price Action Breakout is one of the most popular trading strategy.
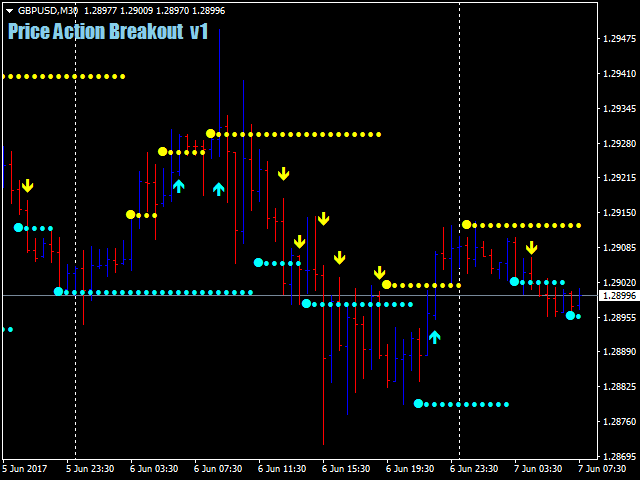
This Price Action Breakout indicator is designed using several indicators combined to be one strategy. It is very useful for traders that trade based on the breakout strategy. It will make it easier to identify the support and resistance levels.
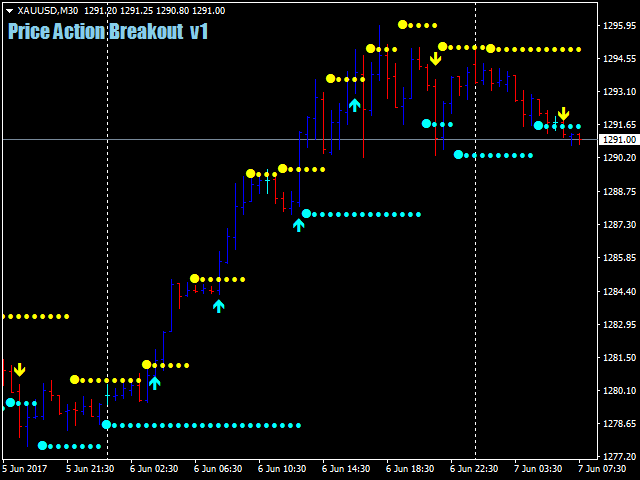
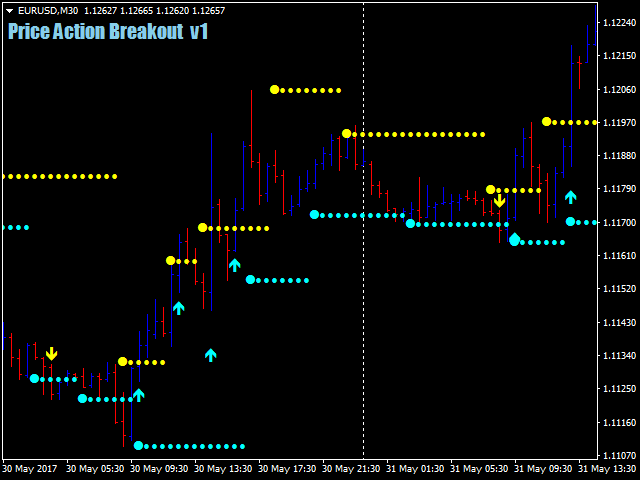
- This Price action indicator will draw the support and resistance levels on the chart, so it will make it easier to identify the support and resistance levels.
- It will inform about the support and resistance line breakouts using alerts on the chart and push notifications to your mobile device via MetaQuotes ID.
- It is very useful for a beginner trader or a professional trader to know the key support and resistance levels as well as the oversold and overbought areas.
- It is recommended to use the indicator on pairs with big movements, such as:
- AUDUSD, AUDJPY.
- EURUSD, EURJPY
- GBPUSD, GBPJPY, GBPAUD,
- GOLD and etc
- It is recommended to use it for daily trade.
- It is recommended to use it on the following time frames:
- M15
- M30
- H1.
- It provides 3 methods for generating the signal arrow:
- Support and Resistance Breakout Signal.
- Main Signal1.
- Main Signal2.
- It is very efficient when used during the European and US Market sessions.
Indicator Parameter
- Show_Ind_Name: true. - show the indicator name on the chart, set false to hide the indicator name on the chart.
- Ind_Name_Corner: Left upper corner. - you can choose which corner that the indicator name will be placed.
- Dot_Sz: 1. - it is the dot size of the support and resistance levels, you can change it as you need.
- Clr_Resistance: Yellow color. - it is the color of resistance level, you can change it as you need.
- Clr_Support: Aqua color. - it is the color of support level, you can change it as you need.
- Show_SRCrossSignal: true. - show signal arrow on the chart after the candle, when the price breaks a support or resistance level, set false to hide it.
- SR_ArrowSz: 1. - it is the arrow size for signals when the price breaks a support or resistance level.
- SR_ArrowUP: Aqua. - it is the color of arrow for bullish signals, you can change it as you need.
- SR_ArrowDN: Yellow. - it is the color of arrow for bearish signals, you can change it as you need.
- Show_MainSignal: false. - set false to hide the signal arrow on the chart for MainSignal, set true to show the signal arrow on chart.
- Signal_Size1: 1. - it is the arrow size for MainSignal.
- SignalUP1_Color: Red. - it is the color of MainSignal arrow for bullish signals, you can change it as you need.
- SignalDN1_Color: Red. - it is the color of MainSignal arrow for bearish signals, you can change it as you need.
- Show_MainSignal2: false. - set false to hide the signal arrow on the chart for MainSignal2, set true to show the signal arrow on chart.
- Signal_Size2: 1. - it is the arrow size for MainSignal2.
- SignalUP2_Color: Blue. - it is the color of MainSignal2 arrow for bullish signals, you can change it as you need.
- SignalDN2_Color: Blue. - it is the color of MainSignal2 arrow for bearish signals, you can change it as you need.
- Screen_Alert: true. - it will notify with the Pop Up Alert on chart when a signal is generated.
- Mobile_Alert: false. - it will send a notification to the mobile terminal using MetaQuotes ID when a signal is generated.


