Candle Oscillator
- Indicateurs
- Dmitriy Susloparov
- Version: 1.1
- Mise à jour: 17 novembre 2021
- Activations: 5
Do you want to see the candlestick formation on a higher timeframe, but do not want to be detached from the lower chart you trade on?
Then this indicator is for you!
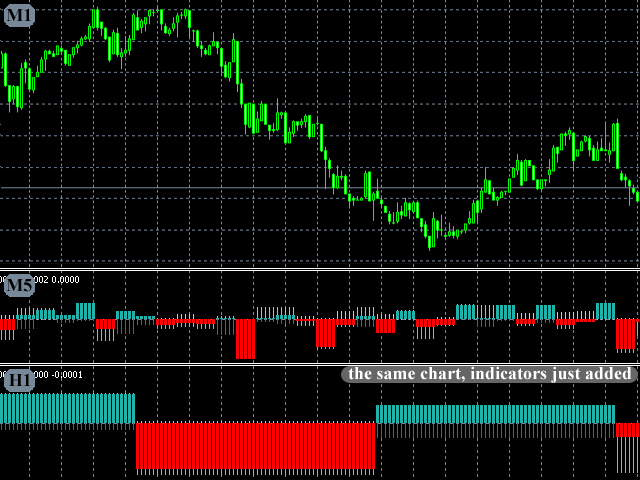
It draws candles of any timeframe as histogram bars and accurately replicates the proportions between the candle body and wicks. At the same time, the time scale is not interrupted. For example, on a minute chart, each M5 candle will take up 5 bars. Each candle formed before the start of the indicator will be replicated five times without changes. However, as new 5-minute bars are accumulated, five different candles will be shown, which correspond to the five separate phases of the 5-minute candle formation.
It is possible to run another instance of the indicator, selecting a higher timeframe. It will have a similar behavior. Thus, you will always be informed of the significance of the current price fluctuations.
When the chart scale changes, the histogram width is adjusted automatically, adapting to the selected candle width.
The indicator is tested on Just2trade
The indicator has only one parameter:
- TimeFrame - identifier of the timeframe to receive the information from.


