DEMA Crossing
- Indicateurs
- Pavel Gotkevitch
- Version: 1.2
- Mise à jour: 24 mars 2022
- Activations: 5
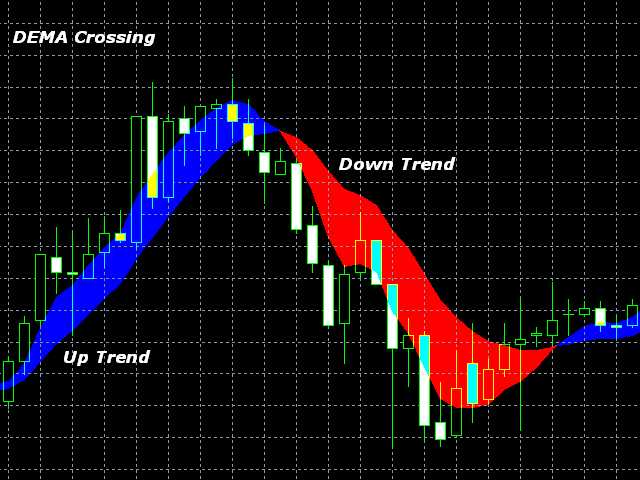
The DEMA Crossing indicator displays the intersection of two DEMA (Double Exponential Moving Average) - fast and slow.
The intersection area is filled in blue, when the fast DEMA is above the slow DEMA.
The intersection area is filled in red, when the fast DEMA is below the slow DEMA.
The advantage of the DEMA moving average is that it eliminates false signals at the saw-toothed price movement and allows saving a position at a strong trend.
The indicator clearly defines the trend direction and power and simplifies the perception of market signals.
The indicator can work on any timeframes may be useful in the strategies involving two DEMA moving averages' crossing method.
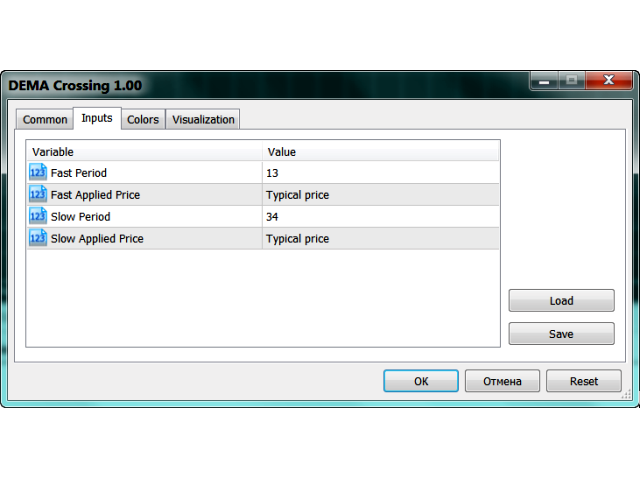
The following can be set in the indicator's Inputs tab:
- Period (Fast Period, Slow Period);
- Applied price (Close, Open, High, Low, Median, Typical, Weighted).
The Colors tab allows to choose the color of the indicator intersection areas.
Parameters
- fast period - number of bars used for fast DEMA calculation;
- fast applied price - select from the seven applied price types for the fast DEMA;
- slow period - number of bars used for slow DEMA calculation;
- slow applied price - select from the seven applied price types for the slow DEMA.








L'utilisateur n'a laissé aucun commentaire sur la note