YPY Check Your Broker
- Utilitaires
- IPA Investments LTD
- Version: 9.0
- Mise à jour: 8 octobre 2024
- Activations: 5
YPY Check Your Broker is a universal multifunctional software complex which uses primary tick data. It allows traders to perform comparative analysis of the trading conditions and execution quality, identify abnormal BID prices outside the indicative quotes. It also reflects the facts of redrawing bars in the terminal, spread extension, controls the leverage stop out level values, speed of execution and server connection breaks, maintains a detailed statistics on the slippages.
The YPY Check Your Broker software can be useful for both novice traders when choosing a broker (comparing the data for different brokers obtained on the same time interval) and professional traders, who can use recorded tick data of any broker for testing their expert advisers with 99% modeling quality, as well as for detailed analysis of the results of trading.
The current version supports any instruments and any timeframe.
Key Features
- It allows traders to simply and clearly perform comparative analysis of the trading conditions and execution quality.
- Keeps a detailed statistics on slippages when SL and TP trigger
- It reflects the facts of bars redrawing in the terminal, spread extensions, changes in leverage and stop out level.
- Detects anomalous BID prices outside the indicative quotes
- Measures and maintains statistics on the slippages and speed of order execution by the trading server (the "real test" button on the panel).
- Records disconnections with the trading server and their duration.
- Outputs a detailed specification on the instrument and trading conditions of the broker (the "info" broker on the panel).
- Writes various logs (including the tick data of any broker).
- Informs the user of custom events in different ways.
Description of the Main Expert Advisor Settings
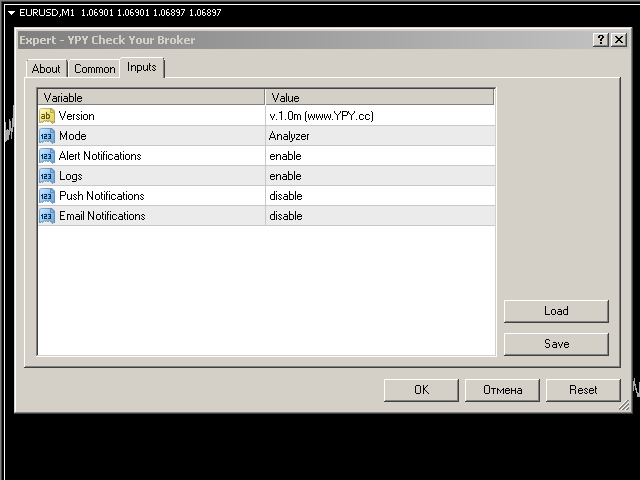
- Mode: Analyzer/Recording tick data
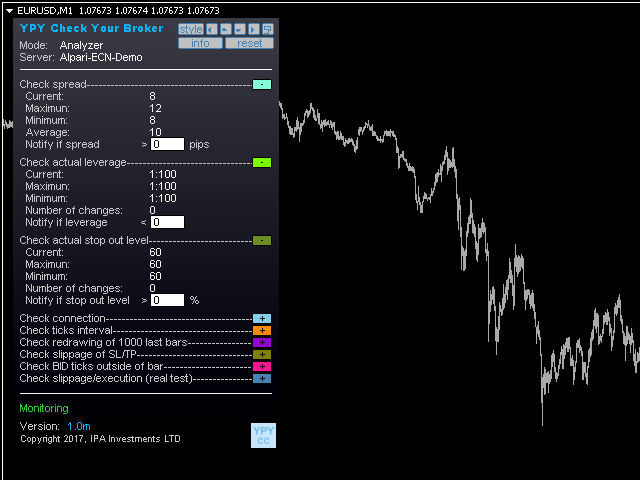
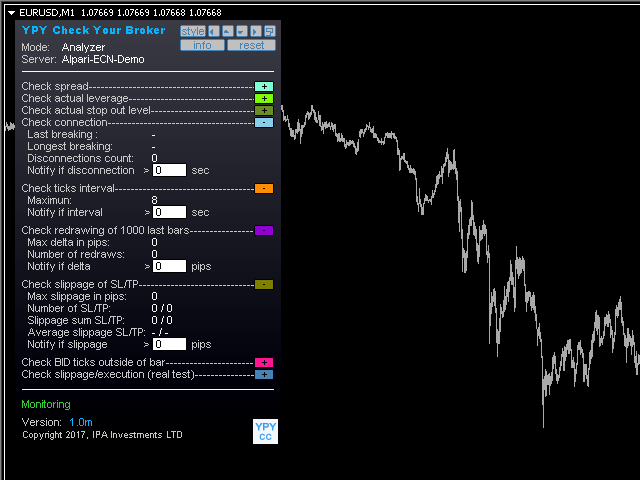
Analyzer - in this mode the expert displays all the necessary data on the chart. All measurement results are displayed in different colors over each bar on the chart.
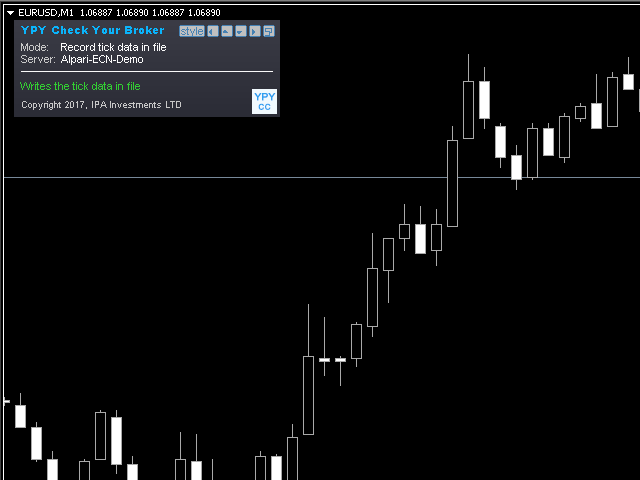
Recording tick data - in this mode the expert records the tick data to the log.
To record the most complete tick data, it is recommended to use a separate clean terminal for each instrument (with no additional program attached and without extra open charts).
- AlertNotifications=Enable/Disable - enable/disable notifications using alerts.
- Logs=Enable/Disable enable/disable writing logs, which are stored in the MQL4\Files folder of the terminal
- PushNotifications=Enable/Disable - enable/disable notifications using push notifications, configured by the user in the corresponding settings of the MetaTrader 4 terminal.
- EmailNotifications=Enable/Disable - enable/disable notifications using emails, configured by the user in the corresponding settings of the MetaTrader 4 terminal.
Control of the analyzer if performed by user via its panel. Activate the desired section by expanding its display on the panel. Minimizing any section display deactivates its analysis. Please carefully evaluate the analyzer operation in the video example below.
When the "real test" panel button is pressed, the analyzer opens and closes two orders in different directions, BUY and SELL with the minimum trading volume.
Warning
- Due to the flexibility of the analyzer and specifics of the MetaTrader 4 platform, analysis is selective and its frequency depends on many factors (the number of activated analysis sections, the number of analyzed instruments, the number of programs running in the terminal, PC performance, etc.).
- The analyzer is distributed for informational purposes only. The developer is not responsible for the accuracy and reliability of data obtained by a user in his/her terminal and for subsequent use of this data
Author
IPA Investments LTD specializes in innovations of software in the sphere of trading both for own requirements and for implementation of tasks of corporate clients.

