• Aperçu
  • Avis (46)
  • Commentaires (407)
  • Nouveautés

Cumulative Delta MT4

4.86

The indicator analyzes the volume scale and splits it into two components - seller volumes and buyer volumes, and also calculates the delta and cumulative delta.

The indicator does not flicker or redraw, its calculation and plotting are performed fairly quickly, while using the data from the smaller (relative to the current) periods.

The indicator operation modes can be switched using the Mode input variable:

  • Buy - display only the buyer volumes.
  • Sell - display only the seller volumes.
  • BuySell - display only the buyer and seller volumes in two separate scales.
  • Delta - the mode of difference (delta) between the buyer volumes and seller volumes.
  • CumDelta - cumulative delta mode.
  • CumDeltaDaily - cumulative delta mode with zeroing the balance at the beginning of each day.
  • CumDeltaWeekly - cumulative delta mode with zeroing the balance at the beginning of each week.
  • DemandAndSupply - display the supply and demand diagram.


Full recalculation of data is performed once per minute, when a new candle opens on the M1 timeframe, or in case of a user activity, namely, when scrolling the chart deeper into the history, when changing the time scale of the chart or when changing the current timeframe.

By default, the initial reference point is the very first candle from the left border of the chart window. The reference point can be changed using the BarsLimit input variable.

In case the data on any of the periods required in calculations is missing, the indicator generates a corresponding message.

Avis 46
pipMaker07
24
pipMaker07 2024.12.16 23:36 
 

As you might know, Volume is the "missing link" to understand price action. Having this prepared in the way CD does it is invaluable to make decisions fast - and it helps. The indicator seems to be rock solid; I have 12-16 instances running per profile, in various configurations and with different pairs, changing is quick, adds only about 5 seconds for the entire profile on good ol' MT4. After migrating from an STP to ECN (different account, new install, copied data) the higher TF didn't show up. I've looked around in the forum, didn't find anything and send a message to Evgeny. While I was hoping to get an answer within 1-2 days, he replied within < 4 hours. THX, btw. Also, his reply was clever enough to help me SOLVE the issue right away. The description is basic but complete, and parameter names are self-explanatory and fun to work with. My issue would probably make a good FAQ item: The higher TF simply needed more M1 and M5 history (by scrolling on those TF a couple of months) - and I think I have even seen a note of this somewhere when I bought CD half a year ago. Anyway, highly recommend this - it's one of the good indicators, gets updated and you have full support. Bye | Buy now :))

Abraham Correa
2773
Abraham Correa 2024.06.22 22:57 
 

Self explanatory rating, technically a super advanced indicator that looks good with music playing.

luganskiy
14
luganskiy 2024.02.16 10:08 
 

спасибо

Produits recommandés
Market Profile 3
Hussien Abdeltwab Hussien Ryad
3 (2)
Market Profile 3 MetaTrader 4 indicator  — is a classic Market Profile implementation that can show the price density over time, outlining the most important price levels, value area, and control value of a given trading session. This indicator can be attached to timeframes between M1 and D1 and will show the Market Profile for daily, weekly, monthly, or even intraday sessions. Lower timeframes offer higher precision. Higher timeframes are recommended for better visibility. It is also possible t
FREE
TrendPlus
Sivakumar Subbaiya
4.07 (14)
Trend Plus   Trendplus  Indicator   Time Frame: Suitable for any time frame.  Purpose: Trend Prediction. Blue and red candle indicate the buy and sell call respectively. Buy: When the blue candle is formed buy call is initiated. close the buy trades when the next red candle will formed.   Sell: When the Red candle is formed Sell call is initiated. close the Sell trades when the next blue candle will formed.   Happy trade!!
FREE
BoxInside MT4
Evgeny Shevtsov
4.86 (7)
This indicator calculates the volume profile and places labels that correspond to the VAH, VAL and POC levels, for each candle individually. Indicator operation features The indicator works on the timeframes from M5 to MN, but it uses the history data of smaller periods: M1 - for periods from M5 to H1, M5 - for the H4 period, M30 - for the D1 period, H4 - for the W1 period, D1 - for the MN period. The color and location of the VAL, VAH and POC labels on the current candle are considered to be c
FREE
Traditional MACD MT4
Daniel Lewis
4.58 (55)
MACD indicator in MetaTrader 4/5 looks different than MACD does in most other charting software. That is because the MetaTrader 4/5 version of MACD displays the MACD line as a histogram when it is traditionally displayed as a line. Additionally, the MetaTrader 4/5 version computes the Signal line using an SMA, while according to MACD definition it is supposed to be an EMA. The MetaTrader 4/5 version also does not compute a true MACD Histogram (the difference between the MACD/Signal lines). This
FREE
Profil du marché Forex (FMP en abrégé) Ce que ce n'est pas : FMP n'est pas l'affichage TPO classique à code alphabétique, n'affiche pas le calcul global du profil de données du graphique et ne segmente pas le graphique en périodes et ne les calcule pas. Ce qu'il fait : Plus important encore, l'indicateur FMP traitera les données situées entre le bord gauche du spectre défini par l'utilisateur et le bord droit du spectre défini par l'utilisateur. L'utilisateur peut définir le spectre en tiran
FREE
High Low Open Close MT4
Alexandre Borela
4.79 (19)
Si vous aimez ce projet, laissez un examen 5 étoiles. Cet indicateur tire les prix ouverts, élevés, bas et de fermeture pour les prix spécifiés période et il peut être ajusté pour un fuseau horaire spécifique. Il s ' agit là d ' un niveau important qui s ' intéresse à de nombreux domaines institutionnels et professionnels. traders et peut être utile pour vous de connaître les endroits où ils pourraient être plus active. Les périodes disponibles sont les suivantes : Jour précédent. Semaine pré
FREE
Rainbow MT4
Jamal El Alama
Rainbow MT4 is a technical indicator based on Moving average with period 34 and very easy to use. When price crosses above MA and MA changes color to green, it’s a signal to buy. When price crosses below MA and MA changes color to red, it’s a signal to sell. The Expert advisor ( Rainbow EA MT4) based on Rainbow MT4 indicator, as you can see in the short video below is now available here .
FREE
Extremum Reverse Bar
Yurij Izyumov
2.8 (5)
This indicator has been created for finding the probable reversal points of the symbol price. A small candlestick reversal pattern is used it its operation in conjunction with a filter of extremums. The indicator is not redrawn! If the extremum filter is disabled, the indicator shows all points that have a pattern. If the extremum filter is enabled, the condition works – if the history Previous bars 1 candles back contains higher candles and they are farther than the Previous bars 2 candle, such
FREE
Free automatic Fibonacci is an indicator that automatically plots a Fibonacci retracement based on the number of bars you select on the BarsToScan setting in the indicator. The Fibonacci is automatically updated in real time as new highest and lowest values appears amongst the selected bars. You can select which level values to be displayed in the indicator settings. You can also select the color of the levels thus enabling the trader to be able to attach the indicator several times with differe
FREE
Le Capteur de Tendance : La Stratégie du Capteur de Tendance avec Indicateur d'Alerte est un outil d'analyse technique polyvalent qui aide les traders à identifier les tendances du marché et les points d'entrée et de sortie potentiels. Elle présente une stratégie dynamique de Capteur de Tendance, s'adaptant aux conditions du marché pour une représentation visuelle claire de la direction de la tendance. Les traders peuvent personnaliser les paramètres selon leurs préférences et leur tolérance a
FREE
Cet indicateur innovant de mesure de la force des devises de INFINITY est une aide indispensable pour les scalpers et les commerçants qui négocient à long terme. Le système d'analyse De la force/faiblesse des devises est connu depuis longtemps et utilisé sur le marché par les principaux traders du monde. Tout commerce d'arbitrage n'est pas complet sans cette analyse. Notre indicateur détermine facilement la force des devises sous-jacentes les unes par rapport aux autres. Il affiche des graphiqu
FREE
Toby Strategy Indicator
Ahmd Sbhy Mhmd Ahmd ʿYshh
The indicator rely on The Toby strategy >> The mother candle which is bigger in range than the previous six candles. A vertical line shows the last Toby Candle with the targets shown up and down. The strategy is about the closing price out of the range of the toby candle to reach the 3 targets..The most probable to be hit is target1 so ensure reserving your profits and managing your stop lose.
FREE
Wicks UpDown Target GJ Wicks UpDown Target GJ is specialized in GJ forex pairs. Choppy movement up and down on the opening range every day.  Trading breakouts on London session and New York session is recommended. Guideline Entry Strategy Idea: Step 1 - Breakout Forming (Warning! Trade on London Session and New York Session) Step 2 - Breakout Starting (Take Action on your trading plan) Step 3 - Partial Close your order & set breakeven (no-risk) Step 4 - Target complete Step 5 - Don't trade
FREE
Are you tired of drawing trendlines every time you're analyzing charts? Or perhaps you would like more consistency in your technical analysis. Then this is for you. This indicator will draw trend lines automatically when dropped on a chart. How it works Works similar to standard deviation channel found on mt4 and mt5. It has 2 parameters: 1. Starting Bar 2. Number of bars for calculation The   starting bar   is the bar which drawing of the trend lines will begin, while the   number of bars for c
FREE
Highlights trading sessions on the chart The demo version only works on the AUDNZD chart!!! The full version of the product is available at: (*** to be added ***) Trading Session Indicator displays the starts and ends of four trading sessions: Pacific, Asian, European and American. the ability to customize the start/end of sessions; the ability to display only selected sessions; works on M1-H2 timeframes; The following parameters can be configured in the indicator: TIME_CORRECTION = Correct
FREE
Follow The Line
Oliver Gideon Amofa Appiah
4 (15)
FOLLOW THE LINE GET THE FULL VERSION HERE: https://www.mql5.com/en/market/product/36024 This indicator obeys the popular maxim that: "THE TREND IS YOUR FRIEND" It paints a GREEN line for BUY and also paints a RED line for SELL.  It gives alarms and alerts of all kinds. IT DOES NOT REPAINT and can be used for all currency pairs and timeframes. Yes, as easy and simple as that. Even a newbie can use it to make great and reliable trades. NB: For best results, get my other premium indicators for more
FREE
This indicator will mirror the assets in use in another metatrader, being able to choose the timeframe and a template. This is the Metatrader 4 Client, it needs the Metatrader 4 or 5 Server versions: Metatrader 4 Mirror Chart Server: https://www.mql5.com/en/market/product/88644 Metatrader 5 Mirror Chart Server:   https://www.mql5.com/en/market/product/88652 Details of how it works in the video.
FREE
Discover the power of precision and efficiency in your trading with the " Super Auto Fibonacci " MT4 indicator. This cutting-edge tool is meticulously designed to enhance your technical analysis, providing you with invaluable insights to make informed trading decisions. Key Features: Automated Fibonacci Analysis: Say goodbye to the hassle of manual Fibonacci retracement and extension drawing. "Super Auto Fibonacci" instantly identifies and plots Fibonacci levels on your MT4 chart, saving you tim
FREE
HMA Trend
Pavel Zamoshnikov
4.6 (67)
A trend indicator based on the Hull Moving Average (HMA) with two periods. The Hull Moving Average is an improved variant of the moving average, which shows the moment of trend reversal quite accurately. It is often used as a signal filter. Combination of two types of Hull Moving Averages makes a better use of these advantages: HMA with a slow period identifies the trend, while HMA with a fast period determines the short-term movements and signals in the trend direction. Features The movement d
FREE
This indicator alerts you when/before new 1 or 5 minute bar candle formed. In other words,this indicator alerts you every 1/5 minutes. This indicator is especially useful for traders who trade when new bars formed. *This indicator don't work propery in strategy tester.Use this in live trading to check functionality. There is more powerful Pro version .In Pro version,you can choose more timeframe and so on. Input Parameters Alert_Or_Sound =Sound ----- Choose alert or sound or both to notify y
FREE
MT4 Candlestick Pattern Alert Indicator: Stay Ahead of Trading Opportunities Overview The MT4 Candlestick Pattern Alert Indicator is a robust tool designed to empower traders by detecting candlestick patterns and delivering timely alerts through notifications, emails, and pop-up alerts. This invaluable tool saves traders precious time, allowing focused analysis on patterns and potential profitable trades. Importance of Candlestick Patterns Candlestick patterns are pivotal in technical analysis,
FREE
Zig Zag 123
Stephen Reynolds
Zig Zag 123 tells us when a reversal or continuation is more likely by looking at the shift in supply and demand. When this happens a signature pattern appears known as 123 (also known ABC) will often break out in direction of higher low or lower high. Stop loss and take profit levels have been added. There is a panel that shows the overall performance of your trades for if you was to use these stop loss and take profit levels.  We get alerted if a pattern 123 appears and also if the price re
FREE
QualifiedEngulfing
Ashkan Hazegh Nikrou
QualifiedEngulfing est la version gratuite de l'indicateur ProEngulfing . ProEngulfing est la version payante de l'indicateur Advance Engulf. Téléchargez-le ici. Quelle est la différence entre la version gratuite et la version payante de ProEngulfing ? La version gratuite a une limitation d'un signal par jour. Présentation de QualifiedEngulfing - Votre indicateur de motif Engulf professionnel pour MT4 Libérez la puissance de la précision avec QualifiedEngulfing, un indicateur de pointe conçu p
FREE
The indicator displays price distribution on a horizontal histogram. Horizontal histogram help find out key levels of price so that you can make good decision on setting point of take profit, stop loss... You can improve exist trading strategy or get new trading idea with the histogram of price. Outstanding features Support multiple time frame : you can choose to work with history data in any time frame you want. It does not depend on current display time frame. Support weighting by volume and/
FREE
OrderBlock TS Roman
Vladislav Vlastovskii
3.8 (5)
Индикатор строит блоки заказов (БЗ) по торговой системе (ТС) Романа. Поиск блоков осуществляется одновременно на двух таймфремах: текущем и старшем (определяемым в настройках). Для оптимизации и игнорирования устаревших блоков в настройках задается ограничение количества дней в пределах которых осуществляется поиск блоков. Блоки строятся по правилам ТС состоящем из трех шагов: какую свечу вынесли (что?); какой свечой вынесли (чем?); правило отрисовки (как?).
FREE
The indicator analyzes the change in the minimum and maximum prices of the previous bars fixing the entrance of the big players. If the change (delta) increases, a signal is displayed on the graph in the form of an arrow. At the same time, virtual trade on history is carried out. In the free version, virtual trade is performed without refills in case of a repeat of the signal. The results of virtual trading in the form of losses / losses, profitability, drawdown and transaction lines are display
FREE
Tipu Heikin Ashi Panel
Kaleem Haider
4.56 (18)
Tipu Heikin-Ashi Panel is the modified version of the original Heiken Ashi indicator published by MetaQuotes here . A professional version of this indicator is available here . Features An easy to use Panel that shows the Heiken Ashi trend of selected timeframe. Customizable Buy/Sell alerts, push alerts, email alerts, or visual on-screen alerts. Customizable Panel. The panel can be moved to any place on the chart or minimized to allow more space. Heikin means "the average", and Ashi means "foot
FREE
MegaTrends
Sivakumar Subbaiya
1 (1)
Megatrends  Indicator   Time Frame: Suitable for any time frame.  Purpose: Trend Prediction. Blue and red color indicate the buy and sell call respectively. Buy: When the blue line is originating it is opened buy call. Sell: When the Red line is origination it is opened sell call Happy trade!! this indicator is suitable for all time frame, but our recommended time frame to use 1hour and 4 hours, suitable for any chart.
FREE
Check my paid tools they work great and I share Ea's based on them for free please r ate The Dual Timeframe RSI (Relative Strength Index) indicator is a novel trading tool that allows traders to monitor RSI readings from two different timeframes on a single chart. This dual perspective enables traders to identify potential trend confirmations and divergences more effectively. For instance, a trader might use a 1-hour RSI alongside a daily RSI to ensure that short-term trades align with the broa
FREE
MASi Three Screens
Aleksey Terentev
5 (2)
MASi Three Screens is based on the trading strategy by Dr. Alexander Elder. This indicator is a collection of algorithms. Algorithms are based on the analysis of charts of several timeframes. You can apply any of the provided algorithms. List of versions of algorithms:     ThreeScreens v1.0 - A simple implementation, with analysis of the MACD line;     ThreeScreens v1.1 - A simple implementation, with analysis of the MACD histogram;     ThreeScreens v1.2 - Combines the first two algorithms in
FREE
Les acheteurs de ce produit ont également acheté
Gann Made Easy
Oleg Rodin
4.8 (113)
Gann Made Easy est un système de trading Forex professionnel et facile à utiliser qui est basé sur les meilleurs principes de trading en utilisant la théorie de mr. WD Gann. L'indicateur fournit des signaux d'ACHAT et de VENTE précis, y compris les niveaux Stop Loss et Take Profit. Vous pouvez échanger même en déplacement en utilisant les notifications PUSH. S'il vous plaît contactez-moi après l'achat! Je partagerai avec vous mes astuces de trading et d'excellents indicateurs bonus gratuitement!
Gold Stuff
Vasiliy Strukov
4.86 (249)
Gold Stuff est un indicateur de tendance conçu spécifiquement pour l'or et peut également être utilisé sur n'importe quel instrument financier. L'indicateur ne se redessine pas et ne traîne pas. Délai recommandé H1. Au niveau de l'indicateur de travail, l'Expert Advisor EA Gold Stuff est entièrement automatique. Vous pouvez le trouver sur mon profil. Vous pouvez obtenir une copie gratuite de notre indicateur Strong Support et Trend Scanner, veuillez envoyer un message privé. moi! Contactez-mo
TPSpro RFI Levels
Roman Podpora
4.85 (26)
INSTRUCTIONS       RUS   -   ANGLAIS       Il   est recommandé de l'utiliser avec un indicateur       -       TPSpro   TENDANCE PRO -   Version MT4         Bonus: 6 months of "RFI SIGNALS" subscription with your purchase! Un élément clé du trading est constitué par les zones ou les niveaux à partir desquels les décisions d'achat ou de vente d'un instrument de trading sont prises. Malgré les tentatives des principaux acteurs de dissimuler leur présence sur le marché, ils laissent inévitableme
Dynamic Forex28 Navigator
Bernhard Schweigert
5 (4)
Dynamic Forex28 Navigator - L'outil de trading Forex de nouvelle génération. ACTUELLEMENT 49 % DE RÉDUCTION. Dynamic Forex28 Navigator est l'évolution de nos indicateurs populaires de longue date, combinant la puissance de trois en un : Advanced Currency Strength28 Indicator (695 avis) + Advanced Currency IMPULSE avec ALERT (520 avis) + CS28 Combo Signals (Bonus). Détails sur l'indicateur https://www.mql5.com/en/blogs/post/758844 Qu'offre l'indicateur de force de nouvelle génération ? Tout
Gold Venamax MT4
Sergei Linskii
5 (1)
Gold Venamax   - c'est le meilleur indicateur technique boursier. L'algorithme de l'indicateur analyse l'évolution des prix d'un actif et reflète la volatilité et les zones d'entrée potentielles. Caractéristiques de l'indicateur: Il s'agit d'un super indicateur avec Magic et deux blocs de flèches de tendance pour un trading confortable et rentable. Le bouton rouge pour changer de bloc est affiché sur le graphique. La magie est définie dans les paramètres de l'indicateur, afin que vous puissie
-   Real price is 80$   - 40% Discount ( It is 49$ now ) - Lifetime update free Contact me for instruction, add group and any questions! Related Products:  Bitcoin Expert , Gold Expert - Non-repaint - I just sell my products in Elif Kaya profile, any other websites are stolen old versions, So no any new updates or support. Introduction The breakout and retest strategy is traded support and resistance levels. it involves price breaking through a previous level.  The break and retest strategy is
Trend Screener
STE S.S.COMPANY
4.78 (93)
Indicateur de tendance, solution unique révolutionnaire pour le trading et le filtrage des tendances avec toutes les fonctionnalités de tendance importantes intégrées dans un seul outil ! Il s'agit d'un indicateur multi-période et multi-devises 100 % non repeint qui peut être utilisé sur tous les symboles/instruments : forex, matières premières, crypto-monnaies, indices et actions. OFFRE À DURÉE LIMITÉE : L'indicateur Support and Resistance Screener est disponible pour seulement 50 $ et à vie. (
Scalper Inside PRO
Alexey Minkov
4.76 (63)
!SPECIAL SALE! An exclusive indicator that utilizes an innovative algorithm to swiftly and accurately determine the market trend. The indicator automatically calculates opening, closing, and profit levels, providing detailed trading statistics. With these features, you can choose the most appropriate trading instrument for the current market conditions. Additionally, you can easily integrate your own arrow indicators into Scalper Inside Pro to quickly evaluate their statistics and profitability
TPSproTREND PrO
Roman Podpora
4.68 (25)
TPSpro TREND PRO   est un indicateur de tendance qui analyse automatiquement le marché et fournit des informations sur la tendance et chacun de ses changements, ainsi que des signaux pour entrer dans des transactions sans redessiner ! L'indicateur utilise chaque bougie et les analyse séparément. faisant référence à différentes impulsions - impulsion ascendante ou descendante. Points d'entrée précis dans les transactions sur les devises, les crypto-monnaies, les métaux, les actions, les indices !
Golden Trend Indicator
Noha Mohamed Fathy Younes Badr
4.9 (10)
Golden Trend indicator  is The best indicator for predicting trend movement this indicator never lags and never repaints and never back paints    and give  arrow buy and sell    before the candle appear  and it will help you and  will make your trading decisions clearer its work on all currencies and  gold and crypto and all time frame This unique  indicator uses very secret algorithms to catch the  trends, so you can trade using this indicator and see the trend clear on charts  manual guide and
Scalper Vault
Oleg Rodin
5 (29)
Scalper Vault est un système de scalpage professionnel qui vous fournit tout ce dont vous avez besoin pour un scalpage réussi. Cet indicateur est un système de trading complet qui peut être utilisé par les traders de forex et d'options binaires. Le délai recommandé est M5. Le système vous fournit des signaux fléchés précis dans le sens de la tendance. Il vous fournit également des signaux supérieurs et inférieurs et des niveaux de marché Gann. Les indicateurs fournissent tous les types d'alertes
Currency Strength Wizard est un indicateur très puissant qui vous offre une solution tout-en-un pour un trading réussi. L'indicateur calcule la puissance de telle ou telle paire de devises en utilisant les données de toutes les devises sur plusieurs périodes. Ces données sont représentées sous la forme d'un indice de devise facile à utiliser et de lignes électriques de devise que vous pouvez utiliser pour voir la puissance de telle ou telle devise. Tout ce dont vous avez besoin est d'attacher l'
FX Levels MT4
Daniel Stein
5 (2)
FX Levels : Des zones de Support et Résistance d’une Précision Exceptionnelle pour Tous les Marchés Présentation Rapide Vous recherchez un moyen fiable pour déterminer des niveaux de support et résistance dans n’importe quel marché—paires de devises, indices, actions ou matières premières ? FX Levels associe la méthode traditionnelle « Lighthouse » à une approche dynamique de pointe, offrant une précision quasi universelle. Grâce à notre expérience réelle avec des brokers et à des mises à jour
Lux Trend
Mohamed Hassan
5 (3)
After purchase, please contact me to get your trading tips + more information for a great bonus!   Lux Trend is a professional strategy based on using Higher Highs and Lower Highs to identify and draw Trendline Breakouts! Lux Trend  utilizes two Moving Averages to confirm the overall trend direction before scanning the market for high-quality breakout opportunities, ensuring more accurate and reliable trade signals. This is a proven trading system used by real traders worldwide, demonstrating
System Trend Pro
Aleksandr Makarov
5 (2)
System Trend Pro - This is the best trend trading indicator!!! The indicator no repaint!!!  The indicator has   MTF   mode, which adds confidence to trading on the trend (   no repaint   ). How to trade? Everything is very simple, we wait for the first signal (big arrow), then wait for the second signal (small arrow) and enter the market in the direction of the arrow. (See screens 1 and 2.) Exit on the opposite signal or take 20-30 pips, close half of it, and keep the rest until the opposite s
M1 Arrow
Oleg Rodin
5 (16)
Une stratégie intraday basée sur deux principes fondamentaux du marché. L'algorithme est basé sur l'analyse des volumes et des vagues de prix à l'aide de filtres supplémentaires. L'algorithme intelligent de l'indicateur ne donne un signal que lorsque deux facteurs de marché se combinent en un seul. L'indicateur calcule les vagues d'une certaine plage sur le graphique M1 en utilisant les données de la période la plus élevée. Et pour confirmer la vague, l'indicateur utilise une analyse en volume.
IX Power MT4
Daniel Stein
4.75 (8)
IX Power : Découvrez des insights de marché pour les indices, matières premières, cryptomonnaies et forex Vue d’ensemble IX Power est un outil polyvalent conçu pour analyser la force des indices, matières premières, cryptomonnaies et symboles forex. Tandis que FX Power offre une précision maximale pour les paires de devises en utilisant toutes les données disponibles, IX Power se concentre exclusivement sur les données du symbole sous-jacent. Cela fait de IX Power un excellent choix pour les m
Actuellement 20% de réduction ! La meilleure solution pour tout débutant ou trader expert ! Ce logiciel de tableau de bord fonctionne sur 28 paires de devises. Il est basé sur 2 de nos principaux indicateurs (Advanced Currency Strength 28 et Advanced Currency Impulse). Il donne un excellent aperçu de l'ensemble du marché Forex. Il montre les valeurs de l'Advanced Currency Strength, la vitesse de mouvement des devises et les signaux pour 28 paires de devises dans tous les (9) délais. Imaginez
FX Volume
Daniel Stein
4.59 (34)
FX Volume : Découvrez le Sentiment du Marché tel que perçu par un Courtier Présentation Rapide Vous souhaitez faire passer votre approche de trading au niveau supérieur ? FX Volume vous fournit, en temps réel, des informations sur la manière dont les traders particuliers et les courtiers sont positionnés—bien avant la publication de rapports retardés comme le COT. Que vous visiez des gains réguliers ou recherchiez simplement un avantage plus solide sur les marchés, FX Volume vous aide à repére
FX Power MT4 NG
Daniel Stein
4.94 (18)
FX Power : Analysez la force des devises pour des décisions de trading plus intelligentes Aperçu FX Power est l'outil essentiel pour comprendre la force réelle des principales devises et de l'or, quelles que soient les conditions du marché. En identifiant les devises fortes à acheter et les faibles à vendre, FX Power simplifie vos décisions de trading et révèle des opportunités à forte probabilité. Que vous suiviez les tendances ou anticipiez les retournements à l'aide de valeurs extrêmes de D
Le système PRO Renko est un système de trading très précis spécialement conçu pour le trading de graphiques RENKO. Il s'agit d'un système universel qui peut être appliqué à divers instruments de négociation. Le système neutralise efficacement ce qu'on appelle le bruit du marché en vous donnant accès à des signaux d'inversion précis. L'indicateur est très facile à utiliser et n'a qu'un seul paramètre responsable de la génération du signal. Vous pouvez facilement adapter l'outil à n'importe que
Découvrez le secret pour réussir le trading Forex avec notre indicateur MT4 personnalisé! Vous êtes-vous déjà demandé comment réussir sur le marché du Forex, gagnant régulièrement des bénéfices tout en minimisant les risques? Voici la réponse que vous avez recherchée! Permettez-nous d'introduire notre indicateur MT4 propriétaire qui révolutionnera votre approche du trading. Polyvalence unique Notre indicateur est spécialement conçu pour les utilisateurs qui préfèrent les formations de bougies
Beast Super Signal
Dustin Vlok
4.73 (89)
Vous recherchez un puissant indicateur de trading forex qui peut vous aider à identifier facilement des opportunités de trading rentables ? Ne cherchez pas plus loin que le Beast Super Signal. Cet indicateur basé sur les tendances facile à utiliser surveille en permanence les conditions du marché, en recherchant de nouvelles tendances en développement ou en sautant sur celles existantes. Le Beast Super Signal donne un signal d'achat ou de vente lorsque toutes les stratégies internes s'alignent e
Black dragon indicator
Ramil Minniakhmetov
4.85 (117)
L'indicateur de détection de tendance complètera toute stratégie et peut également être utilisé comme un outil indépendant. IMPORTANT! Contactez-moi immédiatement après l'achat pour recevoir des instructions et un bonus ! Recommandations pour travailler avec l'indicateur, vous pouvez télécharger en commentaire #5 Avantages Facile à utiliser, ne surcharge pas le graphique avec des informations inutiles ; Capacité à utiliser comme filtre pour n'importe quelle stratégie ; Il a des niveaux inté
Nous vous présentons ON Trade Waves Patterns Harmonic Elliot Wolfe, un indicateur avancé conçu pour détecter divers types de schémas sur le marché à l'aide de méthodes manuelles et automatiques. Voici comment il fonctionne : Schémas Harmoniques : Cet indicateur peut identifier les schémas harmoniques qui apparaissent sur votre graphique. Ces schémas sont essentiels pour les traders qui pratiquent la théorie du trading harmonique, telle qu'elle est décrite dans le livre de Scott Carney "Harmonic
Currency Strength Exotics
Bernhard Schweigert
4.87 (31)
ACTUELLEMENT 20% DE RÉDUCTION ! La meilleure solution pour tout débutant ou trader expert ! Cet indicateur est spécialisé pour montrer la force de la devise pour tous les symboles comme les paires exotiques, les matières premières, les indices ou les contrats à terme. C'est le premier de son genre, n'importe quel symbole peut être ajouté à la 9ème ligne pour montrer la force réelle de la devise de l'or, l'argent, le pétrole, DAX, US30, MXN, TRY, CNH etc. Il s'agit d'un outil de trading unique
Advanced Supply Demand
Bernhard Schweigert
4.91 (294)
CURRENTLY 26% OFF !! Best Solution for any Newbie or Expert Trader! This indicator is a unique, high quality and affordable trading tool because we have incorporated a number of proprietary features and a new formula. With this update, you will be able to show double timeframe zones. You will not only be able to show a higher TF but to show both, the chart TF, PLUS the higher TF: SHOWING NESTED ZONES. All Supply Demand traders will love it. :) Important Information Revealed Maximize the potentia
Gold Trend   - il s'agit d'un bon indicateur technique boursier. L'algorithme de l'indicateur analyse le mouvement du prix d'un actif et reflète la volatilité et les zones d'entrée potentielles. Les meilleurs signaux de l'indicateur: - Pour la VENTE = histogramme rouge + pointeur SHORT rouge + flèche de signalisation jaune dans la même direction. - Pour l'ACHETER = histogramme bleu + pointeur LONG bleu + flèche de signalisation aqua dans la même direction. Avantages de l'indicateur: 1. L'
Easy Breakout
Mohamed Hassan
5 (9)
After your purchase, feel free to contact me for more details on how to receive a bonus indicator called VFI, which pairs perfectly with Easy Breakout for enhanced confluence!   Easy Breakout is a powerful price action trading system built on one of the most popular and widely trusted strategies among traders: the Breakout strategy ! This indicator delivers crystal-clear Buy and Sell signals based on breakouts from key support and resistance zones. Unlike typical breakout indicators, it levera
MTF Supply Demand Zones
Georgios Kalomoiropoulos
4.83 (23)
Nouvelle génération de zones d'approvisionnement et de demande automatisées. Algorithme nouveau et innovant qui fonctionne sur n'importe quel graphique. Toutes les zones sont créées dynamiquement en fonction de l'action des prix du marché. DEUX TYPES D'ALERTES --> 1) QUAND LE PRIX ATTEINT UNE ZONE 2) QUAND UNE NOUVELLE ZONE SE FORME Vous n'obtenez pas un indicateur inutile de plus. Vous obtenez une stratégie de trading complète avec des résultats prouvés.     Nouvelles fonctionnalités:   
Plus de l'auteur
Cumulative Delta MT5
Evgeny Shevtsov
4.54 (56)
The indicator analyzes the volume scale and splits it into two components - seller volumes and buyer volumes, and also calculates the delta and cumulative delta. The indicator does not flicker or redraw, its calculation and plotting are performed fairly quickly, while using the data from the smaller (relative to the current) periods. The indicator operation modes can be switched using the Mode input variable: Buy - display only the buyer volumes. Sell - display only the seller volumes. BuySell -
FREE
BoxProfile MT5
Evgeny Shevtsov
4.56 (9)
The indicator displays volume profiles based on the nesting principle. Profiles periods are pre-set so that each subsequent profile has a length twice as long as the length of the previous profile. In addition to profiles, the indicator displays volume clusters sorted by color, depending on the volume they contain. Indicator operation features The indicator works on typical timeframes from M5 to MN, but for calculations uses historical data from smaller timeframes: M1 - for timeframes from M5
FREE
Smart Depth Of Market
Evgeny Shevtsov
4.25 (16)
The indicator displays the orders book, as well as increases its depth, remembering the location of orders that have gone beyond the current "window" view. Indicator capability Display the levels of open positions. Simulation of placing/cancelling/editing pending orders directly in the displayed orders book. Indicator features The orders book display works only on those trading symbols for which it is broadcast by the broker. To reset the information about the rows that were recorded in the Sm
FREE
BoxChart MT5
Evgeny Shevtsov
5 (7)
The market is unfair if only because 10% of participants manage 90% of funds. An ordinary trader has slim changes to stand against these "vultures". This problem can be solved. You just need to be among these 10%, learn to predict their intentions and move with them. Volume is the only preemptive factor that faultlessly works on any timeframe and symbol. First, the volume appears and is accumulated, and only then the price moves. The price moves from one volume to another. Areas of volume accumu
BoxInside MT5
Evgeny Shevtsov
5 (4)
This indicator calculates the volume profile and places labels that correspond to the VAH, VAL and POC levels, for each candle individually. Indicator operation features The indicator works on the timeframes from M3 to MN, but it uses the history data of smaller periods: M1 - for periods from M3 to H1, M5 - for periods from H2 to H12, M30 - for the D1 period, H4 - for the W1 period, D1 - for the MN period. The color and location of the VAL, VAH and POC labels on the current candle are considere
FREE
BoxProfile MT4
Evgeny Shevtsov
4.92 (12)
The indicator displays volume profiles based on the nesting principle. Profiles periods are pre-set so that each subsequent profile has a length twice as long as the length of the previous profile. In addition to profiles, the indicator displays volume clusters sorted by color, depending on the volume they contain. Indicator operation features The indicator works on typical timeframes from M5 to MN, but for calculations uses historical data from smaller timeframes: M1 - for timeframes from M5
FREE
FORTS Trading Data
Evgeny Shevtsov
5 (1)
The indicator has been designed for use on FORTS, but it can also work on other markets, at brokers broadcasting the required data. A peculiarity of these data is that they cannot be requested from the broker's server as a section of history, but can only be obtained for the current moment. The indicator periodically requests the broker, collects to a file and displays the following history from the stored file: The weighted average price. The volume of buy pending orders. The volume of sell pen
FREE
Clusters Chart MT5
Evgeny Shevtsov
5 (6)
The indicator displays volume clusters or volume profiles to choose from. For trading symbols which contain the tape of deals, the indicator can perform calculations based on the tape of deals. Input variables StepPoint  - cluster step in points, if the value is zero, the step is assigned automatically. HistoryTicks  - size of tick history (for VolumeType in the mode TimeAndSales). AssociatedTimeframe  - binding the indicator to the specified timeframe of the chart, if the value is equal to Cu
BoxInside MT4
Evgeny Shevtsov
4.86 (7)
This indicator calculates the volume profile and places labels that correspond to the VAH, VAL and POC levels, for each candle individually. Indicator operation features The indicator works on the timeframes from M5 to MN, but it uses the history data of smaller periods: M1 - for periods from M5 to H1, M5 - for the H4 period, M30 - for the D1 period, H4 - for the W1 period, D1 - for the MN period. The color and location of the VAL, VAH and POC labels on the current candle are considered to be c
FREE
The indicator colors the candles relative to their volume delta. The calculation of the candles delta is based on the tick history or on the deals tape history (see below for a description of the input variable "Volumes"). Coloring is performed by two parameters : by delta sign, as candle color, by delta value, as candle color contrast against chart window background color. In addition to coloring the candles, the indicator also displays the delta profile on the interval specified by the user
AnyProfile MT4
Evgeny Shevtsov
5 (25)
The indicator displays market profiles of any duration in any place on the chart. Simply create a rectangle on the chart and this rectangle will be automatically filled by the profile. Change the size of the rectangle or move it - the profile will automatically follow the changes. Operation features The indicator is controlled directly from the chart window using the panel of buttons and fields for entering parameters. In the lower right corner of the chart window there is a pop-up "AP" button
AnyProfile MT5
Evgeny Shevtsov
5 (17)
The indicator displays market profiles of any duration in any place on the chart. Simply create a rectangle on the chart and this rectangle will be automatically filled by the profile. Change the size of the rectangle or move it - the profile will automatically follow the changes. Operation features The indicator is controlled directly from the chart window using the panel of buttons and fields for entering parameters. In the lower right corner of the chart window there is a pop-up "AP" button
Market Marker MT5
Evgeny Shevtsov
3.8 (5)
The indicator displays peak levels of activity formed by the maximum volume, tracks the correlation of the candles on all timeframes (from the highest to the lowest one). Each volume level is a kind of key trading activity. The most important cluster is inside a month, week, day, hour, etc. Indicator operation features A volume level receives Demand status if the nearest volume level located to the left and above has been broken upwards. A volume level receives Supply status if the nearest volu
The balance of supply and demand is a simple and effective market analysis method. The supply and demand diagram can show you in advance, even before the trend reversal, where the supply ends and the demand is already emerging, where the demand ends and the supply is emerging, while substantially increasing the probability of making a deal in the right direction and with a high profit factor. Indicator signals The indicator uses the price/volume values to generate signals: ED – excess demand. E
The utility refers to probabilistic analysis tools, in particular the Monte Carlo method. The Monte Carlo method is defined as the simulation of processes in purpose to evaluate their probabilistic characteristics and apply them to the solvable task. Operation features The simulation uses a tick model with the subsequent transformation to the candles form, as a model as close as possible to the real market process. The utility generates a stream of a random tick sequence until a result with th
BoxChart MT4
Evgeny Shevtsov
4.5 (6)
The market is unfair if only because 10% of participants manage 90% of funds. An ordinary trader has slim changes to stand against these "vultures". This problem can be solved. You just need to be among these 10%, learn to predict their intentions and move with them. Volume is the only preemptive factor that faultlessly works on any timeframe and symbol. First, the volume appears and is accumulated, and only then the price moves. The price moves from one volume to another. Areas of volume accumu
Clusters Chart MT4
Evgeny Shevtsov
5 (6)
The indicator displays volume clusters or volume profiles to choose from. Input variables StepPoint  - cluster step in points, if the value is zero, the step is assigned automatically. AssociatedTimeframe  - binding the indicator to the specified timeframe of the chart, if the value is equal to Current, the indicator works on all timeframes. ClustersVolume  - volume in clusters: All  - all volume. Active  - active volume (which produced the price movement). ClustersAsDelta  - difference betwee
The indicator calculates volume profiles dynamically and displays the result as VAL, VAH and POC curves. Indicator features The indicator uses the historical data of the lower (relative to the current) timeframes for calculations: M1 - for timeframes up to H1, M5 - for timeframe H1, M15 - for timeframe H4, H1 - for timeframe D1, H4 - for timeframe W1, D1 - for timeframe MN. The color of the DPOC curve sections is determined by comparing the volume of the POC levels of all profiles that make up
Time And Sales Delta
Evgeny Shevtsov
5 (2)
The indicator displays the delta and the cumulative delta based on the "Time & Sales" deals list data. In addition to the standard timeframes, the indicator displays data regarding the seconds timeframes (S5, S10, S15, S20, S30) to choose from. Using the rectangle, user can select an arbitrary area in the indicator subwindow to view the ratio of the volumes of deals of buyers and sellers within this area. Indicator features: The indicator works correctly only on those trading symbols for which
Market Marker MT4
Evgeny Shevtsov
5 (8)
The indicator displays peak levels of activity formed by the maximum volume, tracks the correlation of the candles on all timeframes (from the highest to the lowest one). Each volume level is a kind of key trading activity. The most important cluster is inside a month, week, day, hour, etc. Indicator operation features A volume level receives Demand status if the nearest volume level located to the left and above has been broken upwards. A volume level receives Supply status if the nearest volu
The balance of supply and demand is a simple and effective market analysis method. The supply and demand diagram can show you in advance, even before the trend reversal, where the supply ends and the demand is already emerging, where the demand ends and the supply is emerging, while substantially increasing the probability of making a deal in the right direction and with a high profit factor. Indicator Signals The indicator uses the price/volume values to generate signals: ED – excess demand. E
The utility refers to probabilistic analysis tools, in particular the Monte Carlo method. The Monte Carlo method is defined as the simulation of processes in purpose to evaluate their probabilistic characteristics and apply them to the solvable task. Operation features The simulation uses a tick model with the subsequent transformation to the candles form, as a model as close as possible to the real market process. The utility generates a stream of a random tick sequence until a result with the
Neural Predictor MT4
Evgeny Shevtsov
2 (1)
The indicator refers to the means of probabilistic analysis. Prediction is performed by the Monte Carlo method together with a mathematical model of a neuron. But, the modeling of samples for this method is made not artificially, but comes from the original "nature", that is, from history. The number of samples and the detail of their modeling is achieved using the lower (relative current) timeframe. Indicator algorithm : In general terms, the algorithm boils down to the fact that the indica
The utility displays the order book, as well as increases its depth, remembering the location of applications that have gone beyond the current "window" view. With the utility user can perform quick trading actions in one click - placing/cancelling/editing of explicit and hidden orders, and also opening/editing positions. Utility features The orders book display works only on those trading symbols for which it is broadcast by the broker. To reset the information about the rows that were recorde
Dynamic POC MT5
Evgeny Shevtsov
5 (1)
The indicator calculates volume profiles dynamically and displays the result as VAL, VAH and POC curves. Indicator features The indicator uses the historical data of the lower (relative to the current) timeframes for calculations: M1 - for timeframes up to H1, M5 - for timeframe H1, M15 - for timeframe H4, H1 - for timeframe D1, H4 - for timeframe W1, D1 - for timeframe MN. The color of the DPOC curve sections is determined by comparing the volume of the POC levels of all profiles that make up
The indicator refers to the means of probabilistic analysis. Prediction is performed by the Monte Carlo method together with a mathematical model of a neuron. But, the modeling of samples for this method is made not artificially, but comes from the original "nature", that is, from history. The number of samples and the detail of their modeling is achieved using the lower (relative current) timeframe. Indicator algorithm : In general terms, the algorithm boils down to the fact that the indica
Filtrer:
dario gonzalez
18
dario gonzalez 2025.02.11 14:31 
 

Hi, I have downloaded this indicator and read some comments. I find it very interesting but I feel like I am not getting the most out of it. Is there a complete manual with the description of all the parameters? Whatever the answer, thank you very much for this indicator.

Evgeny Shevtsov
74396
Réponse du développeur Evgeny Shevtsov 2025.02.11 14:43
Hello.
The information about input variables that is not in the "Overview" tab is in the "What is new" tab.
As for the use of this indicator in trading, it is generally a typical indicator, of which there are many in one variety or another, and you can search for the keywords "trading using volume delta" and "trading using cumulative delta".
pipMaker07
24
pipMaker07 2024.12.16 23:36 
 

As you might know, Volume is the "missing link" to understand price action. Having this prepared in the way CD does it is invaluable to make decisions fast - and it helps. The indicator seems to be rock solid; I have 12-16 instances running per profile, in various configurations and with different pairs, changing is quick, adds only about 5 seconds for the entire profile on good ol' MT4. After migrating from an STP to ECN (different account, new install, copied data) the higher TF didn't show up. I've looked around in the forum, didn't find anything and send a message to Evgeny. While I was hoping to get an answer within 1-2 days, he replied within < 4 hours. THX, btw. Also, his reply was clever enough to help me SOLVE the issue right away. The description is basic but complete, and parameter names are self-explanatory and fun to work with. My issue would probably make a good FAQ item: The higher TF simply needed more M1 and M5 history (by scrolling on those TF a couple of months) - and I think I have even seen a note of this somewhere when I bought CD half a year ago. Anyway, highly recommend this - it's one of the good indicators, gets updated and you have full support. Bye | Buy now :))

Abraham Correa
2773
Abraham Correa 2024.06.22 22:57 
 

Self explanatory rating, technically a super advanced indicator that looks good with music playing.

luganskiy
14
luganskiy 2024.02.16 10:08 
 

спасибо

joseverasay
284
joseverasay 2023.06.29 03:13 
 

Muy útil gracias

Ainur Rasyid
119
Ainur Rasyid 2023.06.21 01:46 
 

Hi, I have trouble calling this indicator via EA with iCustom, a notification appears in Experts Logs: 2023.06.21 04:05:07.567 Cumulative Delta MT4 NZDJPY,M5: cannot set timer (1). Any suggestion to fix it? Btw this is a very useful indicator, thank you!

Evgeny Shevtsov
74396
Réponse du développeur Evgeny Shevtsov 2023.06.21 08:05
Hello.
See the "What is new" tab for version 3.2 (especially the latest sentence).
If after you have questions, then write on the "Comments" tab, because the "Reviews" tab is not suitable for conducting dialogues.
Melanio Aganus
43
Melanio Aganus 2023.06.07 11:59 
 

Its very useful and i like it but the but is loading very very slow i hope it be updates and remain free thank you so much

Evgeny Shevtsov
74396
Réponse du développeur Evgeny Shevtsov 2023.06.07 15:10
Hello.
Indeed, on higher timeframes, the indicator may work more slowly.
Try using the input variable "RecalculationTiming" with a higher value.
ElisaP
740
ElisaP 2023.04.30 00:51 
 

unfortunately I have never understood what it can be used for, what help it can give ??? neither this nor footprint nor volumebox nor ask bid histogramm no POC candle, red dot inside the bar, no cum delta, no accumulated volumes, no imbalanced volume, no market profile, no DOM no tick sell buy volume no VWAP Channel so i stopped using them ,,if someone wants them can send me in PM to me

Смарт Бот
18
Смарт Бот 2023.02.22 11:51 
 

Спасибо

zandor77
14
zandor77 2023.01.13 10:34 
 

Excellent

garry143
19
garry143 2022.11.24 07:27 
 

Hi, I don't know how it works but I can see the price moving as per the Indicator which is a great thing for people like us. A lot of thanks to the creator. I have one question as well: How to take into account and evaluate the 2 lines in the Cumm Delta (Orange and blue) as shown in the screenshot number 3? Will be grateful to learn

Evgeny Shevtsov
74396
Réponse du développeur Evgeny Shevtsov 2022.11.24 07:58
Hello.
The blue curve is the cumulative delta.
The yellow curve is just the price chart based on closing prices, which is projected and scaled to the indicator subwindow.
J.C. Hoffman
36
J.C. Hoffman 2022.08.15 18:20 
 

L'utilisateur n'a laissé aucun commentaire sur la note

Thippeswamaiah Jmath J M
158
Thippeswamaiah Jmath J M 2022.07.14 05:34 
 

good

Garhardt
285
Garhardt 2022.06.01 18:47 
 

An invaluable indicator as it provides info and data not seen elsewhere. A very unique perspective. Evgeny is very accommodating and revised it.

Xeworg
29
Xeworg 2022.04.21 19:57 
 

L'utilisateur n'a laissé aucun commentaire sur la note

kadichetty
14
kadichetty 2022.01.25 06:43 
 

Здравейте какво трябва да представлява линията с цвят Golden Rod? Благодаря ти

Evgeny Shevtsov
74396
Réponse du développeur Evgeny Shevtsov 2022.01.26 06:43
Hello.
The curve, which is drawn in the color GoldenRod, is just a copy of the price chart at the closing prices of candles.
Юрий Серба
21
Юрий Серба 2021.10.10 09:20 
 

Отличный индикатор. Только поставил буду тестить. То что я искал. На просторах интернета такого больше нет.

Viktor Barilko
5033
Viktor Barilko 2021.08.15 12:28 
 

Отличный индикатор.

holbos
18
holbos 2021.07.05 11:20 
 

Доброго времени суток всем ! Никогда не сталкивался с дельтой , чтобы использовать ее в торговле. Использую торговлю по уровням без индюков. Очень часто стоит дилемма пробоя или отскока. Когда то читал, что дельта может помочь в данном вопросе, но к сожалению сам пока не разобрался , как можно применить этот индикатор.

Displesher
14
Displesher 2021.07.01 01:49 
 

Как раз то, что я искал! Спасибо!

123
Répondre à l'avis
Version 3.6 2024.11.10
The indicator has been recompiled in MT4 build 1420.
Version 3.5 2024.04.18
A new mode “InCandles” has been added to the list of modes of the input variable “HistoryLoadMode”, in which the duration of the history is set by the number of candles.
The number of candles, in turn, is set via the input variable “HistoryCandles” (if the value is zero, the number of candles is counted from the left side of the chart window).
Version 3.4 2024.01.27
The new input variable "PriceCurveWithCumDelta" turns on/off the display of the price curve in the cumulative delta display mode.
The indicator is compiled in MT4 build 1403.
Version 3.3 2023.11.03
Two new modes have been added to the list of modes of the input variable "CumDeltaDrawing" :
- "AsHistogramOfDiffWithPrice",
- "AsColoredHistogramOfDiffWithPrice",
which displays the difference between the cumdelta curve and the price curve.
Version 3.2 2023.05.22
The input variable “HistoryLoadMode”, as a drop-down menu, sets the history loading mode in several options:

1. “FromSpecifiedTime” - by the start date/time specified in the input variable “HistoryStartTime”.
2. “InMonths” - by the number of months (from the beginning of the month) specified in the input variable “HistoryMonths” (value 0 means from the beginning of the current month).
3. “InWeeks” - by the number of weeks (from the beginning of the week) specified in the input variable “HistoryWeeks” (value 0 means from the beginning of the current week).
4. “InDays” - by the number of days (from the beginning of the day) specified in the input variable “HistoryDays” (value 0 means from the beginning of the current day).
5. “InHours” - by the number of hours (from the beginning of the hour) specified in the input variable “HistoryHours” (value 0 means from the beginning of the current hour).

With the advent of the input variable “HistoryLoadMode”, the input variable “BarsLimit” have been abolished as unnecessary.

When calling the indicator from outside, use the input variable “RecalculationTiming” with a negative value (any value), which specify to the indicator that it was called from outside.
Version 3.1 2022.11.30
The indicator is recompiled in MT4 build 1356.
Version 3.0 2022.08.20
The new "Relative volume" mode has been added to the list of modes of the input variable "Mode".
To control this mode, the input variable "RvPeriod" has been additionally created, which sets the calculation period.
Version 2.9 2022.05.28
In this version, an attempt has been made to eliminate the error "cannot set millisecond timer” that occurs when the indicator is called from the outside.

A new input variable “Timing” has also been added, which sets the frequency of recalculation in milliseconds.
When calling the indicator from outside (from another indicator or from EA), the value of this input variable must be set to zero.

The indicator is compiled in MT4 build 1356.
Version 2.8 2022.05.10
The indicator is recompiled in MT4 build 1356.
Version 2.7 2022.04.12
The input variable Volumes has been renamed to VolumesType.

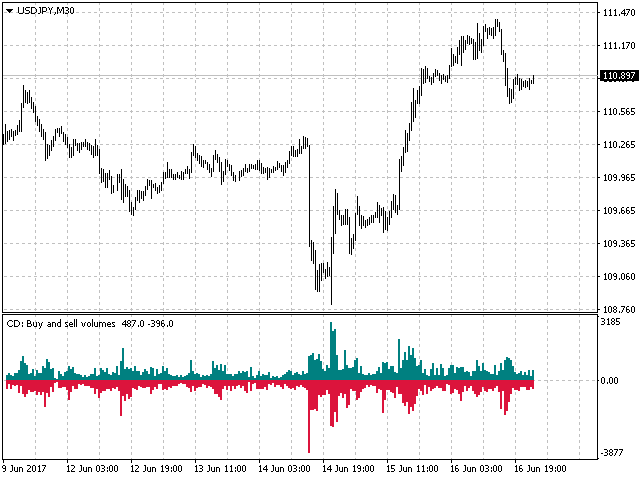
The new input variable VolumesMode switches the method of decomposition of candles volumes into buyers and sellers volumes :
- All - the whole volume is involved in decomposition.
- Active - only the volume that produced the movement is involved in decomposition.

The indicator is compiled in MT4 build 1355.
Version 2.6 2021.09.23
The indicator is recompiled in MT4 build 1345.
Version 2.5 2021.04.17
A new DemandAndSupplyDifference mode has been added to the list of modes of the input Mode variable, which displays the difference between the DemandAndSupply curves.
A new AsColoredHistogram mode has been added to the list of modes of the input variable CumDeltaDrawing, where the values of the histogram columns above and below zero are displayed in different colors.
The indicator is compiled in MT4 build 1330.
Version 2.4 2020.12.08
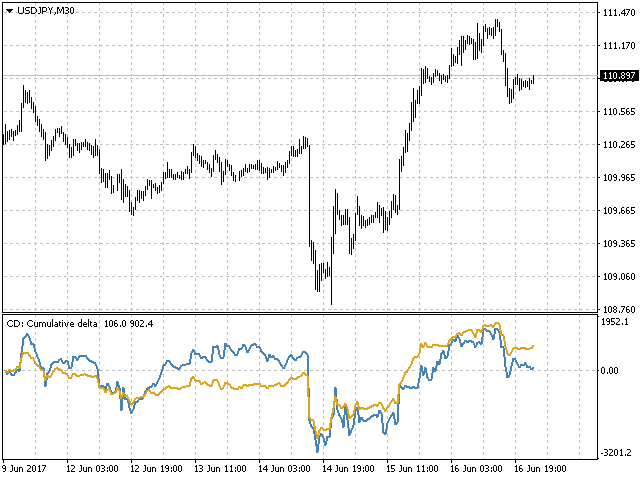
The input variable CumDeltaDrawing switches the way the cumulative delta is displayed - either as a curve or as a histogram.
The indicator is compiled in MT4 build 1310.
Version 2.3 2020.12.03
The indicator is recompiled in MT4 build 1310.
Version 2.2 2020.10.20
The indicator is recompiled in MT4 build 1280.
Version 2.1 2020.08.17
Displaying the values of the demand and supply curves in Mode=DemandAndSupply is converted to percentages. The 100% reference value is the largest value of the demand curve (or supply curve), that is located on the right-to-left side of the last candle and up to the left border of the chart window, or that is located on the right-to-left side of the last candle and the amount specified in the input variable BarsLimit.

A full recalculation (in any mode) the indicator still performs once a minute, at the moment when a new candle appears on the M1 timeframe, and regardless of which timeframe is selected in the input variable Timeframe.
Version 2.0 2020.08.02
Using the input variable Timeframe, user can select the timeframe that the indicator will work with directly, which allows to place multiple instances of the indicator in the same chart window, but with results from different timeframes displayed.
Using the input variable DsSmoothing user can enable or disable curves smoothing for the DemandAndSupply and DemandAndSupplyRatio modes.
Using the input variable DsPeriod user can set the period (if the value is zero, the period is assigned automatically) for calculating curves for the DemandAndSupply and DemandAndSupplyRatio modes.
Version 1.9 2020.07.12
The indicator is recompiled in MT4 build 1262.
Version 1.8 2019.07.14
Added a new feature DemandAndSupplyRatio that displays the ratio between demand and supply curves.
Version 1.7 2019.03.28
The function of tint the reverse bar is now also work in Delta mode.
Version 1.6 2018.12.14
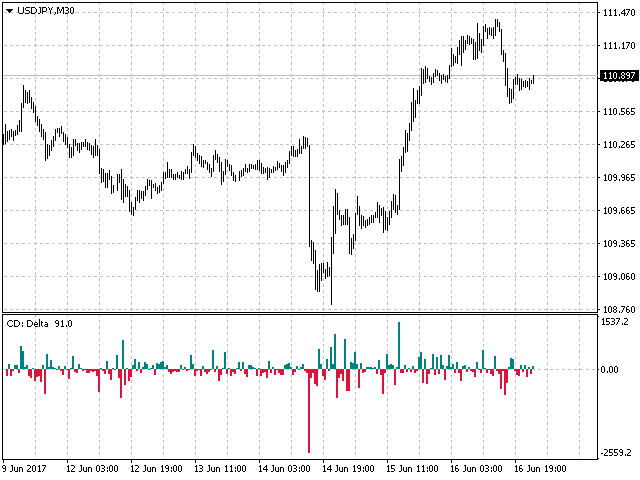
In the mode Delta there are two display options that can be selected using the optional input variable DeltaDrawing:
UpOnly - the columns of the histogram are directed only upwards, regardless of the delta sign.
UpAndDown - the columns of the histogram are directed depending on the delta sign.
Version 1.5 2018.11.13
Added alerts for modes Delta, BuyAndSellVolumes, DemandAndSupply.
Alerts are triggered when the levels AlertLevelForDemand and AlertLevelForSupply are reached by the value on the current candle.
Version 1.4 2017.12.27
Fixed calculation of cumulative volume period in the DemandAndSupply mode for financial symbols having an additional short trading day.
Version 1.3 2017.06.23
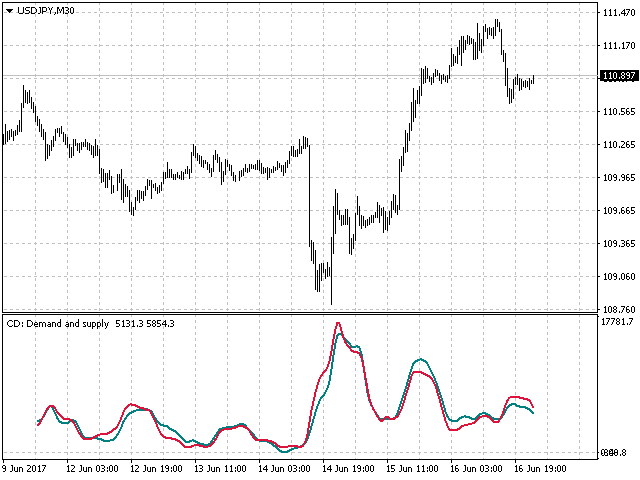
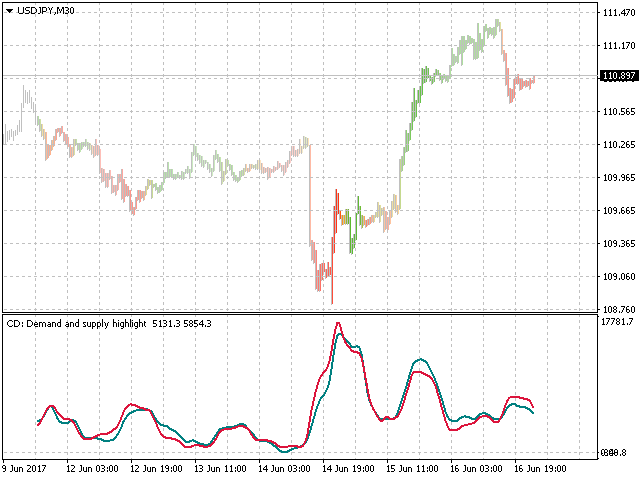
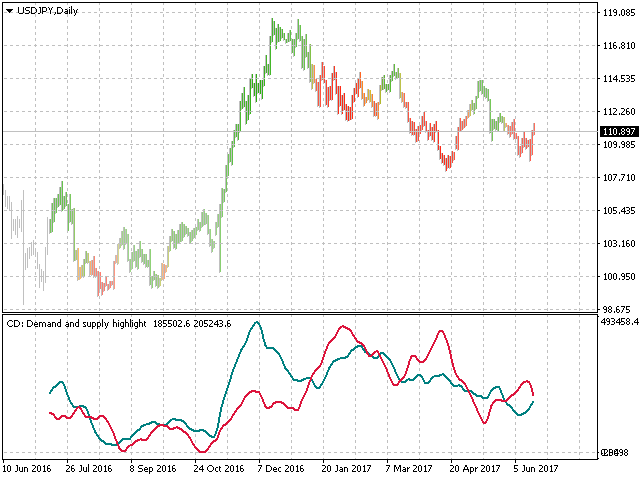
Added new DemandAndSupply mode, which is displayed as a demand and supply diagram with two lines.
The green line shows demand, the red line shows supply.
The mode can be additionally managed using the DsContrast input variable:
DsContrast = 0 - no candlestick coloring,
DsContrast > 1 - coloring candlesticks,
DsContrast < -1 - reverse coloring.
Version 1.2 2017.04.14
No significant changes have been made. The indicator code has been slightly optimized in order to reduce the number of excessive cyclic calculations and, as a consequence, to reduce the load on the terminal.
Version 1.1 2017.03.28
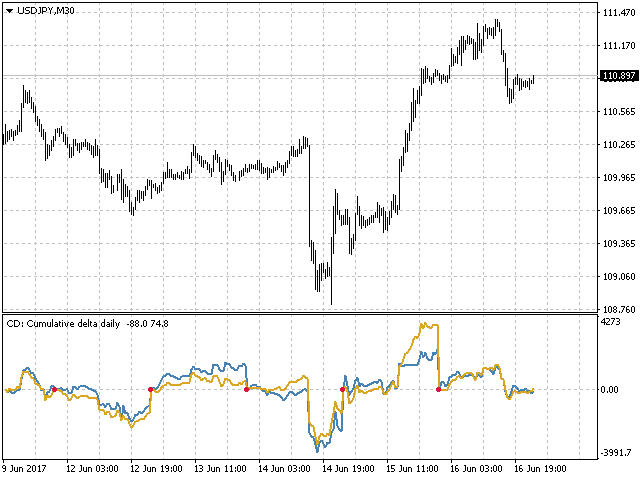
In the CumDelta, CumDeltaDaily and CumDeltaWeekly modes, a price line based on Close prices of candles is scaled and displayed in the indicator window, in parallel with the cumulative delta line.
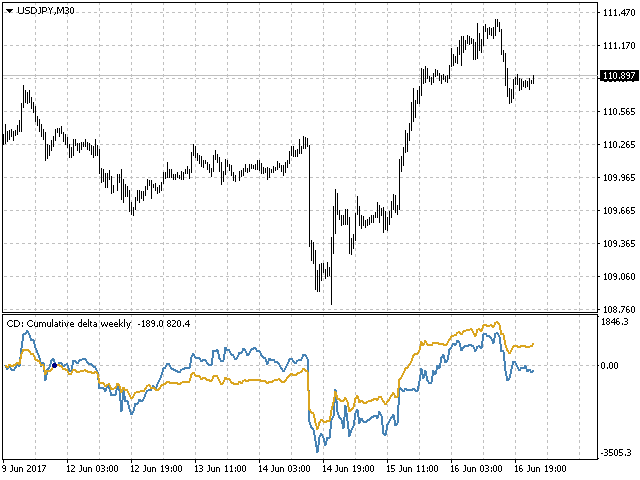