All Pivot Points
- Indicateurs
- Alfred Kamal
- Version: 2.0
- Mise à jour: 14 décembre 2019
- Activations: 5
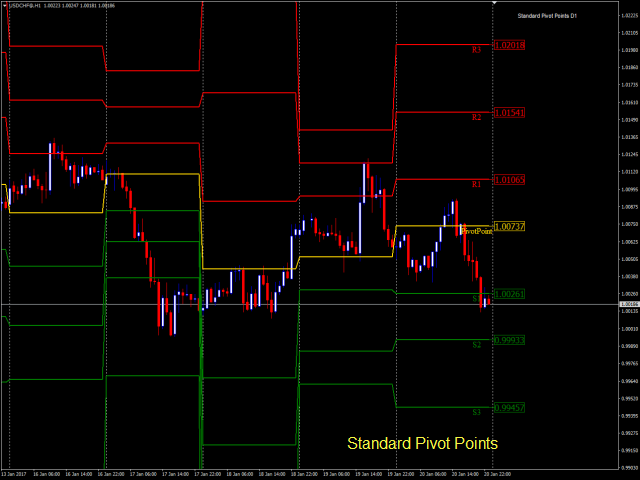
Pivot Points is used by traders to objectively determine potential support and resistance levels.
Pivots can be extremely useful in Forex since many currency pairs usually fluctuate between these levels. Most of the time, price ranges between R1 and S1.
Pivot points can be used by range, breakout, and trend traders.
Range-bound Forex traders will enter a buy order near identified levels of support and a sell order when the pair nears resistance.
But there are more one method to determine Pivot points.
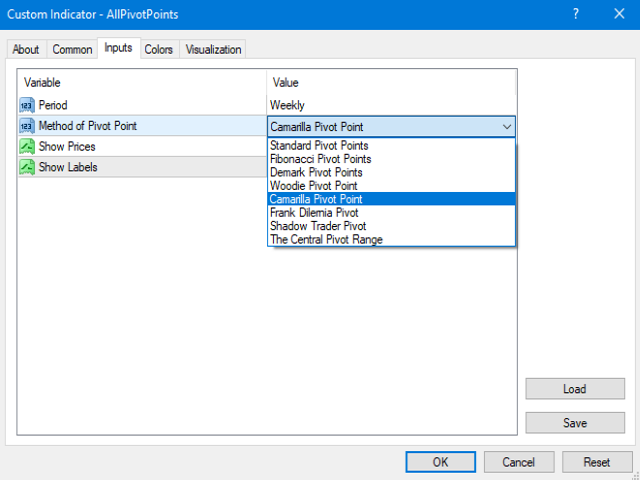
This indicator let you see lines of Pivot points for all methods and also see Daily Pivot points, Weekly Pivot points and Monthly Pivot points
- standard Pivot Points
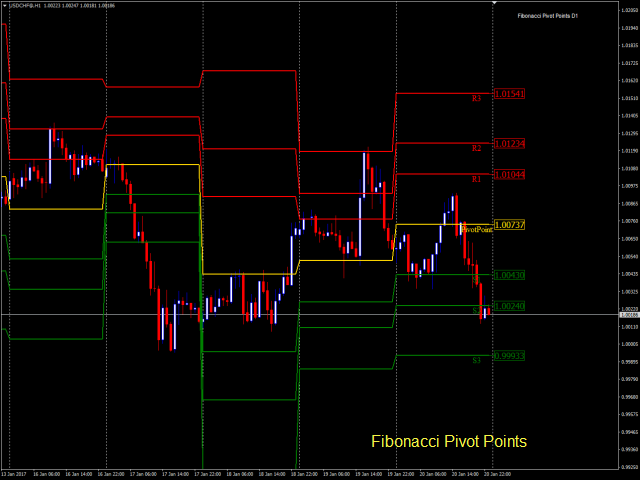
- Fibonacci Pivot Points
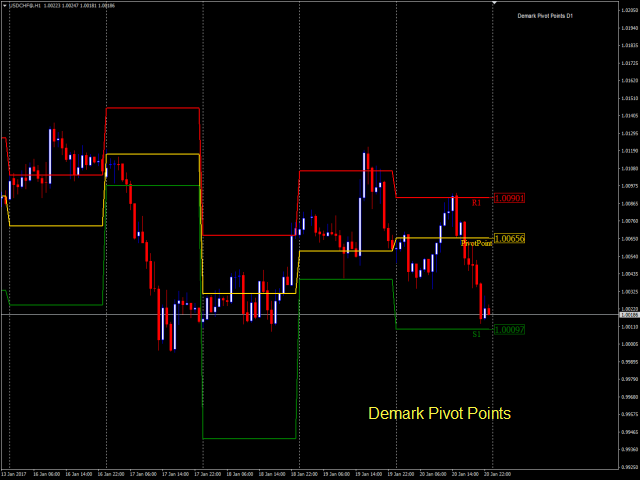
- Demark Pivot Points
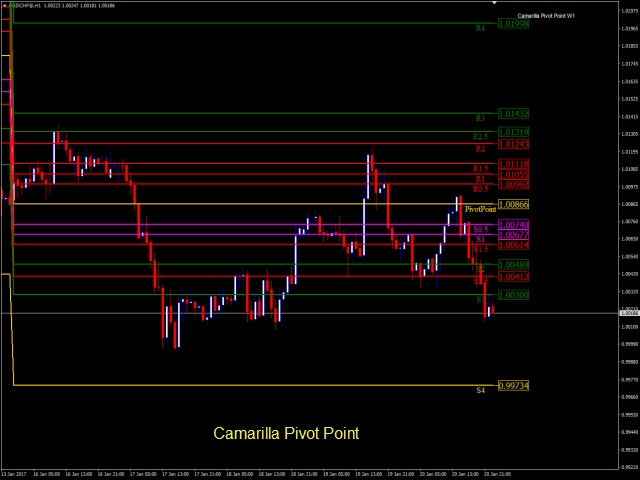
- Camarilla Pivot Points
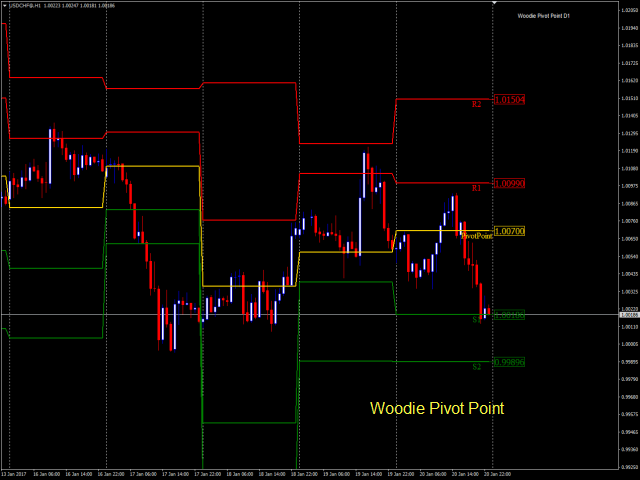
- Woodie's Pivot Points
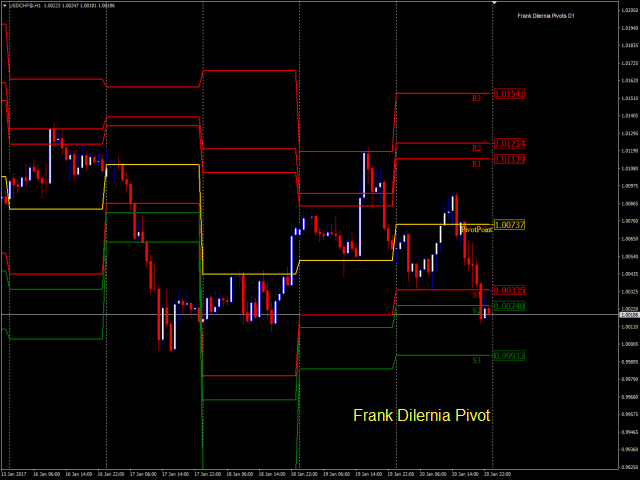
- Frank Dilernia Pivot
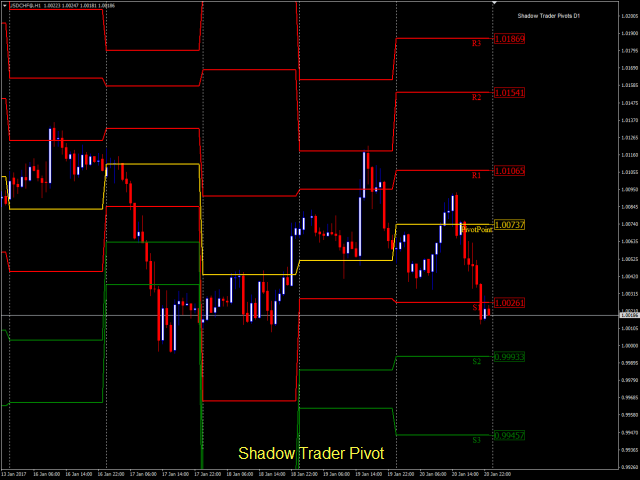
- Shadow Trader Pivot
- The Central Pivot Range
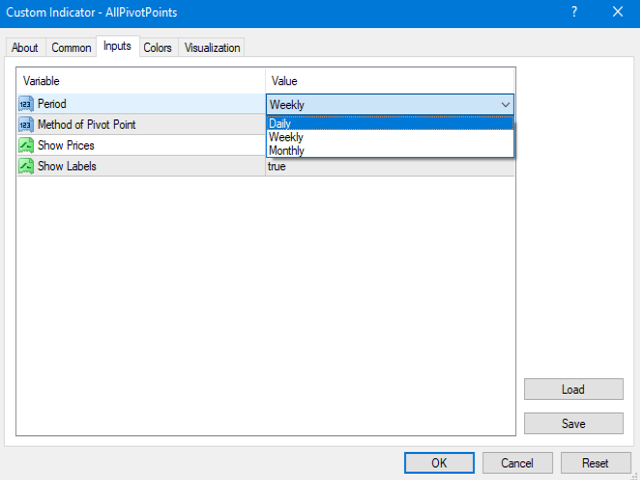
So you can choose from the indicator's inputs which one you want to see in your chart and for which period (Daily, Weekly, Monthly)
Which pivot point method is best?
The truth is, just like all the variations of all the other indicators that you've learned so far, there is no single best method. It really all depends on how you combine your knowledge of pivot points with all the other tools in your Forex trading toolbox.
Just know that most charting software that do automatic calculations normally use the standard method in calculating for the pivot point levels.
But now with this indicator you can see these levels on your own, you can give them all a swing and see which one works best for you. Pivot away!
Indicator parameters
- Period - Choose the period you want (Daily / weekly / Monthly).
- Method of Pivot Point - Choose the method of Pivot point.
- Show Prices - (True / False)
- Show Labels - (True / False)

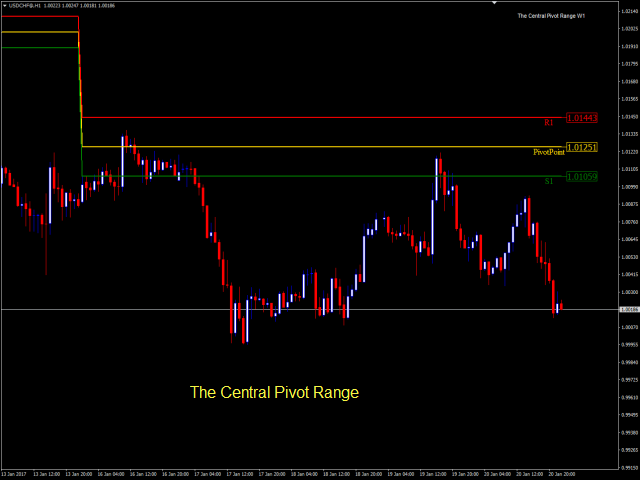

This is the only indicator on the web that can plot weekly and monthly Central Pivot Ranges (CPR) that have predictive power. Also it plots camarilla and fib pivots correctly. A must for any serious trader. A big thank you!!