• Aperçu
  • Avis
  • Commentaires
  • Nouveautés

AIS Correct Averages MT5

L'indicateur AIS Correct Averages vous permet de définir le début d'un mouvement de tendance sur le marché. Une autre qualité importante de l'indicateur est un signal clair de la fin de la tendance. L'indicateur n'est pas redessiné ou recalculé.

Valeurs affichées
h_AE - limite supérieure du canal AE

l_AE - limite inférieure du canal AE

h_EC - Valeur prédite haute pour la barre actuelle

l_EC - Valeur prédite basse pour la barre actuelle

Signaux lors du travail avec l'indicateur
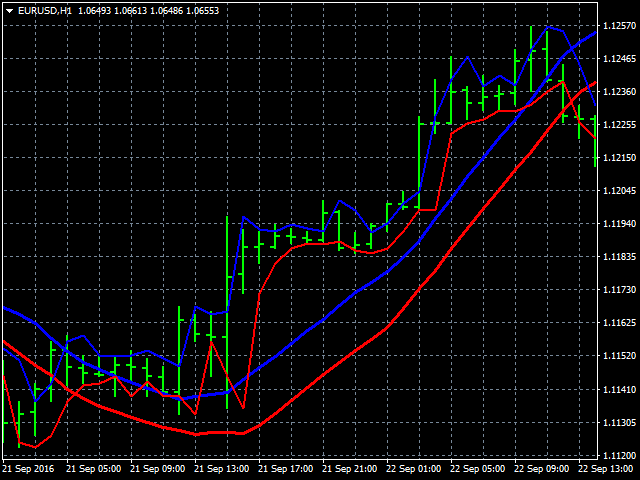
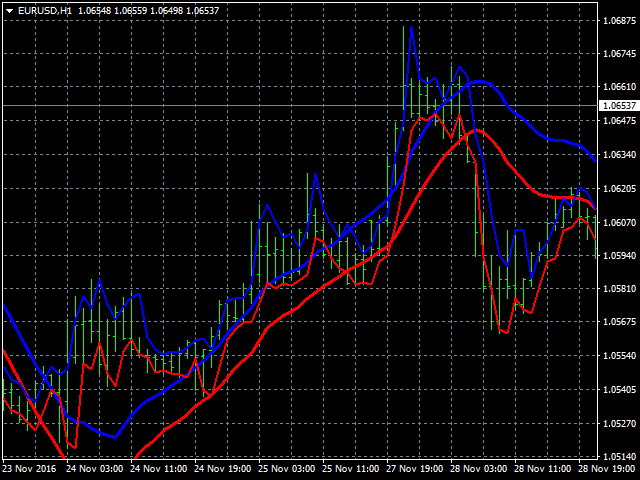
Le signal principal est l'intersection des canaux AE et EC.

Une tendance haussière peut commencer lorsque la ligne l_EC est au-dessus de la ligne h_AE.

Le début d'une tendance baissière peut être attendu après que la ligne h_EC tombe en dessous de la ligne l_AE.

Dans ce cas, il convient de prêter attention à la largeur du canal entre les lignes h_AE et l_AE. Plus la différence entre eux est grande, plus la tendance sera forte. Vous devez également faire attention à la réalisation des hauts / bas locaux par le canal AE. A cette époque, la tendance des variations de prix devient la plus forte.

Paramètres d'indicateur personnalisables
Le réglage de l'indicateur consiste à sélectionner le paramètre LRH en fonction de la plage horaire. La plage de valeurs valides pour ce paramètre est de 1 à 350.

Plus ce paramètre est petit, plus l'indicateur est sensible et l'augmentation des faux signaux est possible. D'autre part, ce paramètre ne doit pas être réglé trop haut, car l'indicateur deviendra moins sensible et sautera des signaux.
Produits recommandés
Was: $249  Now: $99   Market Profile defines a number of day types that can help the trader to determine market behaviour. A key feature is the Value Area, representing the range of price action where 70% of trading took place. Understanding the Value Area can give traders valuable insight into market direction and establish the higher odds trade. It is an excellent addition to any system you may be using. Inspired by Jim Dalton’s book “Mind Over Markets”, this indicator is designed to suit the
Noize Absorption Index - is the manual trading system that measures the difference of pressure between bears forces and bulls forces. Green line - is a noize free index that showing curent situation. Zero value of index shows totally choppy/flat market.Values above zero level shows how powerfull bullish wave is and values below zero measures bearish forces.Up arrow appears on bearish market when it's ready to reverse, dn arrow appears on weak bullish market, as a result of reverse expectation.
Owl Smart Levels MT5
Sergey Ermolov
3.7 (20)
Version MT4   |  FAQ L' indicateur Owl Smart Levels est un système de trading complet au sein d'un seul indicateur qui comprend des outils d'analyse de marché populaires tels que les fractales avancées de Bill Williams , Valable ZigZag qui construit la structure d'onde correcte du marché et les niveaux de Fibonacci qui marquent les niveaux exacts d'entrée. sur le marché et les endroits où prendre des bénéfices. Description détaillée de la stratégie Mode d'emploi de l'indicateur Conseiller-Assis
To get access to MT4 version please click here . - This is the exact conversion from TradingView: "Stochastic Momentum Index" By "UCSgears". - This is a popular version of stochastic oscillator on tradingview. - This is a light-load processing and non-repaint indicator. - Buffers are available for the lines on chart. - You can message in private chat for further changes you need. Thanks for downloading
The Penta-O is a 6-point retracement harmonacci pattern which usually precedes big market movements. Penta-O patterns can expand and repaint quite a bit. To make things easier this indicator implements a twist: it waits for a donchian breakout in the right direction before signaling the trade. The end result is an otherwise repainting indicator with a very reliable trading signal. The donchian breakout period is entered as an input. [ Installation Guide | Update Guide | Troubleshooting | FAQ | A
Improved version of the free HMA Trend indicator (for MetaTrader 4) with statistical analysis. HMA Trend is a trend indicator based on the Hull Moving Average (HMA) with two periods. HMA with a slow period identifies the trend, while HMA with a fast period determines the short-term movements and signals in the trend direction. The main differences from the free version: Ability to predict the probability of a trend reversal using analysis of history data. Plotting statistical charts for analyz
Le niveau Premium est un indicateur unique avec une précision de plus de 80 % des prédictions correctes ! Cet indicateur a été testé par les meilleurs Trading Specialists depuis plus de deux mois ! L'indicateur de l'auteur que vous ne trouverez nulle part ailleurs ! À partir des captures d'écran, vous pouvez constater par vous-même la précision de cet outil ! 1 est idéal pour le trading d'options binaires avec un délai d'expiration de 1 bougie. 2 fonctionne sur toutes les paires de de
The Accumulation / Distribution is an indicator which was essentially designed to measure underlying supply and demand. It accomplishes this by trying to determine whether traders are actually accumulating (buying) or distributing (selling). This indicator should be more accurate than other default MT5 AD indicator for measuring buy/sell pressure by volume, identifying trend change through divergence and calculating Accumulation/Distribution (A/D) level. Application: - Buy/sell pressure: above
An indicator of pattern #31 ("Long Island") from Encyclopedia of Chart Patterns by Thomas N. Bulkowski. The second gap is in the opposite direction. Parameters: Alerts - show alert when an arrow appears   Push - send a push notification when an arrow appears (requires configuration in the terminal) GapSize - minimum gap size in points ArrowType - a symbol from 1 to 17 ArrowVShift - vertical shift of arrows in points   ShowLevels - show levels ColUp - color of an upward line ColDn - color of a
Cumulative delta indicator As most traders believe, the price moves under the pressure of market buying or selling. When someone redeems an offer standing in the cup, the deal is a "buy". If someone pours into the bid standing in the cup - the deal goes with the direction of "sale". The delta is the difference between purchases and sales. A cumulative delta - the difference between the cumulative sum of purchases and sales for a certain period of time. It allows you to see who is currently contr
BoxChart MT5
Evgeny Shevtsov
5 (7)
The market is unfair if only because 10% of participants manage 90% of funds. An ordinary trader has slim changes to stand against these "vultures". This problem can be solved. You just need to be among these 10%, learn to predict their intentions and move with them. Volume is the only preemptive factor that faultlessly works on any timeframe and symbol. First, the volume appears and is accumulated, and only then the price moves. The price moves from one volume to another. Areas of volume accumu
Wapv Price and volume
Eduardo Da Costa Custodio Santos
L'indicateur de prix et de volume WAPV pour MT5 fait partie de l'ensemble d'outils (Wyckoff Academy Wave Market) et (Wyckoff Academy Price and Volume). L'indicateur de prix et de volume WAPV pour MT5 a été créé pour faciliter la visualisation intuitive du mouvement du volume sur le graphique. Avec lui, vous pouvez observer les moments de pic de volume et les moments où le marché n'a aucun intérêt professionnel Identifiez les moments où le marché évolue par inertie et non par mouvement de "smart
Cet indicateur innovant de mesure de la force des devises de INFINITY est une aide indispensable pour les scalpers et les commerçants qui négocient à long terme. Le système d'analyse De la force/faiblesse des devises est connu depuis longtemps et utilisé sur le marché par les principaux traders du monde. Tout commerce d'arbitrage n'est pas complet sans cette analyse. Notre indicateur détermine facilement la force des devises sous-jacentes les unes par rapport aux autres. Il affiche des graphiqu
**   All Symbols   x   All Time frames   scan just by pressing scanner button ** *** Contact me after the purchase to send you instructions and add you in "Order Block group" for sharing or seeing experiences with other users. Introduction: The central banks and financial institutions mainly drive the market,   Order block is considered a market behavior that indicates accumulation of orders from banks and institutions, then   the market tends to make a sharp move(Imbalance) on either side once
Terra Infinity is a flat indicator. This improved version of the CalcFlat indicator has three additional lines that significantly increase its effectiveness. Unlike its predecessor with two static levels, Terra Infinity adds three dynamic lines above the main histogram, which are interpreted as follows: base signal line, minimum signal line, maximum signal line. These lines are formed using the additional parameter Avg, which is the average value of the histogram. Averaging produces a line
This indicator allows you to enjoy the two most popular products for analyzing request volumes and market deals at a favorable price: Actual Depth of Market Chart Actual Tick Footprint Volume Chart This product combines the power of both indicators and is provided as a single file. The functionality of Actual COMBO Depth of Market AND Tick Volume Chart is fully identical to the original indicators. You will enjoy the power of these two products combined into the single super-indicator! Below is
Volality Index Scalper
Lesedi Oliver Seilane
5 (1)
Volality Index scalper indicator  Meant for Volality pairs such as Volality 10, 25, 50, 75 and 100 The indicator works on all timeframes from the 1 minute to the monthly timeframe the indicator is non repaint the indicator has 3 entry settings 1 color change on zero cross 2 color change on slope change 3 color change on signal line cross Orange line is your sell signal Blue line is your buy signal.
Crash 1000 Scalping Indicator for the Crash 1000 Deriv Synthetic Index. Introduction The Crash 1000 Scalping Indicator is a specialized tool designed for the Crash 1000 index on the Deriv Synthetic market. This indicator is particularly useful for scalping on the M1 timeframe, helping traders to identify precise entry and exit points for buy positions. It is designed to be non-repainting, providing clear signals with audible alerts and push notifications, and is compatible with mobile devices th
This indicator is based on the classical indicators: RSI (Relative Strangth Index) and CCI (Commodity Channel Index) and will be helpful for those who love and know how to use not a visual but digital representation of the indicators. The indicator shows values from each timeframe. You will be able to change the main input parameters for each RSI and CCI for every TF. Parameters OverboughtLevel_R = 70; OversoldLevel_R = 30; OverboughtLevel_C = 100; OversoldLevel_C = -100; Example for M1: sTF1 =
No Demand No Supply MT5
Trade The Volume Waves Single Member P.C.
No Demand No Supply   This indicator identifies   No Demand –No Supply candles to your chart and plots volume bars colored according to the signal. It can be applied to all timeframes or to a specific one only. It can also be used as regular volume indicator  with exceptional future of WEIGHTED VOLUME. Furthermore is has an alert notification, sound and email when a signals occurs. The indicator does not repaint but the alert will come on two candles back due to the definition of No Demand No Su
1. What is this         Rising volatility and falling volatility are not the same, whether it is academic research or actual testing has shown this point.         The original ATR indicator is calculated by putting up and down fluctuations together. This indicator is to calculate separately the upward volatility and the downward volatility, which can better help you study the market. 2. Indicator description          There are two modes for the calculation of this indicator, as shown in the f
A new generation progressive indicator from INFINITY. Predictor PRO uses its own entry and exit calculation strategy. Indicator without redrawing signals! This is very important for real trading. The indicator can be used for any currency pairs, metals, cryptocurrencies or indices. The best time of the H1 chart. Unlike other indicators, Predictor PRO shows shows the Buy/Sell entry point and the Close exit point. Calculating the profit of all signals in points on the panel helps to choose th
Alpha Trend Pro
Eslam Mohamed Abdelrady Shehata
Alpha Trend Pro: Your Ultimate Trading Companion Embark on a new era of trading with Alpha Trend Pro Indicator. Crafted with precision and innovation, Alpha Trend is designed to elevate your trading experience by seamlessly blending powerful elements to navigate various market conditions. **Key Features:** **1. Dynamic Adaptability:**    - In sideways market conditions, Alpha Trend acts as a dead indicator. Say goodbye to many false signals and welcome a tool that adapts seamlessly to mar
Unlock key market insights with automated support and resistance lines Special Offer: Purchase now to receive free bonuses worth $89! (Read more for details) Tired of plotting support and resistance lines? This is a multi-timeframe indicator that detects and plots supports and resistance lines in the chart with the same precision as a human eye would. As price levels are tested over time and its importance increases, the lines become thicker and darker, making price leves easy to glance and ev
To get access to MT4 version please click here . This is the exact conversion from TradingView: "[SHK] Schaff Trend Cycle (STC)" by "shayankm". This is a light-load processing indicator. This is a non-repaint indicator. Buffers are available for processing in EAs. All input fields are available. You can message in private chat for further changes you need. Thanks for downloading
US30NinjaMT5
Satyaseelan Shankarananda Moodley
US30 Ninja is a 5 minute scalping indicator that will let know you when there is a trade set up (buy or sell). Once the indicator gives the trade direction, you can open a trade and use a 30 pip stop loss and a 30 pip to 50 pip take profit. Please trade at own own risk. This indicator has been created solely for the US30 market and may not yield positive results on any other pair. 
Nouvel Indicateur Combiné - 3 en 1 Vous cherchez des outils de trading qui peuvent améliorer votre analyse de marché et vos stratégies d'investissement ? Nous avons combiné trois de nos meilleurs indicateurs en une seule solution puissante et pratique, vous permettant de maximiser la valeur de votre trading. 1. Indicateur de Bloc d'Ordre (vendu précédemment à 32,90$) L'Indicateur de Bloc d'Ordre est un outil essentiel pour identifier les zones d'intérêt institutionnel fort sur le marché. Cet ind
An indicator of patterns #24, #25, #26 and #27 ("Head and Shoulders", "Complex Head and Shoulders") from Encyclopedia of Chart Patterns by Thomas N. Bulkowski. Parameters: Alerts - show alert when an arrow appears   Push - send a push notification when an arrow appears (requires configuration in the terminal) PeriodBars - indicator period K - an additional parameter that influences the accuracy of pattern shape recognition. The smaller the value is, the smoother the row of peaks/valleys shoul
The Volumebyprice.com Indicator for MetaTrader 5 features Volume Profile and Market Profile TPO (Time Price Opportunity). Volume and TPO histogram bar and line charts. Volume Footprint charts. TPO letter and block marker collapsed and split structure charts. Static, dynamic and flexible range segmentation and compositing methods with relative and absolute visualizations. Session hours filtering and segment concatenation with Market Watch and custom user specifications. Graphical layering, posit
Market profile was developed by Peter Steidlmayer in the second half of last century. This is a very effective tool if you understand the nature and usage. It's not like common tools like EMA, RSI, MACD or Bollinger Bands. It operates independently of price, not based on price but its core is volume. The volume is normal, as the instrument is sung everywhere. But the special thing here is that the Market Profile represents the volume at each price level. 1. Price Histogram The Price Histogram
Les acheteurs de ce produit ont également acheté
Atomic Analyst MT5
Issam Kassas
4.5 (16)
Tout d'abord, il convient de souligner que cet indicateur de trading n'est ni repainting, ni redrawing et ne présente aucun délai, ce qui le rend idéal à la fois pour le trading manuel et automatisé. Manuel de l'utilisateur : réglages, entrées et stratégie. L'Analyste Atomique est un indicateur d'action sur les prix PA qui utilise la force et le momentum du prix pour trouver un meilleur avantage sur le marché. Équipé de filtres avancés qui aident à éliminer les bruits et les faux signaux, et à
Atbot
Zaha Feiz
4.97 (31)
AtBot : Comment ça fonctionne et comment l'utiliser ### Comment ça fonctionne L'indicateur "AtBot" pour la plateforme MT5 génère des signaux d'achat et de vente en utilisant une combinaison d'outils d'analyse technique. Il intègre la Moyenne Mobile Simple (SMA), la Moyenne Mobile Exponentielle (EMA) et l'indice de la Plage Vraie Moyenne (ATR) pour identifier les opportunités de trading. De plus, il peut utiliser des bougies Heikin Ashi pour améliorer la précision des signaux. Laissez un avis ap
Tout d'abord, il convient de souligner que ce système de trading est un indicateur non repeint, non redessiné et non retardé, ce qui le rend idéal pour le trading manuel et automatisé. Cours en ligne, manuel et téléchargement de préréglages. Le "Système de Trading Smart Trend MT5" est une solution de trading complète conçue pour les traders débutants et expérimentés. Il combine plus de 10 indicateurs premium et propose plus de 7 stratégies de trading robustes, ce qui en fait un choix polyvalent
TPSpro RFI Levels MT5
Roman Podpora
4.63 (8)
Reversal First Impulse levels (RFI)      INSTRUCTIONS        RUS       -       ENG              R ecommended to use with an indicator   -   TPSpro  TREND PRO -  Version MT4                 A key element in trading is zones or levels from which decisions to buy or sell a trading instrument are made. Despite attempts by major players to conceal their presence in the market, they inevitably leave traces. Our task was to learn how to identify these traces and interpret them correctly. Main functi
TPSproTREND PrO MT5
Roman Podpora
4.89 (9)
TPSpro TREND PRO  - is a trend indicator that automatically analyzes the market and provides information about the trend and each of its changes, as well as giving signals for entering trades without redrawing! The indicator uses each candle, analyzing them separately. referring to different impulses - up or down impulse. Exact entry points into transactions for currencies, crypto, metals, stocks, indices!  Version MT4               DETAILED DESCRIPTION               R ecommended to use with an
Quantum Trend Sniper
Bogdan Ion Puscasu
4.91 (44)
Présentation       Quantum Trend Sniper Indicator   , l'indicateur révolutionnaire MQL5 qui transforme la façon dont vous identifiez et négociez les inversions de tendance ! Développé par une équipe de traders expérimentés avec une expérience commerciale de plus de 13 ans,       Indicateur Quantum Trend Sniper       est conçu pour propulser votre parcours de trading vers de nouveaux sommets grâce à sa manière innovante d'identifier les inversions de tendance avec une précision extrêmement élevée
Gold Stuff mt5
Vasiliy Strukov
4.9 (125)
Gold Stuff mt5 est un indicateur de tendance conçu spécifiquement pour l'or et peut également être utilisé sur n'importe quel instrument financier. L'indicateur ne se redessine pas et ne traîne pas. Délai recommandé H1. Contactez-moi immédiatement après l'achat pour obtenir les réglages et un bonus personnel !   Vous pouvez obtenir une copie gratuite de notre indicateur Strong Support et Trend Scanner, veuillez envoyer un message privé. moi!   RÉGLAGES Dessiner la flèche - on off. dessine
Top indicator for MT5   providing accurate signals to enter a trade without repainting! It can be applied to any financial assets:   forex, cryptocurrencies, metals, stocks, indices .  Watch  the video  (6:22) with an example of processing only one signal that paid off the indicator! MT4 version is here It will provide pretty accurate trading signals and tell you when it's best to open a trade and close it. Most traders improve their trading results during the first trading week with the help of
FX Power MT5 NG
Daniel Stein
5 (4)
Obtenez votre mise à jour quotidienne du marché avec des détails et des captures d'écran via notre Morning Briefing ici sur mql5 et sur Telegram ! FX Power MT5 NG est la nouvelle génération de notre très populaire indicateur de force des devises, FX Power. Et qu'est-ce que ce compteur de force de nouvelle génération offre ? Tout ce que vous avez aimé de l'original FX Power PLUS Analyse de la force de l'OR/XAU Des résultats de calcul encore plus précis Périodes d'analyse configurables individuel
Trend Screener Pro MT5
STE S.S.COMPANY
4.86 (56)
Indicateur de tendance, solution unique révolutionnaire pour le trading et le filtrage des tendances avec toutes les fonctionnalités de tendance importantes intégrées dans un seul outil ! Il s'agit d'un indicateur multi-période et multi-devises 100 % non repeint qui peut être utilisé sur tous les symboles/instruments : forex, matières premières, crypto-monnaies, indices et actions. Trend Screener est un indicateur de suivi de tendance efficace qui fournit des signaux de tendance fléchés avec des
Tout d'abord, il convient de souligner que cet outil de trading est un indicateur non repeint, non redessiné et non retardé, ce qui le rend idéal pour le trading professionnel. Cours en ligne, manuel utilisateur et démonstration. L'indicateur Smart Price Action Concepts est un outil très puissant à la fois pour les nouveaux et les traders expérimentés. Il regroupe plus de 20 indicateurs utiles en un seul, combinant des idées de trading avancées telles que l'analyse du trader Inner Circle et
FX Volume MT5
Daniel Stein
5 (12)
Obtenez votre mise à jour quotidienne du marché avec des détails et des captures d'écran via notre Morning Briefing ici sur mql5 et sur Telegram ! FX Volume est le PREMIER et SEUL indicateur de volume qui fournit un VRAI aperçu du sentiment du marché du point de vue d'un courtier. Il fournit des informations impressionnantes sur la façon dont les acteurs institutionnels du marché, comme les courtiers, sont positionnés sur le marché des changes, bien plus rapidement que les rapports COT. Voir c
IX Power MT5
Daniel Stein
4 (5)
IX Power   apporte enfin la précision imbattable de FX Power aux symboles non-Forex. Il détermine avec précision l'intensité des tendances à court, moyen et long terme de vos indices, actions, matières premières, ETF et même crypto-monnaies préférés. Vous pouvez   analyser tout ce que   votre terminal a à offrir. Essayez-le et découvrez comment   votre timing s'améliore considérablement   lors de vos transactions. Caractéristiques principales d'IX Power Résultats de calcul précis à 100 %,
TrendMaestro5
Stefano Frisetti
note: this indicator is for METATRADER4, if you want the version for METATRADER5 this is the link:  https://www.mql5.com/it/market/product/108106 TRENDMAESTRO ver 2.4 TRENDMAESTRO recognizes a new TREND in the bud, he never makes mistakes. The certainty of identifying a new TREND is priceless. DESCRIPTION TRENDMAESTRO identifies a new TREND in the bud, this indicator examines the volatility, volumes and momentum to identify the moment in which there is an explosion of one or more of these data a
Easy By Sell is a market indicator for opening and closing positions. It becomes easy to track market entries with alerts. It indicates trend reversal points when a price reaches extreme values ​​and the most favorable time to enter the market. it is as effective as a Fibonacci to find a level but it uses different tools such as an algorithm based on ATR indicators and Stochastic Oscillator. You can modify these two parameters as you wish to adapt the settings to the desired period. My othe
Maintenant 147 $ (augmentant à 499 $ après quelques mises à jour) - Comptes illimités (PCS ou Mac) Manuel d'utilisation RelicusRoad + Vidéos de formation + Accès au groupe Discord privé + Statut VIP UNE NOUVELLE FAÇON DE REGARDER LE MARCHÉ RelicusRoad est l'indicateur de trading le plus puissant au monde pour le forex, les contrats à terme, les crypto-monnaies, les actions et les indices, offrant aux traders toutes les informations et tous les outils dont ils ont besoin pour rester renta
Trend Hunter MT5
Andrey Tatarinov
5 (1)
Trend Hunter est un indicateur de tendance pour travailler sur les marchés du Forex, des cryptomonnaies et des CFD. Une particularité de l'indicateur est qu'il suit la tendance avec confiance, sans changer le signal lorsque le prix dépasse légèrement la ligne de tendance. L'indicateur n'est pas redessiné; un signal d'entrée sur le marché apparaît après la fermeture de la barre. Lorsque vous suivez une tendance, l'indicateur affiche des points d'entrée supplémentaires dans la direction de la t
ATREND ATREND : Comment ça fonctionne et comment l'utiliser Comment ça fonctionne L'indicateur "ATREND" pour la plateforme MT5 est conçu pour fournir aux traders des signaux d'achat et de vente robustes en utilisant une combinaison de méthodologies d'analyse technique. Cet indicateur s'appuie principalement sur la plage vraie moyenne (ATR) pour mesurer la volatilité, ainsi que sur des algorithmes de détection de tendance pour identifier les mouvements potentiels du marché. Laissez un message ap
Golden Spikes Premium
Kwaku Bondzie Ghartey
Golden Spikes Detector Acknowledgement and Dedications:  The name of this indicator was Inspired by an Original; Mr Grant Koopman; a Knowledgeable and experienced Synthetics trader. I dedicate this indicator to Mr Grant.  Overview: The Golden Spikes Premium is a groundbreaking trading indicator meticulously crafted for the Boom and Crash indices on the Deriv market. Tailored to meet the needs of discerning traders, this powerful tool operates exclusively on the one-minute timeframe, providin
Le profit de la structure du marché change à mesure que le prix s'inverse et recule. L'indicateur d'alerte d'inversion de la structure du marché identifie le moment où une tendance ou un mouvement de prix approche de l'épuisement et est prêt à s'inverser. Il vous avertit des changements dans la structure du marché qui se produisent généralement lorsqu'un renversement ou un recul majeur est sur le point de se produire. L'indicateur identifie initialement les cassures et la dynamique des prix,
The Smart Liquidity Profile is color-coded based on the importance of the traded activity at specific price levels, allowing traders to identify significant price levels such as support and resistance levels, supply and demand zones, liquidity gaps, consolidation zones, Buy-Side/Sell-Side Liquidity and so on.  Smart Liquidity Profile allows users to choose from a number of different time periods including 'Auto,' 'Fixed Range,' 'Swing High,' 'Swing Low,' 'Session,' 'Day,' 'Week,' 'Month,' 'Quart
Vous recherchez un puissant indicateur de trading forex qui peut vous aider à identifier facilement des opportunités de trading rentables ? Ne cherchez pas plus loin que le Beast Super Signal. Cet indicateur basé sur les tendances facile à utiliser surveille en permanence les conditions du marché, en recherchant de nouvelles tendances en développement ou en sautant sur celles existantes. Le Beast Super Signal donne un signal d'achat ou de vente lorsque toutes les stratégies internes s'alignent
Volatility Trend System - est un système commercial qui fournit des signaux pour les entrées. Le système de volatilité donne des signaux linéaires et ponctuels dans le sens de la tendance, ainsi que des signaux pour en sortir, sans redessin ni délai. L'indicateur de tendance surveille la direction de la tendance à moyen terme, montre la direction et son changement. L'indicateur de signal est basé sur les changements de volatilité et montre les entrées sur le marché. L'indicateur est équipé
Ce tableau de bord affiche les derniers   modèles harmoniques   disponibles pour les symboles sélectionnés, ce qui vous permettra de gagner du temps et d'être plus efficace /   version MT4 . Indicateur gratuit:   Basic Harmonic Pattern Colonnes de l'indicateur Symbol :   les symboles sélectionnés apparaissent Trend   :   haussière ou baissière Pattern :   type de motif (gartley, papillon, chauve-souris, crabe, requin, cypher ou ABCD) Entry:   prix d'entrée SL:   prix du stop loss TP1:   1
Advanced Supply Demand MT5
Bernhard Schweigert
4.46 (13)
La meilleure solution pour tout commerçant débutant ou expert ! Cet indicateur est un outil de trading unique, de haute qualité et abordable car nous avons intégré un certain nombre de fonctionnalités propriétaires et une nouvelle formule. Avec cette mise à jour, vous pourrez afficher des zones à double horaire. Vous pourrez non seulement afficher un TF plus élevé, mais afficher les deux, le graphique TF, PLUS le TF supérieur : AFFICHAGE DES ZONES NICHÉES. Tous les traders Supply Demand vont ado
ICT, SMC, SMART MONEY CONCEPTS, SMART MONEY, Smart Money Concept, Support and Resistance, Trend Analysis, Price Action, Market Structure, Order Blocks, BOS/CHoCH,   Breaker Blocks ,  Momentum Shift,   Supply&Demand Zone/Order Blocks , Strong Imbalance,   HH/LL/HL/LH,    Fair Value Gap, FVG,  Premium  &   Discount   Zones, Fibonacci Retracement, OTE, Buy Side Liquidity, Sell Side Liquidity, BSL/SSL Taken, Equal Highs & Lows, MTF Dashboard, Multiple Time Frame, BigBar, HTF OB, HTF Market Structure
Matrix Arrow Indicator MT5
Juvenille Emperor Limited
5 (10)
Matrix Arrow Indicator MT5   est une tendance unique 10 en 1 suivant un indicateur multi-période   100% non repeint   qui peut être utilisé sur tous les symboles/instruments:   forex ,   matières premières ,   crypto-monnaies ,   indices ,  actions .  Matrix Arrow Indicator MT5  déterminera la tendance actuelle à ses débuts, en rassemblant des informations et des données à partir d'un maximum de 10 indicateurs standard, qui sont: Indice de mouvement directionnel moyen (ADX) Indice de canal de m
Gartley Hunter Multi
Siarhei Vashchylka
5 (8)
Gartley Hunter Multi - An indicator for searching for harmonic patterns simultaneously on dozens of trading instruments and on all possible timeframes. Manual (Be sure to read before purchasing) | Version for MT4 Advantages 1. Patterns: Gartley, Butterfly, Shark, Crab. Bat, Alternate Bat, Deep Crab, Cypher 2. Simultaneous search for patterns on dozens of trading instruments and on all possible timeframes 3. Search for patterns of all possible sizes. From the smallest to the largest 4. A
XQ Indicator MetaTrader 5
Marzena Maria Szmit
2 (1)
Step into the realm of Forex trading with confidence and precision using XQ, a cutting-edge Forex indicator designed to elevate your trading game to unprecedented heights. Whether you're a seasoned trader or just stepping into the world of currency exchange, XQ Forex Indicator empowers you with the insights and signals needed to make informed trading decisions. The signal conditions are a combination of three indicators, and XQ Forex Indicator only display  medium and long-term trends . The ind
Order Block Hunter MT5
Noha Mohamed Fathy Younes Badr
Order block hunter indicator is the best indicator for  hunt the order blocks that area where there has been a large concentration of limit orders waiting to be executed Order blocks are identified on a chart by observing previous price action and looking for areas where the price experienced significant movement or sudden changes in direction .This indicator does that for you by using very complicated codes and helps you to take the best areas To buy and sell because it make marks at the best a
Plus de l'auteur
Choosing the levels of StopLoss and TakeProfit can have a very strong impact on the overall performance of trading. In addition to the obvious parameters of a trade transaction - the size of a possible win or probable loss - the levels of StopLoss and TakeProfit also affect the expected duration of the transaction, and the profitability of trading in general. If you have already determined the optimal transaction duration using the “ AIS-ODT ” script, then you can begin to determine the paramete
FREE
MinDeposit MT5
Aleksej Poljakov
3 (1)
The script analyzes the history of quotes and gives recommendations on the minimum deposit. The calculations take into account the variability of prices and the standard deviation. Margin requirements for the instrument are also taken into account. The result of the script is the minimum recommended deposit for trading the given currency pair.
FREE
The script is based on the simulation of trade transactions using a random number generator. This allows you to get completely different results, even with the same input parameters. When you run the script, a dialog box opens in which you can set the desired values ​​for external variables. In the  Trading options  block, the basic parameters that are necessary for trading modeling are defined. Start Balance  - sets the initial size of the trade balance. Number Trade  - sets the number of trad
FREE
This script is designed so that the trader can determine the average duration of trade transactions, at which the ratio of possible profits and losses will be optimal. First, let's look at the general approach to determining the optimal duration of trade transactions. We introduce the following variables: R   - the result of the transaction; T   - the time during which the transaction was open; W  - the time between the closing of the previous transaction and the opening of the next one. Every t
FREE
The script is based on the simulation of trade transactions using a random number generator. This allows you to get completely different results, even with the same input parameters. When you run the script, a dialog box opens in which you can set the desired values ​​for external variables. In the Trading options block, the basic parameters that are necessary for trading modeling are defined. Start Balance - sets the initial size of the trade balance. Number Trade - sets the number of trade tr
FREE
This script allows selecting the TakeProfit and StopLoss levels. It analyzes the history data, and then calculates the probability of reaching a given price level. How the script works Suppose you have a trading strategy and you want to select the TakeProfit and StopLoss levels. Run the script and set the parameter: Number of Bars - the average position holding time in bars. Once the script operation is complete, the AIS-PPL.csv file will be created in the Files folder in the terminal data cat
FREE
Choosing the levels of StopLoss and TakeProfit can have a very strong impact on the overall performance of trading. In addition to the obvious parameters of a trade transaction - the size of a possible win or probable loss - the levels of StopLoss and TakeProfit also affect the expected duration of the transaction, and the profitability of trading in general. If you have already determined the optimal transaction duration using the “ AIS-ODT ” script, then you can begin to determine the paramete
FREE
This script allows selecting the TakeProfit and StopLoss levels. It analyzes the history data, and then calculates the probability of reaching a given price level. How the script works Suppose you have a trading strategy and you want to select the TakeProfit and StopLoss levels. Run the script and set the parameter: Number of Bars - the average position holding time in bars. Once the script operation is complete, the AIS-PPL.csv file will be created in the Files folder in the terminal data cat
FREE
MinDeposit
Aleksej Poljakov
5 (1)
The script analyzes the history of quotes and gives recommendations on the minimum deposit. The calculations take into account the variability of prices and the standard deviation. Margin requirements for the instrument are also taken into account. The result of the script is the minimum recommended deposit for trading the given currency pair.
FREE
The script allows selecting the required 'Filter level' value of the AIS-MTF indicator. Run the script on the required chart and selected timeframe. Once its operation is complete, the HPS.csv file will be created in the Files folder. Open the file. You will see three columns. The 'Filter lvl' column represents the value of the 'Filter level' for the AIS-MTF indicator. Am. dev. - degree and direction of the indicator's deviation from the price level (sorted in ascending order). Negative values i
FREE
This script is designed so that the trader can determine the average duration of trade transactions, at which the ratio of possible profits and losses will be optimal. First, let's look at the general approach to determining the optimal duration of trade transactions. We introduce the following variables: R   - the result of the transaction; T   - the time during which the transaction was open; W - the time between the closing of the previous transaction and the opening of the next one. Every tr
FREE
L'indicateur AIS Correct Averages vous permet de définir le début d'un mouvement de tendance sur le marché. Une autre qualité importante de l'indicateur est un signal clair de la fin de la tendance. L'indicateur n'est pas redessiné ou recalculé. Valeurs affichées h_AE - limite supérieure du canal AE l_AE - limite inférieure du canal AE h_EC - Valeur prédite haute pour la barre actuelle l_EC - Valeur prédite basse pour la barre actuelle Signaux lors du travail avec l'indicateur Le sign
L'indicateur de moyenne mobile pondérée AIS calcule une moyenne mobile pondérée et vous permet de déterminer le début d'un mouvement de tendance du marché. Les coefficients de pondération sont calculés en tenant compte des spécificités de chaque barre. Cela vous permet de filtrer les mouvements aléatoires du marché. Le principal signal confirmant le début d'une tendance est un changement de direction des lignes indicatrices et du prix traversant les lignes indicatrices. WH (ligne bleue) e
L'indicateur AIS Advanced Grade Feasibility est conçu pour prédire les niveaux que le prix pourrait atteindre à l'avenir. Son travail consiste à analyser les trois dernières barres et à établir une prévision basée sur cela. L'indicateur peut être utilisé sur n'importe quelle période et n'importe quelle paire de devises. À l'aide des paramètres, vous pouvez obtenir la qualité de prévision souhaitée. Profondeur de prévision - définit la profondeur de prévision souhaitée en barres. Il est recomm
The indicator is designed to measure the price volatility. This allows determining the moments for opening or closing trade positions more accurately. High intensity of the market indicates the instability of its movement, but allows for better results. And, conversely, low intensity of the market indicates the stability of its movement. Parameters Bars to process - the number of bars to measure the price movements. A low value of this parameter allows determining the moments of rapid price mo
This indicator uses the Fibonacci p-numbers to smooth a price series. This allows combining the advantages of the simple and exponential moving averages. The smoothing coefficients depend on the level of the p-number, which is set in the indicator parameters. The higher the level, the greater the influence of the simple moving average and the less significant the exponential moving average. Parameters Fibonacci Numbers Order - order of the Fibonacci p-number, specified by trader. Valid values
The indicator is based on the analysis of interaction of two filters. The first filter is the popular Moving Average. It helps to identify linear price movements and to smooth minor price fluctuations. The second filter is the Sliding Median. It is a non-linear filter. It allows to filter out noise and single spikes in the price movement. A predictive filter implemented in this indicator is based on the difference between these filters. The indicator is trained during operation and is therefore
This indicator studies the price action as a combination of micro-trends. All micro-trends are analyzed and averaged. Price movement is filtered based on this averaging. IP_High and IP_Low (blue and red dashed lines) show the instantaneous price movement. They display the forecast only for the current price values, taking into account only the number of bars defined by the 'Filter level' parameter. SP_High and SP_Low (blue and red solid lines) smooth the price movements with respect to history.
Cet indicateur met en œuvre un processus de lissage linéaire simple. L'un des inconvénients du lissage exponentiel est la décroissance rapide du signal. Il est donc impossible de suivre pleinement les tendances à long terme de la fourchette de prix. Le lissage linéaire vous permet de régler plus précisément et plus finement le filtrage du signal. L'indicateur est configuré en sélectionnant les paramètres : LP - ce paramètre vous permet de sélectionner la période de lissage. Plus sa valeur
Этот индикатор представляет гибридный фильтр основанный на совместном использовании медианы и скользящей средней. Использование медианы позволяет отфильтровывать аномальные выбросы и случайные импульсы в значениях ценового ряда. При этом на трендовую составляющую медианный фильтр не действует, оставляя ее без изменений. Так как медианный фильтр является нелинейным, то для сглаживания его значений используется скользящая средняя. Такой подход позволяет более точно выделять не только тренд, но и п
This indicator is a combination of two modified Lanczos filters. The first filter serves to extrapolate the price. Based on past values, he predicts a possible price movement within the current bar. That is, it shows what the price would be if the past trends remained unchanged. The second filter for smoothing and averaging prices within the window, determined by the level of the filter. Thanks to the selection of weights, this filter is most actively responding to the periodic component that is
Let's look at the nature of price changes in the Forex market, not paying attention to the reasons why these changes occur. This approach will allow us to identify the main factors affecting the price movement. For example, let's take the opening prices of bars on the EUR-USD currency pair and the H1 timeframe. For these prices, we construct the Lameray diagram (Figure 1). In this diagram, it can be seen that the price movement basically occurs according to a linear equation. To determine the pa
This indicator is more informative. His work is based on the assumption that the price movement in the market can be represented as noise of a particular color, which depends on the parameters of the distribution of price values. Thanks to this, it is possible to analyze the price change from different angles, and considering the price movement as noise of a particular color, one can get information about the current state of affairs in the market and make a forecast about the price behavior. W
Despite some drawbacks of the “ AIS Color Noise Filter ” indicator, the idea to use it to smooth the price series and forecast prices looks quite attractive. This is due to several reasons: first, taking into account several noise components allows building a forecast on factors independent of each other, which can improve the quality of forecasting; secondly, the noise characteristics of the price series behave quite stably throughout the entire history, which makes it possible to obtain stabl
Very often, in the study of financial series apply their smoothing. Using smoothing, you can remove high-frequency components - it is believed that they are caused by random factors and therefore irrelevant. Smoothing always includes some way of averaging the data, in which random changes in the time series mutually absorb each other. Most often, for this purpose, simple or weighted moving average methods are used, as well as exponential smoothing. Each of these methods has its advantages and d
In order to isolate long-term and non-random components, it is necessary to know not only how much the price has changed, but also how these changes occurred. In other words - we are interested not only in the values ​​of price levels, but also in the order in which these levels replace each other. Through this approach, one can find long-term and stable factors that influence (or may influence) the price change at a given point in time. And knowledge of these factors allows you to make a more
One of the powerful methods of analysis is the modeling of financial series using Levy processes. The main advantage of these processes is that they can be used to model a huge number of phenomena - from the simplest to the most complex. Suffice it to say that the idea of ​​the fractal price movement in the market is only a special case of Levy processes. On the other hand, with proper selection of parameters, any Levy process can be represented as a simple moving average. Figure 1 shows an exa
Very often, the trader is faced with the task of determining the extent to which the price may change in the near future. For this purpose, you can use the Johnson distribution type SB. The main advantage of this distribution is that it can be used even with a small amount of accumulated data. The empirical approach used in determining the parameters of this distribution, allows you to accurately determine the maximum and minimum levels of the price channel. These values ​​can be used in differ
This indicator allows you to determine the likelihood that the price will reach one or another level. Its algorithm is quite simple and is based on the use of statistical data on the price levels of a particular currency pair. Thanks to the collected historical data, it is possible to determine the extent to which the price will change during the current bar. Despite its simplicity, this indicator can provide invaluable assistance in trading. So, with its help it is possible to determine TakePr
Stable distributions can be used to smooth financial series. Since a fairly deep history can be used to calculate the distribution parameters, such smoothing may in some cases be even more effective than other methods. The figure shows an example of the distribution of the opening prices of the currency pair " EUR-USD " on the time frame H1 for ten years (figure 1). Looks fascinating, doesn't it? The main idea behind this indicator is to determine the parameters of a stable distribution bas
Filtrer:
Aucun avis
Répondre à l'avis
Version 3.0 2022.07.01
Calculs optimisés.