DSS Divergence Trader
- Indicateurs
- Stephen Reynolds
- Version: 1.1
- Mise à jour: 21 juillet 2017
- Activations: 20
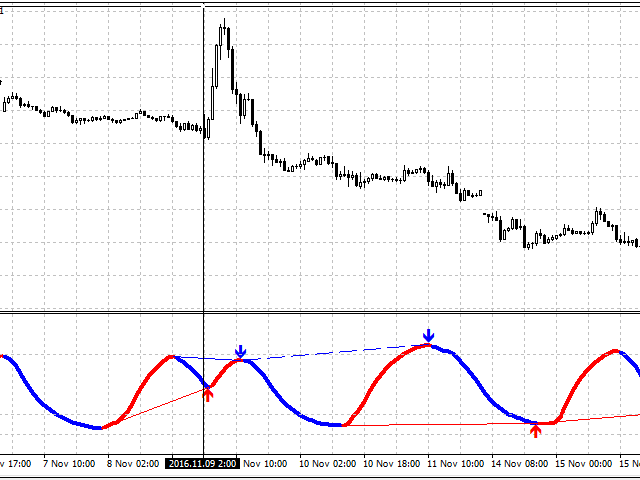
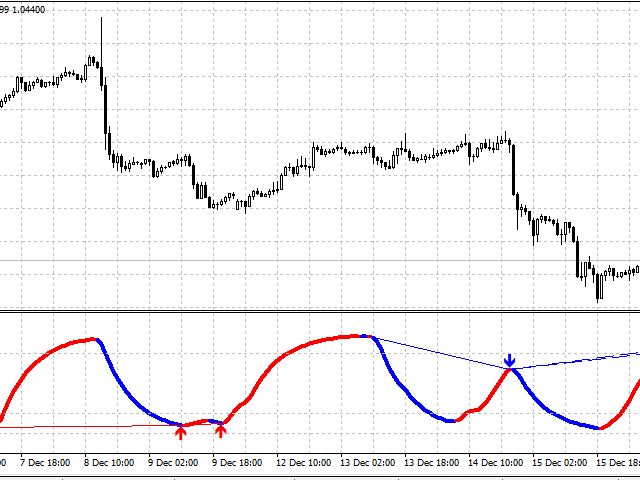
Convergence is when the higher highs and higher lows of an uptrend are also confirmed by our indicator making lower lows which helps us confirm that momentum is increasing and so the trend is likely to continue. Vice versa for a downtrend.
Divergence is when we get higher highs on an uptrend but which are not supported by our indicator which makes lower highs and therefore signals the underlying momentum is failing and so a reversal might occur. Vice versa for downtrend.
I have combined these methods of trading with a Double Smoothed Stochastic. This is similar to Stochastic except for this Indicator we use what is called double exponentially smoothing.
This will give the trader a more speedy response to price changes which tends to smooth out the erratic movements of a regular Stochastic. When combined with spotting Divergence and Convergence signals we get our DSS Divergence Convergence Indicator.
Features :
- Customizable so the user can input the required size of chart.
- Can change the color of the chart, arrows and lines.
- Has choices of which alarms we want to use.
- Can be traded on any market and timeframe. (I tend to see more accurate signals on larger timeframes such as the 1hr chart)
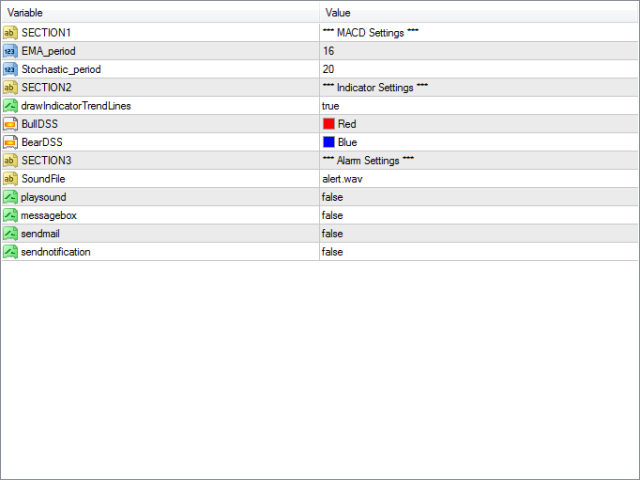
Settings :
MACD Settings
- EMA Period - EMA settings for smaller chart
- Stochastic Period - Stochastic settings for smaller chart
Indicator Settings
- Indicator Trend Lines - if true we see the trend lines, if false we don't see the trendlines.
- Bull DSS Line Color - Sets color of bull DSS
- Bear DSS Line Color - Sets color of bear DSS
Alert Settings
- SoundFile - Sets the wave file used contained within folder program files > mt4 > sounds
- PlaySound - true means we here our PC alarm, false means we don't hear our PC alarm.
- MessageBox - true means we see a message box, false means we don't see a message box
- SendeMail - true means we get an alert sent to our email, false means we don't get an alert sent to our email.
- SendMobile - true means we get an alert sent to our mobile device, false means we don't get an alarm sent to out mobile device.