• Aperçu
  • Avis
  • Commentaires (1)
  • Nouveautés

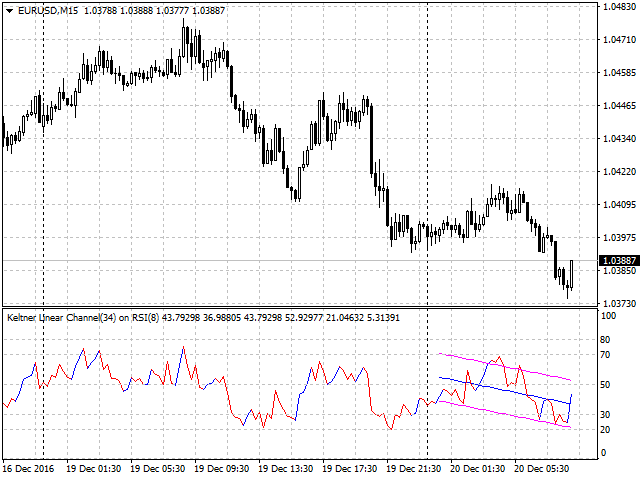
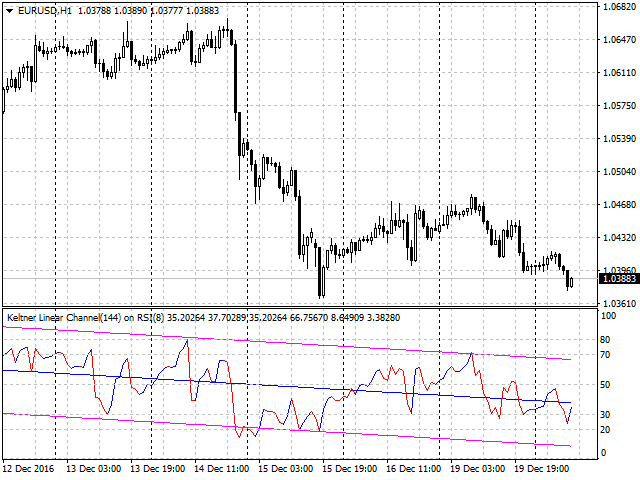
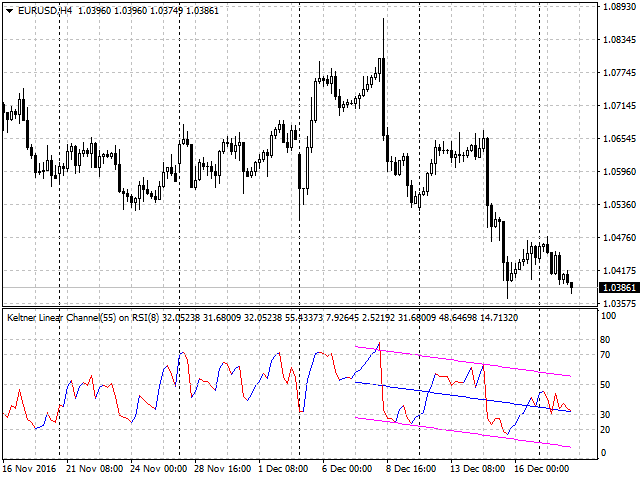
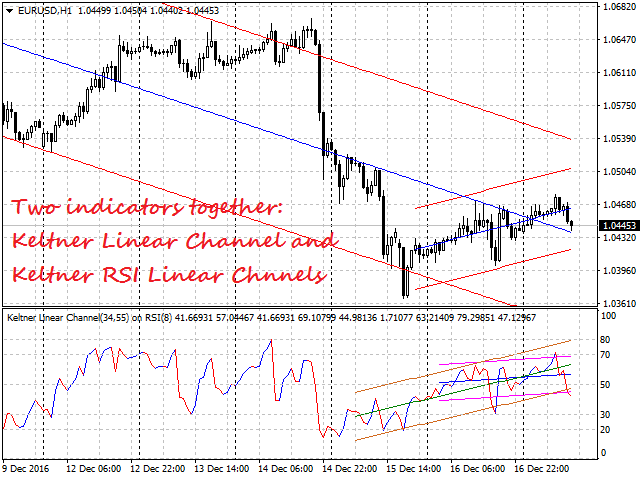
Keltner RSI Linear Channels

This is a color indicator of linear channel for RSI.

The indicator and its calculations are based on Keltner's methodology. It is used for making trading decisions and analyzing market sentiment.

Input parameters allow the user to customize the channel/channels.

The indicator allows drawing two channels on a single chart of the RSI indicator.

Possible options for channel drawing are shown in the screenshots.


Purpose

The indicator can be used for manual or automated trading within an Expert Advisor. Values of indicator buffer of the double type can be used for automated trading:

  1. The RSI indicator line - buffer 0.
  2. The middle line of the first channel - buffer 1.
  3. The line of the bullish RSI sentiment - buffer 2.
  4. The line of the bearish RSI sentiment - buffer 3.
  5. The upper border line of the first channel - buffer 4.
  6. The bottom border line of the first channel - buffer 5.
  7. The middle line of the second channel - buffer 7.
  8. The upper border line of the second channel - buffer 8.
  9. The bottom border line of the second channel - buffer 9.

The values of the indicator buffers connected with linear channels must not be equal to zero.

The values of the indicator buffers connected with the RSI indicator must not be equal to EMPTY_VALUE.


Input Parameters

  1. Two Channels - drawing two channels:
    • true - yes.
    • false - no.
  2. Colored Basic Indicator - coloring of the bullish and bearish sentiment of RSI:
    • true - yes.
    • false - no.
  3. Bars Number - the number of bars for the calculation of the first channel.
  4. Bars Number 2 - the number of bars for the calculation of the second channel.
  5. Calculation Method - channel calculation method:
    • Keltner_Basic - basic (Keltner).
    • Kelner_Improved - improved (Keltner).
    • Custom - using the following parameters.
  6. Channel Width Factor 1
  7. Channel Width Factor 2
  8. Custom ATR Period
  9. RSI Period
  10. MA Method - MA averaging method.
  11. Applied Price - price used for calculation.
  12. Shift - shift of the indicator in relation to the price chart.
Produits recommandés
VR Cub
Vladimir Pastushak
VR Cub est un indicateur permettant d'obtenir des points d'entrée de haute qualité. L'indicateur a été développé pour faciliter les calculs mathématiques et simplifier la recherche de points d'entrée dans un poste. La stratégie de trading pour laquelle l'indicateur a été rédigé prouve son efficacité depuis de nombreuses années. La simplicité de la stratégie de trading est son grand avantage, qui permet même aux traders débutants de négocier avec succès avec elle. VR Cub calcule les points d'ouve
The PUA MultiType Pivot indicator is built on the daily chart of the previous day. The PUA MultiType Pivot indicator is one of the most popular tools in technical analysis, used by traders to identify potential reversal points in financial markets. This indicator constructs three types of Pivot points: Classic, Fibonacci, and Camarilla, each offering its unique approach to market analysis. The advantages of this indicator include: Simplicity and Clarity PUA MultiType Pivot provides clearly defi
Instantaneous cycle identifier
Mahmoud Helmy Sedik Mohamed Mansour
This is first public release of detector code entitled "Enhanced Instantaneous Cycle Period" for PSv4.0 I built many months ago. Be forewarned, this is not an indicator, this is a detector to be used by ADVANCED developers to build futuristic indicators in Pine. The origins of this script come from a document by   Dr   . John   Ehlers   entitled "SIGNAL ANALYSIS CONCEPTS". You may find this using the NSA's reverse search engine "goggles", as I call it. John Ehlers' MESA used this measurement to
RenkoMaStoch
Sergey Deev
1 (1)
The indicator displays renko bars on a chart, uses them to plot the fast and slow moving average and Stochastic, as well as it provides buy/sell signals: a buy signal is generated when the fast moving is above the slow one, and the signal line of Stochastic crosses the lower level from bottom up; a sell signal is generated when the fast moving is below the slow one, and the signal line of Stochastic crosses the upper level from top to bottom; Renko is a non-trivial price display method. Instead
The Vortex Indicator was inspired by the work of an Austrian inventor, Viktor Schauberger, who studied the flow of water in rivers and turbines. Etienne Botes and Douglas Siepman developed the idea that movements and flows within financial markets are similar to the vortex motions found in water. The Vortex Indicator was also partly inspired by J. Welles Wilder's concept of directional movement, which assumes the relationship between price bars gives clues as to the direction of a market. This i
Flat finder MT4
Yuriy Lyachshenko
Cet indicateur détecte un flat et peint la zone trouvée avec un rectangle coloré. L'idée principale de cet indicateur est de détecter un plat lorsque le prix remplit une certaine zone sur le graphique. Paramètres d'entrée : Color rectangle - couleur du rectangle à ombrer. Bars in rectangle - nombre minimum autorisé de barres dans un rectangle. Density in % - densité de l'aplat, définie en pourcentage de la surface du rectangle.
Owl smart levels
Sergey Ermolov
4.34 (35)
Version MT5  |  FAQ L' indicateur Owl Smart Levels   est un système de trading complet au sein d'un seul indicateur qui comprend des outils d'analyse de marché populaires tels que   les fractales avancées de Bill Williams , Valable ZigZag qui construit   la structure d'onde correcte   du marché et   les niveaux de Fibonacci   qui marquent les niveaux exacts d'entrée. sur le marché et les endroits où prendre des bénéfices. Description détaillée de la stratégie Mode d'emploi de l'indicateur Conse
PABT Pattern Indicator - it's classical system one of the signal patterns. Indicator logic - the Hi & Lo of the bar is fully within the range of the preceding bar, look to trade them as pullback in trend. In the way if indicator found PABT pattern it's drawing two lines and arrow what showing trend way.  - First line - it's entry point and drawing at: 1. On the high of signal bar or on middle of the signal bar (depending from indicator mode) for buy; 2. On the low of signal bar or on middle of t
The Four Moving Averages Message indicator ( please see the description and video ), a version of Four Moving Averages , concurrently displays four Moving Averages with default settings in the main chart window: Green and Red ones represent a short-term trend, Red and Blue ones - mid-term trend, while Blue and Yellow ones - long-term trend. You can change the moving average settings and colors. However, these parameters have been configured so that to allow trading on all time frames. The built-
Forex Indicator "RSI and 2   Moving Averages"   for MT4 This indicator is excellent for   Momentum trading systems . " RSI and 2 MAs"   Indicator allows you to   see Fast and Slow Moving Averages of RSI itself Indicator gives opportunities to see the trend change very early " RSI and 2 MAs" can be used to catch the momentum into the trend direction It is very easy to set up this indicator via parameters (see the picture) Indicator can be used on any time-frame // More great Expert Advisors and I
The indicator displays the data of the Stochastic oscillator from a higher timeframe on the chart. The main and signal lines are displayed in a separate window. The stepped response is not smoothed. The indicator is useful for practicing "manual" forex trading strategies, which use the data from several screens with different timeframes of a single symbol. The indicator uses the settings that are identical to the standard ones, and a drop-down list for selecting the timeframe. Indicator Parame
Strong Retracement Points Pro demo edition! SRP (Strong Retracement/Reversal Points) is a powerful and unique support and resistance indicator. It displays the closest important levels which we expect the price retracement/reversal! If all level are broken from one side, it recalculates and draws new support and resistance levels, so the levels might be valid for several days depending on the market! If you are still hesitating to start using this wonderful tool, you can check this link to see h
Royal Dutch Skunk
Sayan Vandenhout
ROYAL DUTCH SKUNK USES THE TREND WAVE INDICATOR AND IT CAN IDENTIFY THE BEGINNING AND THE END OF A NEW WAVE TREND MOVEMENT. AS AN OSCILLATOR, THE INDICATOR IDENTIFIES THE OVERBOUGHT AND OVERSOLD ZONES. IT WORKS GREAT TO CATCH THE SHORT TERM PRICE REVERSALS AND USES A MARTINGALE STRATEGY TO CLOSE ALL TRADES IN PROFIT. USE DEFAULT SETTINGS ON H1 OR HIGHER TIME FRAME ON ANY PAIR FOR MORE ACCURATE TRADES WHY THIS EA : Smart entries calculated by 6 great strategies The EA can be run on even a $20000
Trendiness Index
Libertas LLC
5 (3)
"The trend is your friend" is one of the best known sayings in investing, because capturing large trendy price movements can be extremely profitable. However, trading with the trend is often easier said than done, because many indicators are based on price reversals not trends. These aren't very effective at identifying trendy periods, or predicting whether trends will continue. We developed the Trendiness Index to help address this problem by indicating the strength and direction of price trend
Laser Trend
Nicolas Zouein
The trend is your friend! This is what this indicator is all about. Follow this famous saying and be safe. Characteristics: Buy/Sell signals fixed on the close of a bar. Works on all symbols and all timeframes. Clear visual market trend laser line, Buy/Sell signal arrows, market strength meter, TP1 & TP2 boxes. Visual signals when to enter, when to exit the market. No repainting. Compatible with Flexible EA for trading automation. (Ask for a free set file optimized to perform 2010-2018) Para
Colored trend indicator advanced is a trend indicator that is based on Fast Moving Average and Slow Moving Average and also uses RSI and Momentum to give a trend strength in percent. It is aimed to find more healthy trends with this indicator. This indicator can be used alone as a trend indicator. Colors (Default) Green = Uptrend (Default) Red = Downtrend No color = No trend, no good trend Indicator Parameters WarnPosTrendchange: Warns you when the trend may change. FullColor: See screenshot
Noize Absorption Index MT4
Ekaterina Saltykova
5 (1)
Noize Absorption Index - is the manual trading system that measures the difference of pressure between bears forces and bulls forces. Green line - is a noize free index that showing curent situation. Zero value of index shows totally choppy/flat market.Values above zero level shows how powerfull bullish wave is and values below zero measures bearish forces.Up arrow appears on bearish market when it's ready to reverse, dn arrow appears on weak bullish market, as a result of reverse expectation. S
Description A universal indicator RSI together with moving averages based on it. Depending on the need, moving averages can be disabled. You can color the indicator lines and levels: lines of RSI, moving average lines and thresholds of overbought and oversold levels.   The indicator can be calculated as the standard one on the basis of a price or as a derivative on the basis of the following eighteen other indicators included in the standard package of the MT4 terminal: AD - an indicator of accu
Super Reversal Pattern
Parfait Mujinga Ndalika
Super Reversal Pattern Indicator Unlock the power of advanced pattern recognition with our Super Reversal Pattern Indicator. Designed for traders seeking precision and reliability, this indicator identifies one of the most effective reversal patterns in technical analysis, offering a significant edge in your trading strategy. Key Features: Non-Repainting Accuracy: Enjoy the confidence of non-repainting technology. Once a Super Reversal Pattern is detected, it remains static, providing consis
Forex Indicator HTF Ichimoku for MT4 Ichimoku indicator is   one of the most powerful trend indicators .  H TF means -   H igher Time Frame This indicator is excellent for Trend Traders as well as combination with Price Action entries. HTF Ichimoku  Indicator allows you to attach Ichimoku from Higher time frame to your current chart. Up trend   - red line above blue one (and both lines are above cloud) /   Down trend   - red line below blue one  (and both lines are below cloud) Open BUY orders
Wave Wolf MT4
Andrei Salanevich
L'indicateur Forex Wave Wold MT4 est conçu pour rechercher les vagues de Woolf et les afficher dans la fenêtre actuelle du terminal de trading. Un excellent indicateur pour les traders utilisant les vagues de Wolf dans le commerce. Son application dans les stratégies de trading augmentera considérablement leur efficacité et leur rentabilité. INFORMATIONS SUR L'INDICATEUR Contrairement à d'autres indicateurs de vague Wold, l'indicateur Forex Wave Wold MT4 a un certain nombre de caractéristique
Infinity Trend Pro
Yaroslav Varankin
1 (1)
This is a trend indicator without redrawing Developed instead of the binary options strategy (by the color of the Martingale candlestick) Also works well in forex trading When to open trades (binary options) A signal will appear in the place with a candle signaling the current candle It is recommended to open a deal for one candle of the current timeframe M1 and M5 When a blue dot appears, open a deal up When a red dot appears, open a trade down. How to open trades on Forex. When a signal is rec
Fractal Zig Zag
Mikhail Nazarenko
A   professional version of the ZigZag indicator for visualizing the structure of price movements by fractals. Fractal ZigZag fixes the flaws of the standard version of the ZigZag indicator MT4. It uses Price action and a unique filtering algorithm to determine fractals. Suitable for all types of trading. Ideal for trading according to the WM pattern "Sniper" strategy !!! Features Marks the place of price reversal during the formation of a new fractal with specified parameters. Suitable for
Indicator without redrawing Divergent MAX The DivirgentMAX indicator is a modification based on the MACD. The tool detects divergence based on OsMA and sends signals to buy or sell (buy|sell), taking into account the type of discrepancies detected. Important!!!! In the DivirgentMAX indicator, the optimal entry points are drawn using arrows in the indicator's basement. Divergence is also displayed graphically. In this modification of the MACD, the lag problem characteristic of its predecessor
RSI heatmap
Mr Pimook Chokdamrongsuk
Welcome to the world of trading and technical analysis. In today's fast-paced markets, understanding market sentiment and identifying potential entry and exit points is crucial for successful trading. One essential tool in a trader's arsenal is the Relative Strength Index, or RSI. And now, we introduce the Free RSI Heat Map, a powerful visualization tool that brings RSI data to life. RSI Heat Map offers a comprehensive overview of the RSI values across multiple instruments, allowing trade
FREE
Alpha Trend
Evgeny Belyaev
3.33 (3)
Alpha Trend is a trend indicator for the MetaTrader 4 platform; it has been developed by a group of professional traders. The Alpha Trend indicator finds the most probable tendency reversal points, which allows making trades at the very beginning of a trend. This indicator features notifications, which are generated whenever a new signal appears (alert, email, push-notification). This allows you to open a position in a timely manner. Alpha Trend does not redraw, which makes it possible to evalua
Smart and simple Indicator based on wolves waves reversal pattern also near to falling and rising wedge and butterfly patterns with Stoploss and entry signal preferred time frame M30 : with parameters bars count used for calculation = 200 and moving average for accuracy = 100; you can try it for other higher or lower parameters and try your own set of inputs higher timeframe = lower input !!! important note ::: Indicator don't back draw when first installed on Chart  once installed wait for new
Bermaui Bands
Muhammad Elbermawi
4.97 (68)
Bermaui Bands (BB) est un outil d'analyse technique qui permet de filtrer entre les variations de prix et les tendances. L'idée derrière cet indicateur peut être expliquée dans les étapes suivantes : Calculez la déviation standard comme un oscillateur qui se déplace entre 0 et 100. Je l'appellerai pour cent de déviation de Bermaui (BD %). Si « % BD » est proche de zéro, la volatilité est à son extrême. De plus, si "BD %" est proche de 100 alors la volatilité est très faible. Une volatilité élevé
Reversal Indicator
Augustine Kamatu
4 (1)
Have you ever wanted to be able to catch a trend just as it is beginning? This indicator attempts to find the tops and bottoms of a trend. It uses in-built indicators and studies their reversal patterns. It cannot be used on its own it requires Stochastic(14) to confirm signal. Red for sell, Blue for buy. There are no parameters required just attach to a chart and it is ready to go. Check out other great products from  https://www.mql5.com/en/users/augustinekamatu/seller   A Winning Trading Stra
FREE
AutoTargets
Nor El Isslem Rettab
The AutoTarget Indicator For MT4 is an indicator that is built for the traders that work with the Meta Trader 4 charting platform during their trading day and it is built for a singular reason which is to help the Trader using it to predict the next price target on the current timeframe or currency pair that the trader attaches it to. It works across all currency pairs and trading platforms and can help a seasoned trader by reducing the amount of technical analysis he or she has to do every day
Les acheteurs de ce produit ont également acheté
Gann Made Easy
Oleg Rodin
4.85 (82)
Gann Made Easy est un système de trading Forex professionnel et facile à utiliser qui est basé sur les meilleurs principes de trading en utilisant la théorie de mr. WD Gann. L'indicateur fournit des signaux d'ACHAT et de VENTE précis, y compris les niveaux Stop Loss et Take Profit. Vous pouvez échanger même en déplacement en utilisant les notifications PUSH. S'il vous plaît contactez-moi après l'achat! Je partagerai avec vous mes astuces de trading et d'excellents indicateurs bonus gratuitement!
- Real price is 80$ - 40% Discount ( It is 49$ now ) Contact me for instruction, add group and any questions! Related Product:  Bitcoin Expert , Gold Expert Introduction The breakout and retest strategy is traded support and resistance levels. it involves price breaking through a previous level.  The break and retest strategy is designed to help traders do two main things, the first is to avoid false breakouts. Many false breakouts start with a candlestick that breaks out of a level but ends wi
TPSproTREND PrO
Roman Podpora
4.79 (19)
TPSpro TREND PRO   est un indicateur de tendance qui analyse automatiquement le marché et fournit des informations sur la tendance et chacun de ses changements, ainsi que des signaux pour entrer dans des transactions sans redessiner ! L'indicateur utilise chaque bougie et les analyse séparément. faisant référence à différentes impulsions - impulsion ascendante ou descendante. Points d'entrée précis dans les transactions sur les devises, les crypto-monnaies, les métaux, les actions, les indices 
Gold Stuff
Vasiliy Strukov
4.89 (240)
Gold Stuff est un indicateur de tendance conçu spécifiquement pour l'or et peut également être utilisé sur n'importe quel instrument financier. L'indicateur ne se redessine pas et ne traîne pas. Délai recommandé H1. Au niveau de l'indicateur de travail, l'Expert Advisor EA Gold Stuff est entièrement automatique. Vous pouvez le trouver sur mon profil. Vous pouvez obtenir une copie gratuite de notre indicateur Strong Support et Trend Scanner, veuillez envoyer un message privé. moi! Contactez
FX Volume
Daniel Stein
4.58 (33)
Obtenez votre mise à jour quotidienne du marché avec des détails et des captures d'écran via notre Morning Briefing ici sur mql5 et sur Telegram ! FX Volume est le PREMIER et SEUL indicateur de volume qui fournit un VRAI aperçu du sentiment du marché du point de vue d'un courtier. Il fournit des informations impressionnantes sur la façon dont les acteurs institutionnels du marché, comme les courtiers, sont positionnés sur le marché des changes, bien plus rapidement que les rapports COT. Voir c
Actuellement 20% de réduction ! La meilleure solution pour tout débutant ou trader expert ! Ce logiciel de tableau de bord fonctionne sur 28 paires de devises. Il est basé sur 2 de nos principaux indicateurs (Advanced Currency Strength 28 et Advanced Currency Impulse). Il donne un excellent aperçu de l'ensemble du marché Forex. Il montre les valeurs de l'Advanced Currency Strength, la vitesse de mouvement des devises et les signaux pour 28 paires de devises dans tous les (9) délais. Imagine
Scalper Inside PRO
Alexey Minkov
4.73 (56)
An exclusive indicator that utilizes an innovative algorithm to swiftly and accurately determine the market trend. The indicator automatically calculates opening, closing, and profit levels, providing detailed trading statistics. With these features, you can choose the most appropriate trading instrument for the current market conditions. Additionally, you can easily integrate your own arrow indicators into Scalper Inside Pro to quickly evaluate their statistics and profitability. Scalper Inside
TPSpro RFI Levels
Roman Podpora
4.82 (22)
INSTRUCTIONS       RUS   -   ANGLAIS       Il   est recommandé de l'utiliser avec un indicateur       -       TPSpro   TENDANCE PRO -   Version MT4         Un élément clé du trading est constitué par les zones ou les niveaux à partir desquels les décisions d'achat ou de vente d'un instrument de trading sont prises. Malgré les tentatives des principaux acteurs de dissimuler leur présence sur le marché, ils laissent inévitablement des traces. Notre tâche était d'apprendre à identifier ces traces
Trend Punch
Mohamed Hassan
4.95 (19)
This indicator is unstoppable when combined with our other indicator called  Support & Resistance . After purchase, send us a message and you will get it   for  FREE as a BONUS! Introducing Trend Punch , the revolutionary forex trend indicator that will transform the way you trade! Trend Punch is uniquely designed to provide precise buy and sell arrows during strong market trends, making your trading decisions clearer and more confident. Whether you're trading major currency pairs or exotic sym
FX Power MT4 NG
Daniel Stein
5 (13)
Obtenez votre mise à jour quotidienne du marché avec des détails et des captures d'écran via notre Morning Briefing ici sur mql5 et sur Telegram ! FX Power MT4 NG est la nouvelle génération de notre très populaire indicateur de force des devises, FX Power. Et qu'est-ce que ce compteur de force de nouvelle génération offre ? Tout ce que vous avez aimé de l'original FX Power PLUS Analyse de la force de l'OR/XAU Des résultats de calcul encore plus précis Périodes d'analyse configurables individuel
VEUILLEZ LIRE LES INFORMATIONS CI-DESSOUS AVANT D'ACHETER LE PRODUIT! Apollo Pips PLUS SP est un produit unique! C'EST POUR CEUX QUI VEULENT OBTENIR MON NOUVEL INDICATEUR "APOLLO PIPS" PLUS BONUS "SUPER PACK" AVEC ACCÈS À TOUS MES INDICATEURS DE TRADING! En achetant le produit Apollo Pips PLUS SP, vous achetez en fait une toute nouvelle version de mon indicateur Apollo Pips. Cette version de l'indicateur dispose d'un algorithme amélioré et d'un paramètre facile à utiliser qui vous donne la possi
Gold Channel is a volatility-based indicator, developed with a specific timing algorithm for the XAUUSD pair, which consists of finding possible corrections in the market. This indicator shows two outer lines, an inner line (retracement line) and an arrow sign, where the theory of the channel is to help identify overbought and oversold conditions in the market. The market price will generally fall between the boundaries of the channel. If prices touch or move outside the channel it is a tra
Trend Screener
STE S.S.COMPANY
4.81 (88)
Indicateur de tendance, solution unique révolutionnaire pour le trading et le filtrage des tendances avec toutes les fonctionnalités de tendance importantes intégrées dans un seul outil ! Il s'agit d'un indicateur multi-période et multi-devises 100 % non repeint qui peut être utilisé sur tous les symboles/instruments : forex, matières premières, crypto-monnaies, indices et actions. OFFRE À DURÉE LIMITÉE : L'indicateur Support and Resistance Screener est disponible pour seulement 50 $ et à vie. (
Atomic Analyst
Issam Kassas
5 (2)
Tout d'abord, il convient de souligner que cet indicateur de trading n'est ni repainting, ni redrawing et ne présente aucun délai, ce qui le rend idéal à la fois pour le trading manuel et automatisé. Manuel de l'utilisateur : réglages, entrées et stratégie. L'Analyste Atomique est un indicateur d'action sur les prix PA qui utilise la force et le momentum du prix pour trouver un meilleur avantage sur le marché. Équipé de filtres avancés qui aident à éliminer les bruits et les faux signaux, et à
Tout d'abord, il convient de souligner que cet outil de trading est un indicateur non repeint, non redessiné et non retardé, ce qui le rend idéal pour le trading professionnel. Cours en ligne, manuel utilisateur et démonstration. L'indicateur Smart Price Action Concepts est un outil très puissant à la fois pour les nouveaux et les traders expérimentés. Il regroupe plus de 20 indicateurs utiles en un seul, combinant des idées de trading avancées telles que l'analyse du trader Inner Circle et les
Currency Strength Exotics
Bernhard Schweigert
4.87 (30)
ACTUELLEMENT 20% DE RÉDUCTION ! La meilleure solution pour tout débutant ou trader expert ! Cet indicateur est spécialisé pour montrer la force de la devise pour tous les symboles comme les paires exotiques, les matières premières, les indices ou les contrats à terme. C'est le premier de son genre, n'importe quel symbole peut être ajouté à la 9ème ligne pour montrer la force réelle de la devise de l'or, l'argent, le pétrole, DAX, US30, MXN, TRY, CNH etc. Il s'agit d'un outil de trading uniq
Le profit de la structure du marché change à mesure que le prix s'inverse et recule. L'indicateur d'alerte d'inversion de la structure du marché identifie le moment où une tendance ou un mouvement de prix approche de l'épuisement et est prêt à s'inverser. Il vous avertit des changements dans la structure du marché qui se produisent généralement lorsqu'un renversement ou un recul majeur est sur le point de se produire. L'indicateur identifie initialement les cassures et la dynamique des prix,
Enigmera
Ivan Stefanov
5 (3)
ENIGMERA : Le cœur du marché https://www.enigmera.com Introduction Cet indicateur et ce système de trading constituent une approche remarquable des marchés financiers. ENIGMERA utilise les cycles fractals pour calculer avec précision les niveaux de support et de résistance. Il indique la phase d'accumulation authentique et donne une direction et des objectifs.  Un système qui fonctionne que nous soyons dans une tendance ou une correction.  Comment fonctionne-t-il ? ENIGMERA comprend trois l
Stratos Pali
Michela Russo
5 (1)
Stratos Pali Indicator   is a revolutionary tool designed to enhance your trading strategy by accurately identifying market trends. This sophisticated indicator uses a unique algorithm to generate a complete histogram, which records when the trend is Long or Short. When a trend reversal occurs, an arrow appears, indicating the new direction of the trend. Important Information Revealed Leave a review and contact me via mql5 message to receive My Top 5 set files for Stratos Pali at no cost! D
Ce tableau de bord est un outil d'alerte à utiliser avec l'indicateur d'inversion de structure de marché. Son objectif principal est de vous alerter des opportunités d'inversion sur des périodes spécifiques et également des nouveaux tests des alertes (confirmation) comme le fait l'indicateur. Le tableau de bord est conçu pour s'asseoir sur un graphique et fonctionner en arrière-plan pour vous envoyer des alertes sur les paires et les délais que vous avez choisis. Il a été développé après que de
MetaBands M4
Vahidreza Heidar Gholami
5 (2)
MetaBands uses powerful and unique algorithms to draw channels and detect trends so that it can provide traders with potential points for entering and exiting trades. It’s a channel indicator plus a powerful trend indicator. It includes different types of channels which can be merged to create new channels simply by using the input parameters. MetaBands uses all types of alerts to notify users about market events. Features Supports most of the channel algorithms Powerful trend detection algorith
ACTUELLEMENT 26% DE RÉDUCTION La meilleure solution pour tout débutant ou trader expert ! Cet indicateur est un outil de trading unique, de haute qualité et abordable car nous avons incorporé un certain nombre de caractéristiques exclusives et une nouvelle formule. Avec seulement UN graphique, vous pouvez lire la force de la devise pour 28 paires Forex ! Imaginez comment votre trading va s'améliorer parce que vous êtes capable de repérer le point de déclenchement exact d'une nouvelle tendan
Trend Pulse
Mohamed Hassan
5 (4)
Please contact me after purchase to immediately get your PDF strategy + documentation for Trend Pulse !  Introducing Trend Pulse , a unique and robust indicator capable of detecting bullish, bearish, and even ranging trends! Trend Pulse uses a special algorithm to filter out market noise with real precision. If the current symbol is moving sideways, Trend Pulse will send you a ranging signal, letting you know that it's not a good time to enter a trade. This excellent system makes Trend Pulse
ICT, SMC, SMART MONEY CONCEPTS, SMART MONEY, Smart Money Concept, Support and Resistance, Trend Analysis, Price Action, Market Structure, Order Blocks, BOS/CHoCH,   Breaker Blocks ,  Momentum Shift,   Supply&Demand Zone/Order Blocks , Strong Imbalance, HH/LL/HL/LH,    Fair Value Gap, FVG,  Premium  &   Discount   Zones, Fibonacci Retracement, OTE, Buy Side Liquidity, Sell Side Liquidity, BSL/SSL Taken, Equal Highs & Lows, MTF Dashboard, Multiple Time Frame, BigBar, HTF OB, HTF Market Structure, 
Le système PRO Renko est un système de trading très précis spécialement conçu pour le trading de graphiques RENKO. Il s'agit d'un système universel qui peut être appliqué à divers instruments de négociation. Le système neutralise efficacement ce qu'on appelle le bruit du marché en vous donnant accès à des signaux d'inversion précis. L'indicateur est très facile à utiliser et n'a qu'un seul paramètre responsable de la génération du signal. Vous pouvez facilement adapter l'outil à n'importe q
Shepherd Harmonic Pattern
Abdullah Alrai
4.65 (49)
Cet indicateur détectera des motifs harmoniques dessinés sur le graphique par des méthodes manuelles et automatiques. Vous pouvez consulter le manuel d'utilisateur à partir de ce lien: Ajoutez votre avis et contactez-nous pour l'obtenir. Il existe une version gratuite pour essayer ce produit sur MT4. Vous pouvez l'utiliser pour détecter les motifs Gartley et Nenstar: https://www.mql5.com/en/market/product/30181 Vous pouvez acheter la version complète de MT4 à partir de: https://www.mql5.com/en/m
Scalper Vault
Oleg Rodin
5 (27)
Scalper Vault est un système de scalpage professionnel qui vous fournit tout ce dont vous avez besoin pour un scalpage réussi. Cet indicateur est un système de trading complet qui peut être utilisé par les traders de forex et d'options binaires. Le délai recommandé est M5. Le système vous fournit des signaux fléchés précis dans le sens de la tendance. Il vous fournit également des signaux supérieurs et inférieurs et des niveaux de marché Gann. Les indicateurs fournissent tous les types d'alertes
Présentation       Quantum Trend Sniper Indicator   , l'indicateur révolutionnaire MQL5 qui transforme la façon dont vous identifiez et négociez les inversions de tendance ! Développé par une équipe de traders expérimentés avec une expérience commerciale de plus de 13 ans,       Indicateur Quantum Trend Sniper       est conçu pour propulser votre parcours de trading vers de nouveaux sommets grâce à sa manière innovante d'identifier les inversions de tendance avec une précision extrêmement élevée
Apollo BuySell Predictor est un système de trading professionnel qui comprend plusieurs modules de trading. Il fournit au trader des zones de cassure uniques, des niveaux de support et de résistance basés sur Fibonacci, une ligne de tendance pivot, des signaux de volume de retrait et d'autres fonctionnalités utiles dont tout trader a besoin au quotidien. Le système fonctionnera avec n'importe quelle paire. Les délais recommandés sont M30, H1, H4. Bien que l'indicateur puisse également fonctionne
Plus de l'auteur
Description The indicator determines the appearance of the bars that signal of a reversal of current local moods and plays a beep. It also paints these bars in accordance with the bullish and/or bearish priority. You can select the color for bullish and bearish moods. Inputs Sound_Play - a flag that allows the sound notification. Use Detection of the reversal bar can be a signal to perform appropriate trading activities.  The indicator can be used for manual or automated trading in an Expert
The indicator detects the following types of Japanese candlesticks: Doji, Hammer and/or Hanging Man, Shooting Star and/or Inverted Hammer, Spinning Top, Maribozu. The indicator is intended for manual and/or automated trading within an Expert Advisor. There is a possibility to choose colors for bullish and bearish candlesticks. For automated trading, use any indicator buffer of the double type: 0, 1, 2 or 3, whose value is not zero!
The indicator is intended for detecting big (long) and/or small (short) candlesticks. There is possibility of coloring the bullish and bearish candlesticks. The indicator can be used for manual and/or automated trading within an Expert Advisor. The indicator data that can be used for automated trading can be taken from one of four buffers of the double type: 0, 1, 2 or 3. Values must not be equal to zero. 
The indicator of DeMark fractals. The indicator can be drawn on the basis of price data and on the basis of a moving average. There is a possibility to color the up and down fractals. The indicator can be used for manual and for automated trading within an Expert Advisor. For automated trading, use any indicator buffer of the double type: 0 - up fractals, 1 - down fractals! Values of the buffers must not be equal to zero.  A moving average is drawn on the basis of input parameters: Calc_Method 
Stochastic Global
Igor Semyonov
4 (1)
Description A universal colored indicator Stochastic. The rising and falling lines and the levels of the indicator can be colored.   The indicator can be calculated as the standard one on the basis of a price or as a derivative on the basis of the following nineteen other indicators included in the standard package of the MetaTrader 4 terminal: AD - an indicator of accumulation and distribution of volume. OBV - On Balance Volume. Volume - tick volume indicator. AC - indicator of acceleration. AO
Description A universal colored indicator MACD Histo. The rising and falling of the indicator histogram can be colored.   The indicator can be calculated as the standard one on the basis of a price or as a derivative on the basis of the following twelve other indicators included in the standard package of the MetaTrader 4 terminal: AD - an indicator of accumulation and distribution of volume. OBV - On Balance Volume. Volume - tick volume indicator. Force - Force Index indicator. MFI - Money Flow
Description A colored universal indicator MACD Line (MA convergence-divergence indicator, shown as a histogram). The rising and falling of the indicator histogram can be colored. The indicator can be calculated as the standard one on the basis of a price or as a derivative on the basis of the following twelve other indicators included in the standard package of the MetaTrader 4 terminal: AD - an indicator of accumulation and distribution of volume. OBV - On Balance Volume. Volume - tick volume i
Description A universal indicator RSI together with moving averages based on it. Depending on the need, moving averages can be disabled. You can color the indicator lines and levels: lines of RSI, moving average lines and thresholds of overbought and oversold levels.   The indicator can be calculated as the standard one on the basis of a price or as a derivative on the basis of the following eighteen other indicators included in the standard package of the MT4 terminal: AD - an indicator of accu
CCI Global
Igor Semyonov
5 (1)
Description A universal indicator CCI together with moving averages based on it. Depending on the need, moving averages can be disabled. You can color the indicator lines and levels: lines of CCI, moving average lines and thresholds of overbought and oversold levels.   The indicator can be calculated as the standard one on the basis of a price or as a derivative on the basis of the following eighteen other indicators included in the standard package of the MetaTrader 4 terminal: AD - an indicato
Description A multi-purpose multi-colored/multi-symbol indicator, which is a set of standard tools from the MetaTrader 4 terminal. The difference is that below the basic price chart it allows to calculate and build in a separate window any of the twenty indicators in a colored form, painting bulls and bears in different colors, for any financial instrument in accordance with the list below:  AD - an indicator of accumulation and distribution of volume. OBV - On Balance Volume. Force - Force Inde
AO Global
Igor Semyonov
Description A colored universal indicator AO (Awesome Oscillator). The rising and falling of the indicator histogram can be colored.   The indicator can be calculated as the standard one or as a derivative on the basis of the following eleven other indicators included in the standard package of the MetaTrader 4 terminal: AD - an indicator of accumulation and distribution of volume. OBV - On Balance Volume. Volume - tick volume indicator. Force - Force Index indicator. MFI - Money Flow Index. ATR
Description A colored universal indicator MACD Classic (MA convergence-divergence indicator) that combines two indicators: MACD Line and MACD Histo. The rising and falling lines, the signal line and the indicator histogram can be colored. The indicator can be calculated as the standard one on the basis of a price or as a derivative on the basis of the following twelve other indicators included in the standard package of the MetaTrader 4 terminal: AD - an indicator of accumulation and distributio
Description The universal colored multicurrency/multisymbol indicator MACD Classic, consisting of two MACD indicators: MACD Line and MACD Histo. The indicator may be used with any broker, irrespective of the name of the financial instrument since it is necessary to manually enter the name as an input parameter. If you enter a non-existent or incorrect name of a financial instrument, you will receive an error message that this financial instrument is unknown (does not exist). Inputs Currency_Na
Description A colored universal indicator/oscillator based on crossing moving averages. The rising and falling lines of the indicator histogram can be colored. The combined use of the line and the histogram increases the level of the analysis when making a decision to open or close deals. The indicator can be calculated as the standard Price Oscillator or as a derivative on the basis of the following eleven other indicators included in the standard package of the MetaTrader 4 terminal: AD - an i
Description A universal colored multicurrency/multi-symbol indicator RAVI. Was proposed by T. Chand as a trend indicator. RAVI means Range Action Verification Index. The indicator may be used with any broker, irrespective of the name of the financial instrument since it is necessary to manually enter the name as an input parameter. If you enter a non-existent or incorrect name of a financial instrument, you will receive an error message that this financial instrument is unknown (does not exist).
Description A colored multicurrency/multisymbol oscillator of the market mood. The oscillator is designed for detecting the continuation or change of the market mood prior to its occurrence. An excellent example is the screenshots that show all the features of the oscillator. The oscillator may be used with any broker, irrespective of the name of the financial instrument since it is necessary to manually enter the name as an input parameter. If you enter a non-existent or incorrect name of a fin
Description The indicator determines the appearance of internal bars on the chart, and paints them in accordance with the bullish and/or bearish mood. The indicator can notify of the appearance of a formed internal bar by playing a beep, as well as display the time remaining until the end of the formation of the current bar in the format of <d:h:m:s, where: < means the current bar. d - days. h - hours. m - minutes. s - seconds. The bullish and bearish mood can be colored. Inputs Sound_Play - a
Description The indicator determines the appearance of bars that notify of the reversal of the current trend, and paints them in accordance with the bullish and/or bearish mood. The indicator can notify of the appearance of a formed reversal bar by playing a beep, as well as display the time remaining until the end of the formation of the current bar in the format of <d:h:m:s, where: < means the current bar. d - days. h - hours. m - minutes. s - seconds. You can select the color for bullish and
Description A universal colored multicurrency/multi-symbol indicator of moving averages: Moving Average, Double Moving Average, Triple Moving Average . The indicator is drawn in a separate window, so below the main trading chart a user can see the development of another financial instrument. It is very useful when considering the combined values of various moving averages for different financial instruments below the main trading chart.  The indicator may be used with any broker, irrespective of
Description A universal colored indicator of moving averages: Moving Average, Double Moving Average, Triple Moving Average . The indicator provides various opportunities for the analysis of prices based on different ways of constructing moving averages in the window of the main financial instrument. You can color bullish and bearish moods. Inputs MA_Type - type of multiplicity: Moving Average. Double Moving Average. Triple Moving Average. MA_Period - the MA period. MA_Method - the averaging me
Description A colored universal multicurrency/multi-symbol indicator Bollinger Bands to be drawn in a separate window below the main financial instrument. The rising and falling line of the main indicator and Bollinger Bands can be colored. The indicator can be calculated based on one of the eleven basic indicators included in the standard package of the MetaTrader 4 terminal: AD - an indicator of accumulation and distribution of volume. OBV - On Balance Volume. Force - Force Index indicator. MF
Description A colored universal multicurrency/multi-symbol indicator Channel to be drawn in a separate window below the main financial instrument. The indicator uses the calculation method of the Price Channel indicator. The rising and falling line of the main indicator and the Channel lines can be colored. The indicator can be calculated based on one of the eleven basic indicators included in the standard package of the MetaTrader 4 terminal: AD - an indicator of accumulation and distribution o
Keltner Channel
Igor Semyonov
5 (1)
Description Keltner's colored channel indicator,also called STARC band, drawn in the main chart window. The indicator uses the calculation technique of the three drawing options: basic, improved and modified . The first two were proposed by Keltner, the third one - by a successful trader L. Rakshe. You can also search for your own best parameters of the indicator. The upper, middle and lower bands can be colored. The indicator includes the basic analytical tool of the market moods by Keltner. Th
Description A colored universal multicurrency/multi-symbol indicator ZigZag to be drawn in a separate window below the main financial instrument. The indicator may be used with any broker, irrespective of the name of the financial instrument since it is necessary to manually enter the name as an input parameter. If you enter a non-existent or incorrect name of a financial instrument, you will receive an error message that this financial instrument is unknown (does not exist).  The indicator can
Description A colored channel indicator Price Channel to be drawn on the main chart of a financial symbol. It can color bullish and bearish moods based on the middle line of the indicator, as well as change the color of the upper and lower lines of the channel. Purpose The indicator can be used for manual or automated trading in an Expert Advisor. Values of indicator buffer of the double type can be used for automated trading:  The middle line of the indicator - buffer 4. The upper line of the
Description Candlesticks is a colored multicurrency/multy-symbol indicator. It shows a financial instrument as a candlestick chart in a separate window below the chart of the main financial symbo. The indicator may be used with any broker, irrespective of the name of the financial instrument since it is necessary to manually enter the name as an input parameter. If you enter a non-existent or incorrect name of a financial instrument, you will receive an error message that this financial instrume
Description Candlestick Tools  is a colored multicurrency/multy-symbol indicator. It shows one of four standard indicators as a candlestick chart in a separate window below the chart of the main financial symbol. The indicator is calculated based on one of two indicators included in the standard package of the МetaТrader 4 terminal: CCI - Commodity Channel Index. RSI - Relative Strength Index. The default indicator is Commodity Channel Index. The indicator may be used with any broker, irrespecti
Pivot Pro
Igor Semyonov
Description Pivot Pro  is a universal color indicator of the  Pivot Points  levels systems. You can select one of its three versions:  Standard   Old , Standard New  and  Fibo . The system will automatically calculate the  Pivot Point  on the basis of market data for the previous day ( PERIOD_D1 ) and the system of support and resistance levels, three in each. It can also display price tags for each level. You can color the indicator lines. Only a method of calculation of the third level of supp
Description The indicator is intended for labeling the chart using horizontal levels and/or half-round prices. The indicator works on any financial instrument regardless of the name and the number of digits. A user can choose colors for the indicator lines. Input Parameters Calc_Method - method of calculation of the lines: levels of round prices. levels of half-round prices. Digits_Accepted - flag for calculating the levels according to number of decimal places in the quotes of a financial ins
Description A colored universal multicurrency/multi-symbol indicator MACD Line Smart (the indicator moving average convergence divergence is displayed as a histogram) based on double or triple moving average .  Comparing to the standard MACD this indicator is more sensitive to what allows generating advance signals. he indicator may be used with any broker, irrespective of the name of the financial instrument since it is necessary to manually enter the name as an input parameter. If you enter a
Filtrer:
Aucun avis
Répondre à l'avis
Version 1.21 2020.04.05
Updating