Lines Profit Loss MT5
- Indicateurs
- Taras Slobodyanik
- Version: 4.0
- Mise à jour: 10 septembre 2024
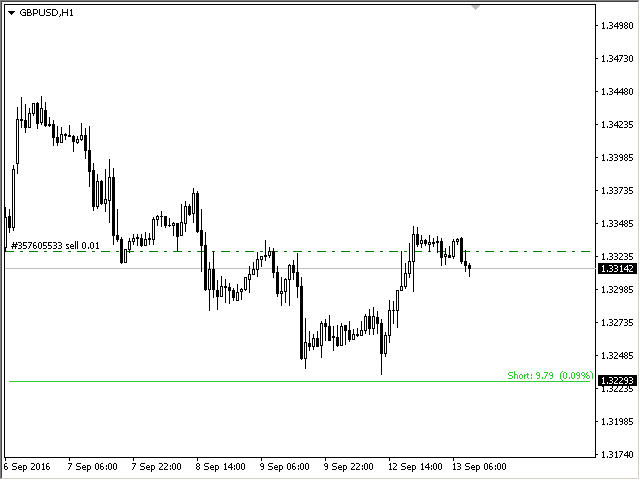
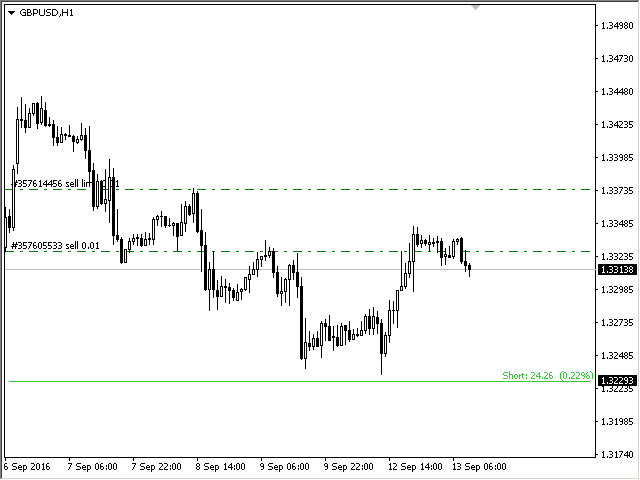
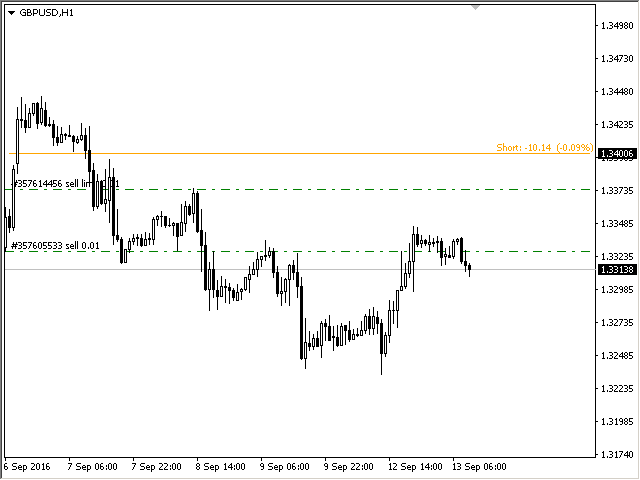
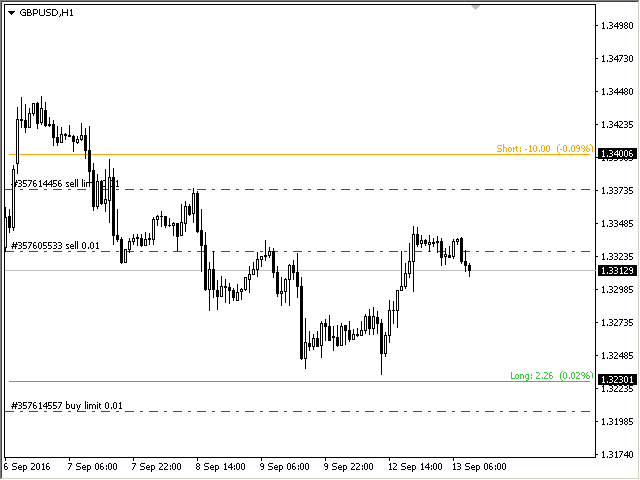
L'indicateur affiche le profit (la perte) sur le symbole actuel. Vous pouvez librement faire glisser et déposer la ligne pour afficher le profit ou la perte actuel.
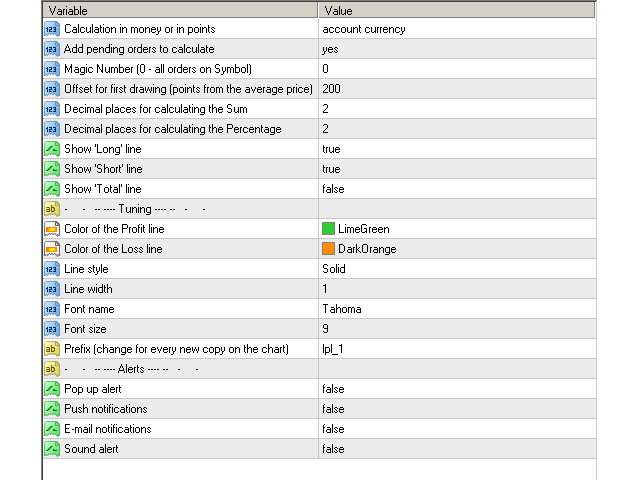
Paramètres
Calculation in money or in points — calculez le profit/la perte en points ou en argent.
Add pending orders to calculate — prenez en compte les commandes en attente dans les calculs.
Magic Number (0 - all orders on symbol) — nombre magique, s'il est nécessaire d'évaluer des commandes spécifiques.
Offset for first drawing (points from the average price) — décalage de la ligne par rapport au prix moyen au premier démarrage.
Decimal places for calculating the Sum — le nombre de chiffres après la virgule décimale pour afficher la somme.
Decimal places for calculating the Percentage — le nombre de chiffres après la virgule décimale pour afficher le pourcentage.
Tuning (Réglage)
Color of the profit line — ouleur de la ligne de profit.
Color of the loss line — ouleur de la ligne de perte.
Line style — Style de ligne.
Line width — Largeur de ligne.
Font name — Nom de la police.
Font size — Taille de police.
Prefix (change for every new copy on the chart) — Préfixe (change à chaque nouvelle copie sur la carte).


hay lắm