MIDAS Trading Tools
- Indicateurs
- Carl Gustav Johan Ekstrom
- Version: 4.70
- Mise à jour: 1 mai 2024
- Activations: 20
The introduction of the MIDAS Trading Tools indicator represents the culmination of my trading expertise and innovative application. By incorporating new concepts and collaborating with fellow traders like Robert Young (US), we have enriched and enhanced this indicator. In the sections below, you'll find detailed descriptions of the variables comprising this indicator.
MIDAS which is an acronym for Market Interpretation/Data Analysis System is the innovative work of the late technical analyst Paul Levine. Levine strongly believed that the dynamic interplay of support and resistance and accumulation and distribution are the ultimate determinants of price behavior. After examining and rejecting all of the standard technical analysis techniques for determining support and resistance, he came up with a new approach - MIDAS!
MIDAS Trading Tools consists of two standalone indicators tailored for different market environments:
Basic Strategy & Concept
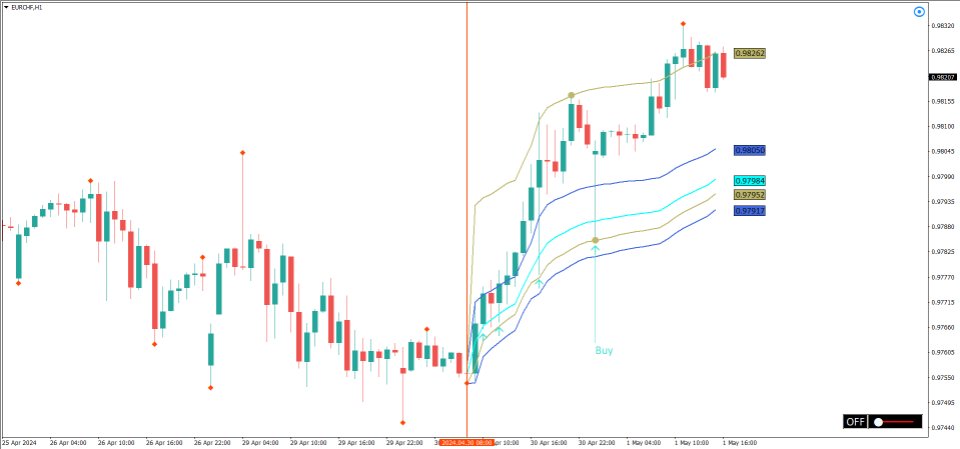
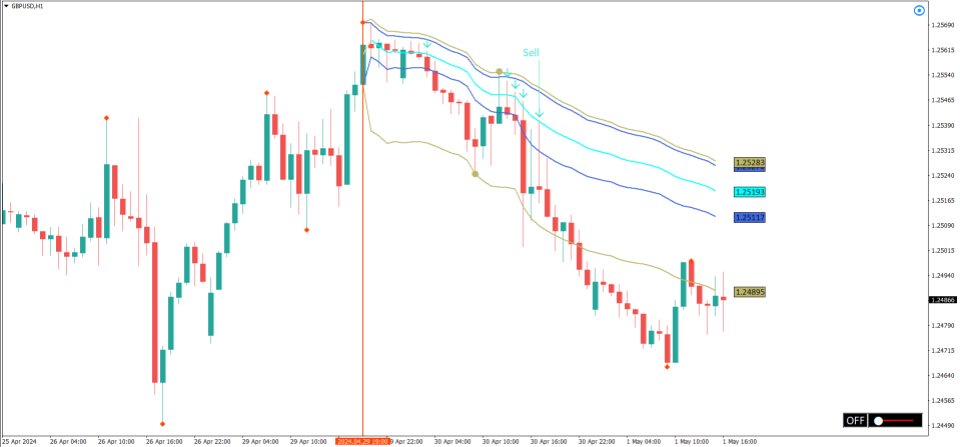
3. Click on the red vertical line and drag it to a recommended anchor point ◆.
4. Activate the Buy/Sell Alert System by clicking the circled button in the top right corner. White = OFF / Blue = ON.
5. Wait for the price to retract to the MIDAS Support/Resistance curve, signaling a buy or sell opportunity.
6. Enter the market when a signal is generated, ensuring a minimum risk-to-reward ratio of 1:1+.
7. If the price accelerates away before fully retracing to the MIDAS Curve, launch and adjust the Top-Bottom Finder to the current pullback(s) by manipulating the cumulative volume in the bottom right corner to predict potential tops or bottoms.
8. When the Top-Bottom Finder reaches 100%, a retracement to the MIDAS Support/Resistance curve becomes probable.
Parameters
- Show Recommended Anchor Points: True/False
- Show Displacement Curves: Yes/No
- Top-Bottom Finder Fuel Step (Cumulative Volume): 5
- Show Signal: Yes/No
- Show Signal for...: All/Retracement/Break
- Signal Color: Yellow
- Pop-Up Alert: Yes/No
- Pop-Up Alert Sound: ok.wav
- Push Notification: Yes/No
- Email Message: Yes/No


Its a good indicator for identifying pullback buy position, thank you