SSA Trend Predictor
- Indicateurs
- Roman Korotchenko
- Version: 2.4
- Mise à jour: 25 novembre 2021
This indicator extracts a trend from a price series and forecasts its further development. Algorithm is based on modern technique of Singular Spectral Analysis (SSA). SSA is used for extracting the main components (trend, seasonal and wave fluctuations), smoothing and eliminating noise. It does not require the series to be stationary, as well as the information on presence of periodic components and their periods. It can be applied both for trend and for another indicators.
Features of the method and operation principle
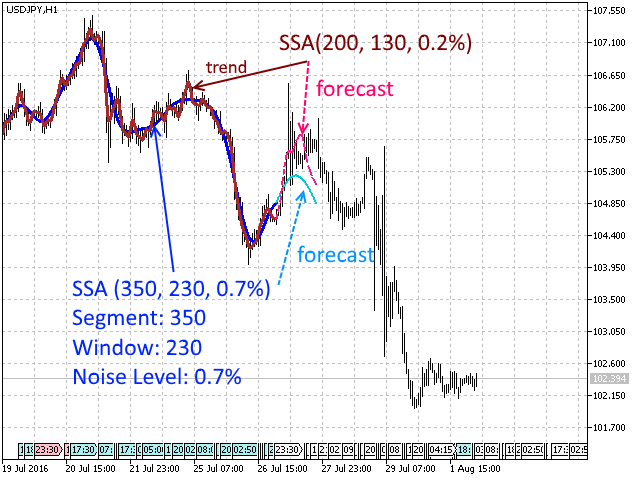
Dynamics of prices is presented as a process caused by influence of factor on different scales and additional "noise". Influence factors determine the trend and regularities of price changes, noise oscillations hide the useful information. Processing by the Caterpillar-SSA method allows to separate subspaces of the signal and noise, evaluate the contribution and scale of significant influence factors. Extracted "signal" does not have phase delays unlike the conventional filtering methods and smoothed average. A forecast is plotted based on the identified trend and periodicity. Forecast based on a properly chosen model is the hedging method in the trading strategy.
Usage
Managing the indicator parameters allows to adjust the smoothness of the extracted trend and to control the noise filtering threshold, consider on suppress the contribution of the components in the signal, which affect it on different time scales. The optimum decomposition of data into signal and noise components is determined using the time horizon of the trading strategy and the current market situation.
Forecast
The forecast of the future values is performed according to the constructed model, which considers the statistical characteristics of data and the best within the model. Note that the "left out" influence factors can be very significant. Adequate model - good forecast. It is necessary to focus on quality and not quantity forecast of price fluctuations and use it as a hedging signal.
Parameters
- Algorithm — forecast algorithm (1 — vector, 2 — recurrent),
- N: Data fragment — length of the analyzed price series,
- Time-dependent lag — determine the influence history on counting (N/2, N/2.5, N/3),
- Noise High-Freq limit — parameter for filtering noise for the trend (remove the contribution of high frequency oscillations),
- Recalculate period – indicator recalculation period (sec),
- Predictable points — number of forecast points,
- Backward shift (test) — backward shift of analyzed fragment in history. For construction of the model and forecast according to the known data.
- * VISUAL OPTIONS *
- General parts — color for trend view,
- Prediction — color for forecast view,
- Plot style — line or histogram plot style.
Recommendations
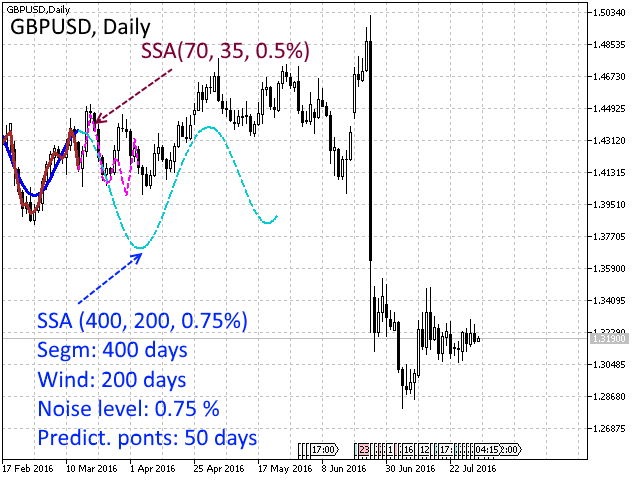
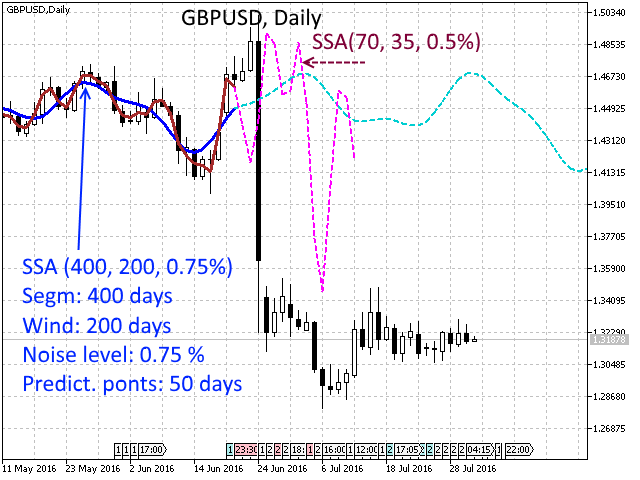
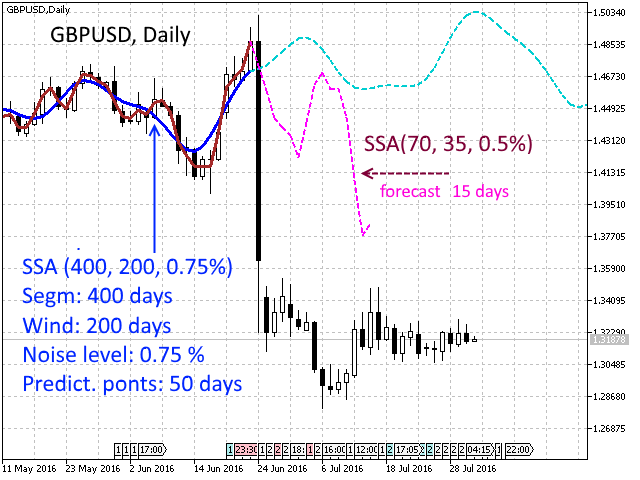
The best length of the price series fragment (N) is selected based on the statistical uniformity of data (200-600 points).
The parameter for filtering noise - Noise HF Limit: the longer the series, the smaller the filtration parameter. For the short fragments, the evaluation of the statistical properties is performed with an increased error - the level should be increased.
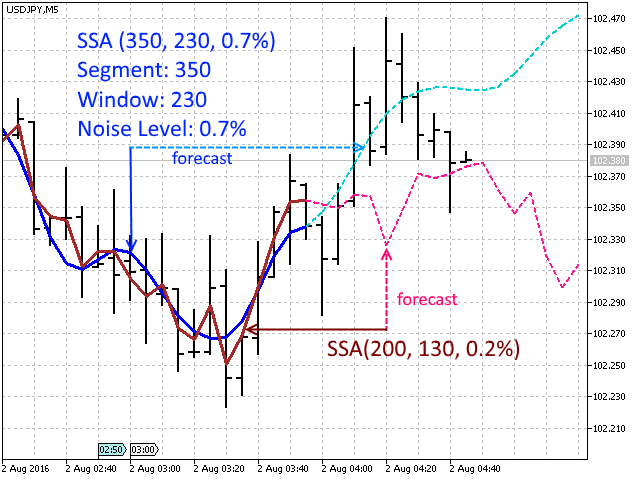
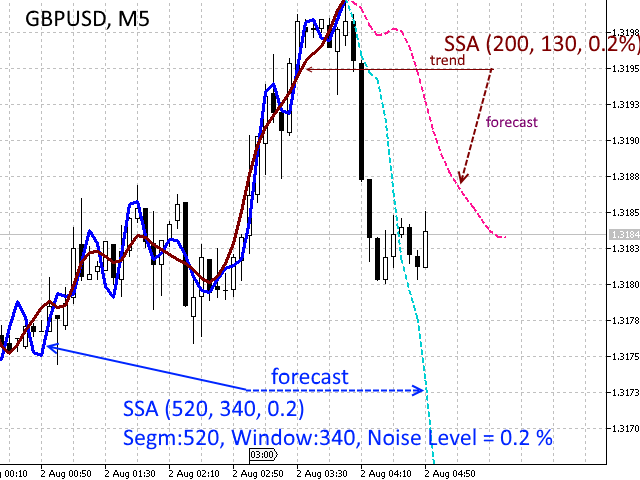
The number of prediction points with acceptable forecast probability is 10-30 in a customized model. For further analysis, it is reasonable to use a more coarse timeframe. Simultaneous application of the two indicators with different parameters (N=400 and 250) will show the divergence of influence factors related to different time scales or will confirm the forecast.
P.S. Implementation with the FFT algorithm allowed to improve the data processing speed by more than 50 times compared to the normal method. It is presented in SSA Fast Trend Forecast.




很好