EasyTrend AM
- Indicateurs
- Andriy Matviyevs'kyy
- Version: 30.75
- Mise à jour: 11 avril 2025
The presented product is a trend indicator of technical analysis that allows you to open a position at the very beginning of a significant price movement.
The most important qualities of the presented indicator are:
- The ability to follow the trend for as long as possible to get all the potential profit;
- Minimization of potential losses in case of a trend reversal or significant correction.
The indicator has a wide range of customizable parameters allowing it to be used effectively in any market.
The indicator does not repaint.
The principle of operation of the indicator:
The classic definition of a trend implies a certain sequence of peaks or troughs on the price chart, depending on its direction.
If the trend is upward, then each subsequent peak or trough should be higher than the previous ones.
A similar situation with a downward trend, where each new minimum or maximum should lie below the previous ones.
Any movement against the main trend and not being a new trend is considered a correction.
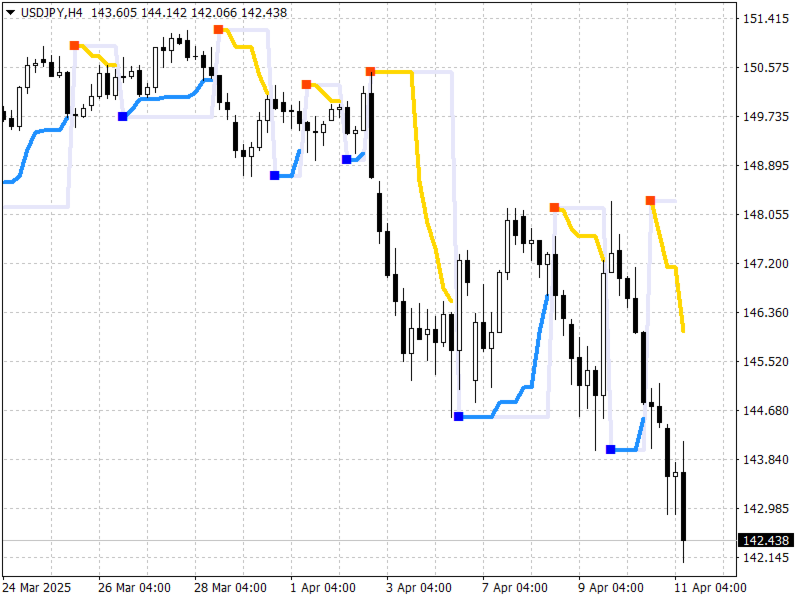
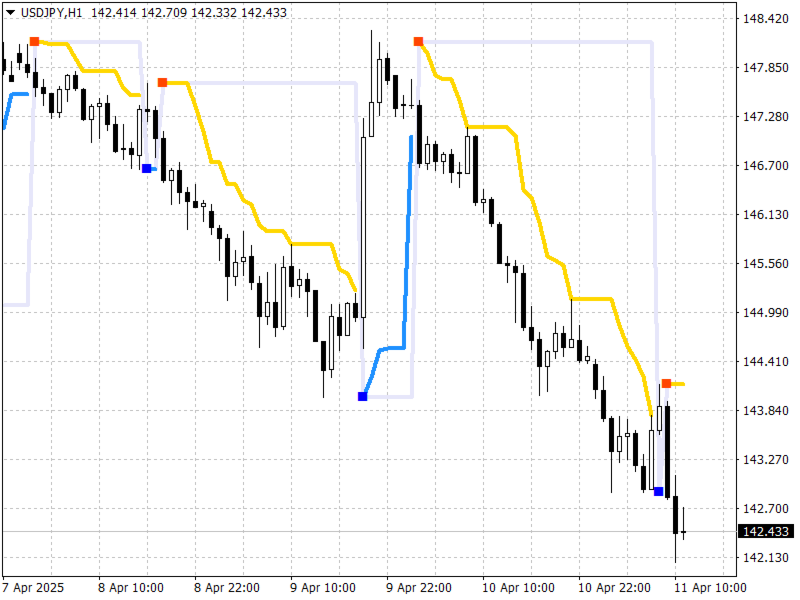
The main idea of the presented indicator is to follow the trend at a certain distance, allowing you to ignore minor corrections that may occur within such a trend.
The filter separating the correction from the trend in the presented indicator is a smoothed average price value for a certain period.
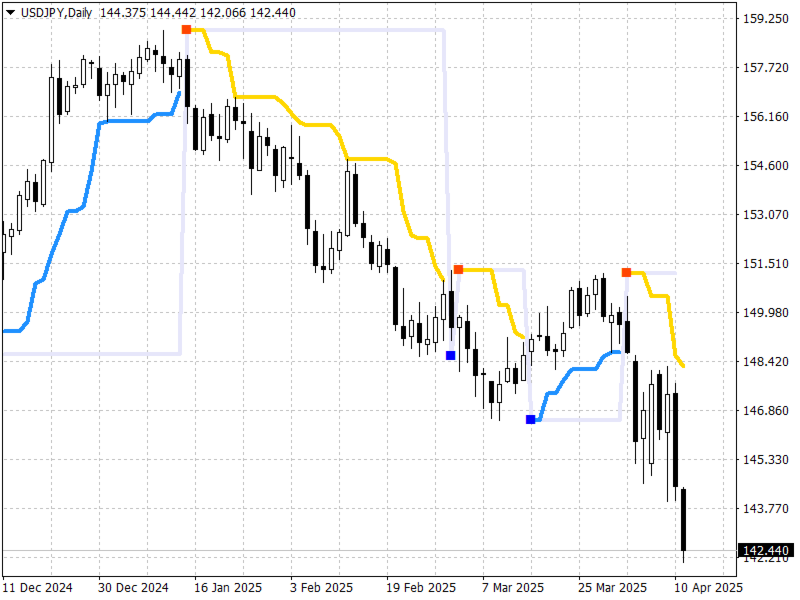
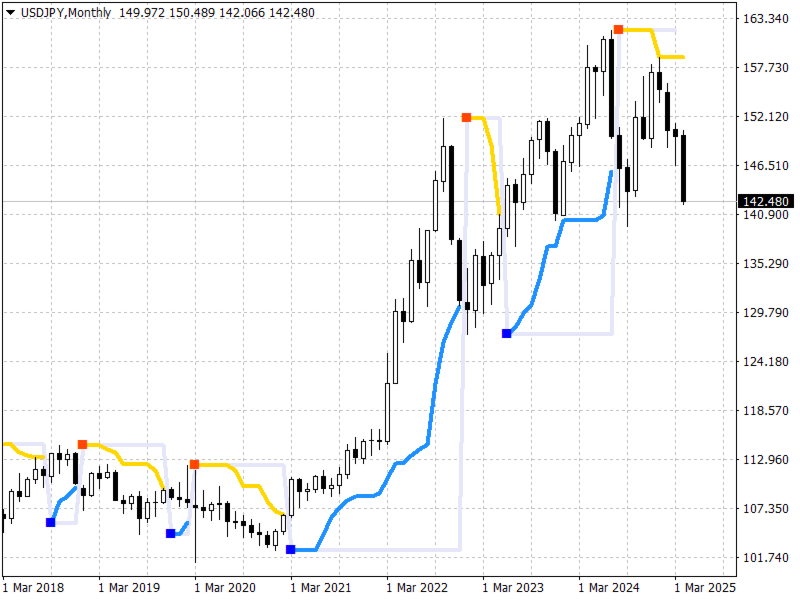
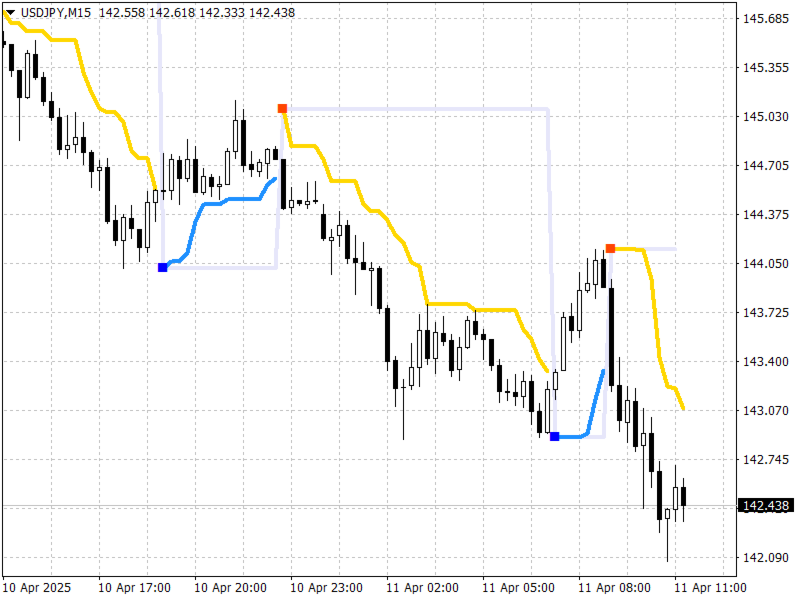
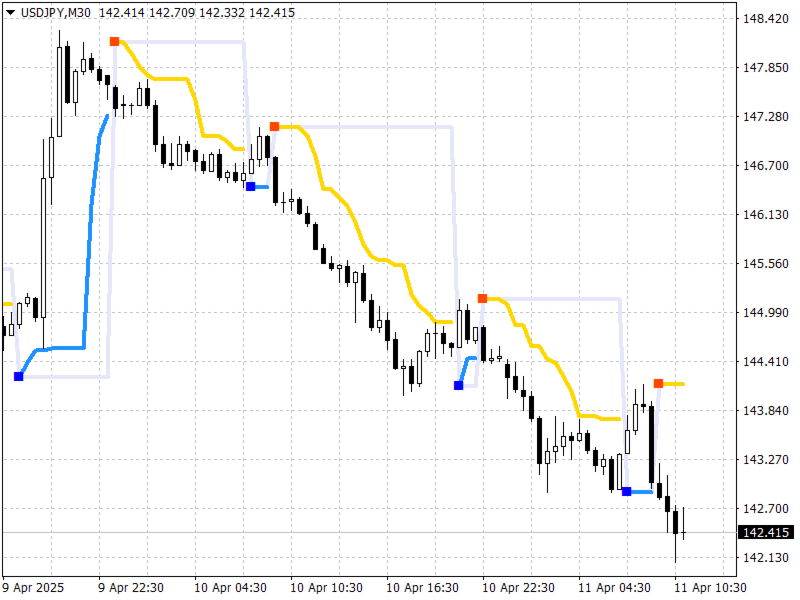
Signals when working with the indicator:
- The appearance of a red dot above the price chart is a possible start of a downward trend;
- The appearance of a green dot below the price chart is a possible start of an upward trend.
Rules for using the indicator:
- When the indicator signal to buy appears, a pending stop order to buy is placed above the bar on which the signal was given.
- The protective stop level is set at the indicator signal point.
- When the indicator signal to sell appears, a pending stop order to sell is placed below the bar on which the signal was given.
- The protective stop level is set at the indicator signal point.
Configurable indicator parameters:
- Smoothing_Period - indicator smoothing;
- Smoothing_Shift - shift for indicator smoothing;
- Smoothing_Method - indicator smoothing method;
- Period_for_limits - data period for which the maximums and minimums of prices participate in the formation of the indicator (the higher, the less sensitive the indicator);
- Number_of_bars_calculated - number of bars on which the indicator will be calculated and displayed (> 300);
- Alerts - the indicator displays a dialog box containing information about the indicator signal;
- Send_Notification - the indicator sends a notification to mobile terminals whose MetaQuotes ID is specified in the settings window on the "Notifications" tab;
- Send_Mail - the indicator sends an email to the address specified in the settings window on the "Mail" tab.
Attention:
Please note that any market is constantly changing and there is no guarantee that methods that have been effective in the past will show the same results in the future.
You should not use maximum risk indicators in real trading that have shown the best results in the past.
To minimize potential losses, you should regularly optimize the product parameters, study the results of its work and withdraw part of the profit received.
It is recommended that before using the product on a real account, you test its work on a demo account in the same market and with the same broker where you plan to trade.
With respect and best wishes,
Andriy Matviyevs'kyy
P.S.
If you liked this product, I would be grateful for a fair assessment - positive user reviews motivate the author, and reasonable criticism allows us to make products better.
I suggest visiting my page where you will find many unique author's works that are the result of many years of studying exchange trading and FOREX trading.

优秀,再接再厉期待继续开发更优秀的指标、