• Aperçu
  • Avis (37)
  • Commentaires (195)
  • Nouveautés

FX Volume

4.58

Obtenez un véritable avantage sur le Forex avec FX Volume : L'indicateur de volume ultime

FX Volume est le premier et le seul indicateur de volume à révéler le véritable sentiment du marché d'un point de vue d'initié. En fournissant des informations uniques sur la façon dont les acteurs institutionnels du marché et les courtiers sont positionnés, FX Volume vous permet de négocier avec la prévoyance habituellement réservée aux acteurs majeurs. Dites adieu aux délais des rapports COT - FX Volume vous donne ces informations cruciales instantanément sur votre graphique, vous permettant de prendre des décisions de trading plus rapides et plus intelligentes.


Pourquoi FX Volume est essentiel pour votre trading

Avec FX Volume, vous bénéficiez d'un accès inégalé à des données de marché uniques, vous donnant des informations que les indicateurs de volume typiques ne peuvent tout simplement pas fournir. Voici ce que vous pouvez suivre directement sur votre graphique :

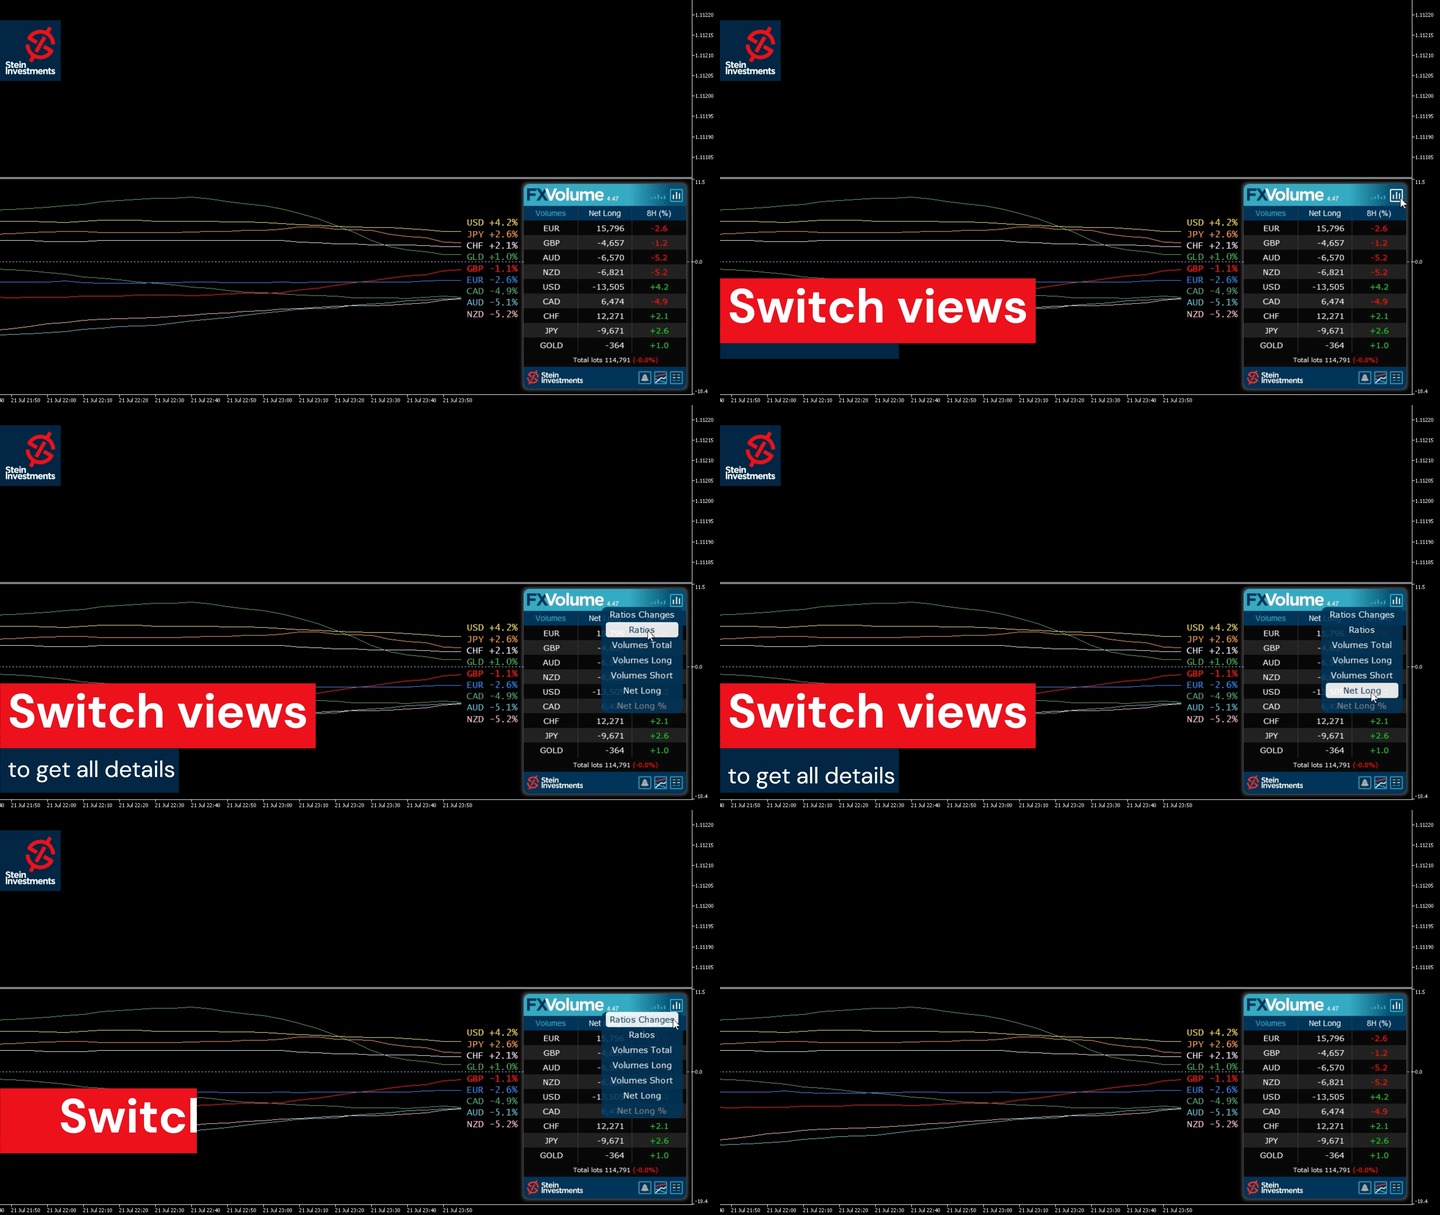
  • Ratios de position : Consultez les ratios long-to-short entre les devises pour avoir une vision claire du sentiment du marché.
  • Variations des ratios : Visualisez les variations en pourcentage des positions longues sur la période que vous avez choisie.
  • Volume total : Suivez en temps réel le volume total négocié (long et short) sur les différentes devises.
  • Volumes longs et courts détaillés : Sachez exactement quelle quantité de chaque devise est achetée ou vendue.
  • Volumes longs nets : Voir la différence entre les positions longues et courtes pour évaluer le sentiment net.
  • Variation en pourcentage des positions longues nettes : Comprendre les changements dans le sentiment net long sous forme de pourcentages pour une comparaison rapide.
  • Corrélations volume-prix : Suivez la façon dont les volumes influencent les prix pour trouver des points d'inflexion potentiels.


Comment accéder aux données uniques de FX Volume ?

  1. Ajoutez l'URL https://stein.investments aux URL autorisées de votre terminal.
  2. Installez et exécutez SI Connect sur un graphique séparé pour extraire les données, prêtes à être affichées sur votre graphique principal.


Liens importants


Pourquoi FX Volume est si puissant

Le marché Forex est décentralisé, et les indicateurs de volume traditionnels ne peuvent pas vous montrer une image complète. Depuis octobre 2018, nous’ analysons et enregistrons des données de trading réelles provenant de diverses sources mondiales. Ces données sont surveillées en permanence et compilées dans un indice facile à lire couvrant les devises les plus importantes... et même l'or. À l'avenir, nous souhaitons développer cet outil afin de fournir des informations sur les indices, les matières premières et bien plus encore.


Comment fonctionne le volume FX

Nos données montrent le marché du point de vue des "grands acteurs", ce qui vous aide à repérer les retournements potentiels et les opportunités que les traders particuliers ne voient pas :

  1. Lorsque vous passez un ordre, votre courtier prend le côté opposé ou l'achemine vers une institution, formant ainsi une position complète.
  2. Notre fournisseur de données anonymes partage ces positions en direct, montrant les tendances de volume des traders particuliers à travers différents courtiers.
  3. Ces données nous permettent d'observer les biais des traders particuliers’ et d'examiner s'ils s'alignent sur les mouvements réels du marché. Souvent, ce n'est pas le cas.
  4. FX Volume interprète ces données d'un point de vue " contrarien ", en montrant comment les principaux acteurs peuvent agir en fonction du positionnement des particuliers. Si le marché de détail est 80% long, par exemple, FX Volume affichera une position 80% short du point de vue des acteurs institutionnels, révélant la direction potentielle du marché avec une précision remarquable.


Caractéristiques polyvalentes de FX Volume

  • Périodes d'analyse personnalisables : Comparez les volumes à partir de n'importe quelle période, afin de toujours avoir la vue exacte dont vous avez besoin.
  • Options de données historiques : Choisissez parmi une gamme de lignes d'historique et de périodes pour que votre analyse reste ciblée et claire.
  • Capacité multi-instances : Combinez plusieurs instances de FX Volume sur un même graphique pour obtenir une vue d'ensemble du marché.
  • Système d'alerte étendu : Recevez des alertes basées sur des paramètres et des seuils clés, pour vous tenir au courant de chaque changement critique.
  • Visuels élégants et adaptables : Appropriez-vous l'indicateur grâce à la personnalisation complète des couleurs et du style pour l'adapter à votre configuration.
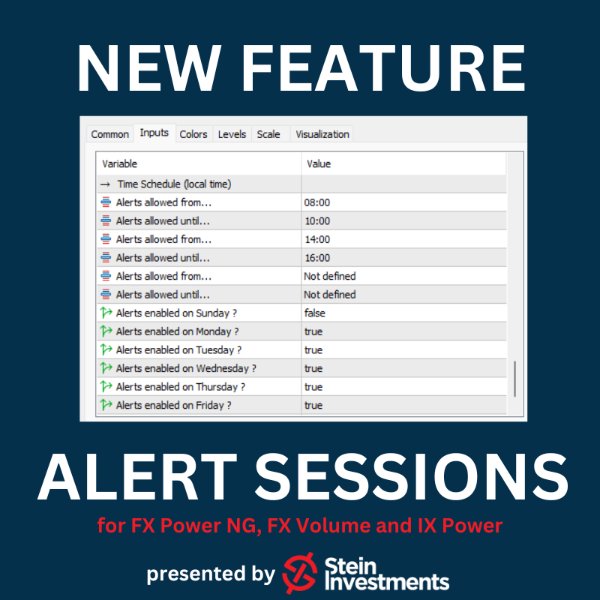
  • Programmation pratique : Contrôlez le moment où vous recevez les alertes, en les adaptant à votre calendrier de trading.


    Si quelque chose n'est pas clair, écrivez-nous et nous vous aiderons.


    Faites partie d'une communauté exclusive de traders !

    Après votre achat, partagez une capture d'écran avec nous et nous vous inviterons à rejoindre notre groupe de trading privé de plus de 500 membres, où vous trouverez des idées partagées, des conseils de trading et des discussions en direct sur les mouvements du marché.


    Prêt à élever votre niveau de trading ?

    FX Volume vous donne un avantage compétitif en vous montrant le marché à travers les yeux des "grands joueurs". Rejoignez-nous aujourd'hui, et débloquez un avantage inestimable pour un trading rentable et informé.


    Meilleures salutations et bon trading,

    Daniel et Alain


    Avis 37
    Kabelo Mataboge
    63
    Kabelo Mataboge 2024.07.10 18:12 
     

    When applied correctly, FX volume is almost 100% accurate in terms of direction. Adding a solid entry strategy has significantly improved my trading win rate. I'm pleased to have found a reliable trading indicator after testing and using over 1,000 repainting, recalculating, and unreliable indicators. Please, Daniel, keep up the excellent work and product.

    Ingo Reimann
    223
    Ingo Reimann 2023.12.21 16:13 
     

    The best and most precise product that I have had the pleasure of getting to know in my trading career. I can recommend it to everybody. Since I started using these products, trading has also been working. The support from the developers and the community are also in a class of their own.

    3316589p
    870
    3316589p 2022.08.29 20:34 
     

    Hi Daniel, Great indicator used in conjunction with Fx Power, an invite for the the chat group would be appreciated

    Produits recommandés
    Owl smart levels
    Sergey Ermolov
    4.34 (35)
    Version MT5  |  FAQ L' indicateur Owl Smart Levels   est un système de trading complet au sein d'un seul indicateur qui comprend des outils d'analyse de marché populaires tels que   les fractales avancées de Bill Williams , Valable ZigZag qui construit   la structure d'onde correcte   du marché et   les niveaux de Fibonacci   qui marquent les niveaux exacts d'entrée. sur le marché et les endroits où prendre des bénéfices. Description détaillée de la stratégie Mode d'emploi de l'indicateur Conse
    Noize Absorption Index MT4
    Ekaterina Saltykova
    5 (1)
    Noize Absorption Index - is the manual trading system that measures the difference of pressure between bears forces and bulls forces. Green line - is a noize free index that showing curent situation. Zero value of index shows totally choppy/flat market.Values above zero level shows how powerfull bullish wave is and values below zero measures bearish forces.Up arrow appears on bearish market when it's ready to reverse, dn arrow appears on weak bullish market, as a result of reverse expectation. S
    Daily Candle Predictor est un indicateur qui prédit le cours de clôture d'une bougie. L'indicateur est principalement destiné à être utilisé sur les graphiques D1. Cet indicateur convient à la fois au trading forex traditionnel et au trading d'options binaires. L'indicateur peut être utilisé comme un système de trading autonome, ou il peut servir de complément à votre système de trading existant. Cet indicateur analyse la bougie actuelle, calcule certains facteurs de force à l'intérieur du corps
    Blahtech Market Profile
    Blahtech Limited
    4.53 (15)
    Was: $249  Now: $99   Market Profile defines a number of day types that can help the trader to determine market behaviour. A key feature is the Value Area, representing the range of price action where 70% of trading took place. Understanding the Value Area can give traders valuable insight into market direction and establish the higher odds trade. It is an excellent addition to any system you may be using. Blahtech Limited presents their Market Profile indicator for the MetaTrader community. Ins
    Infinity Trend Pro
    Yaroslav Varankin
    1 (1)
    This is a trend indicator without redrawing Developed instead of the binary options strategy (by the color of the Martingale candlestick) Also works well in forex trading When to open trades (binary options) A signal will appear in the place with a candle signaling the current candle It is recommended to open a deal for one candle of the current timeframe M1 and M5 When a blue dot appears, open a deal up When a red dot appears, open a trade down. How to open trades on Forex. When a signal is rec
    Super Reversal Pattern
    Parfait Mujinga Ndalika
    Super Reversal Pattern Indicator Unlock the power of advanced pattern recognition with our Super Reversal Pattern Indicator. Designed for traders seeking precision and reliability, this indicator identifies one of the most effective reversal patterns in technical analysis, offering a significant edge in your trading strategy. Key Features: Non-Repainting Accuracy: Enjoy the confidence of non-repainting technology. Once a Super Reversal Pattern is detected, it remains static, providing consis
    The Th3Eng PipFinite indicator is based on a very excellent analysis of the right trend direction with perfect custom algorithms. It show the true direction and the best point to start trading. With StopLoss point and Three Take Profit points. Also it show the right pivot of the price and small points to order to replace the dynamic support and resistance channel, Which surrounds the price. And Finally it draws a very helpful Box on the left side on the chart includes (take profits and Stop loss
    The indicator displays the data of the Stochastic oscillator from a higher timeframe on the chart. The main and signal lines are displayed in a separate window. The stepped response is not smoothed. The indicator is useful for practicing "manual" forex trading strategies, which use the data from several screens with different timeframes of a single symbol. The indicator uses the settings that are identical to the standard ones, and a drop-down list for selecting the timeframe. Indicator Parame
    L'une des séquences de numéros s'appelle « Séquence des incendies de forêt ». Il a été reconnu comme l'une des plus belles nouvelles séquences. Sa principale caractéristique est que cette séquence évite les tendances linéaires, même les plus courtes. C'est cette propriété qui a constitué la base de cet indicateur. Lors de l'analyse d'une série chronologique financière, cet indicateur essaie de rejeter toutes les options de tendance possibles. Et seulement s'il échoue, il reconnaît alors la prés
    This is an arrow indicator without a future function,developed based on the most advanced profit trading algorithms.It has the most innovative and advanced dual trend analysis module, as well as the latest and highly effective market trend prediction algorithm.Trends are your friends, and following larger trends can earn the maximum profit in foreign exchange. This indicator helps traders identify current trends and track them. Someone once made a profit of 10 times in a week by relying on it.No
    Stepping Trend
    Mpendulo Chiliza
    The Stepping Trend Indicator     The Steppi ng Trend indicator uses the  average true range  (ATR indicator) in its calculation. This gives you control to set your own average true range period, I set the Default as 10.   Indicator Details. Green Arrow Up: This means you are at the starting point of a new bullish trend, it’s time to buy.   Red  Arrow  Down : This means you are at the starting point of a new  bearish  trend, it’ s time to sell .   What if you miss the Arrow Signal?   No
    Heiken Ashi candle chart is an improved version of The Japanese candle chart, which can effectively filter the market "noise" of the Japanese candle chart. It is favored by many traders for its simplicity and intuition. For trend traders, the HA candle chart is a magic tool. Unlike the traditional Japanese candle chart, Heikenashi does not reflect the opening price, high price, low price and closing price of the market. Instead, Heikenashi calculates the value of a single K line in the dominant
    Forex Gump
    Andrey Kozak
    2.4 (5)
    Forex Gump is a fully finished semi-automatic trading system. In the form of arrows, signals are displayed on the screen for opening and closing deals. All you need is to follow the instructions of the indicator. When the indicator shows a blue arrow, you need to open a buy order. When the indicator shows a red arrow, you need to open a sell order. Close orders when the indicator draws a yellow cross. In order to get the most effective result, we recommend using the timeframes H1, H4, D1. There
    What are Heiken Ashi Candles? Heiken Ashi, derived from the Japanese term 'Heikin Ashi,' translates to average price bars. It's an indicator depicting price bars on a chart. Formula for Heiken Ashi candles: - Heiken Ashi opening price: (previous candle's opening + closing price) / 2 - Closing price Heiken Ashi: (opening + high + low + closing) / 4 - Heiken Ashi peak: Max of high, opening, or closing price - Heiken Ashi bottom price: Min of low, opening, or closing price How to Read Heik
    The Penta-O is a 6-point retracement harmonacci pattern which usually precedes big market movements. Penta-O patterns can expand and repaint quite a bit. To make things easier this indicator implements a twist: it waits for a donchian breakout in the right direction before signaling the trade. The end result is an otherwise repainting indicator with a very reliable trading signal. The donchian breakout period is entered as an input. [ Installation Guide | Update Guide | Troubleshooting | FAQ | A
    Trade with Gann on your side!! MASTER CIRCLE 360 CIRCLE CHART, originally created by Gann admitted that this is “The Mother of all charts”. It is one of the last studies that this great trader left for us. The numeric tab le is apparently quite simple like all the tables and is based on square numbers, the SQUARE OF 12 and is by evolution, one of the most important square numbers. Here we can find CYCLE, PRICE AND TIME thanks to angles and grades, to show past and future support and resistance.
    Intraday Levels shows intraday levels grid for intraday trading Shows a grid for the day levels, gives you a guide to know the trend and to measure intraday trades (stop-loss and take-profit). Parameters are: Levels Mode: Basic mode: Shows highest, lowest and middle levels. Advanced mode: Shows highest, lowest, middle and intermediate levels. Fibonacci mode: Shows session Fibonacci retracements levels. Momentum mode: Shows delayed Advanced levels to identify momentum. Smooth Period (Momentum
    Trendiness Index
    Libertas LLC
    5 (3)
    "The trend is your friend" is one of the best known sayings in investing, because capturing large trendy price movements can be extremely profitable. However, trading with the trend is often easier said than done, because many indicators are based on price reversals not trends. These aren't very effective at identifying trendy periods, or predicting whether trends will continue. We developed the Trendiness Index to help address this problem by indicating the strength and direction of price trend
    We present you the indicator "Candle closing counter", which will become your indispensable assistant in the world of trading. That’s why knowing when the candle will close can help: If you like to trade using candle patterns, you will know when the candle will be closed. This indicator will allow you to check if a known pattern has formed and if there is a possibility of trading. The indicator will help you to prepare for market opening and market closure. You can set a timer to create a p
    Alpha Trend sign est notre outil de Trading très populaire depuis longtemps, il valide notre système de Trading et invite clairement les signaux de Trading sans dérive. Fonctions principales: • En fonction de la zone active du marché, selon les indicateurs, il est intuitif de déterminer si le cours actuel appartient à la tendance ou à la tendance. Et coupez le marché selon les flèches d'indication de l'indicateur, les flèches vertes suggèrent d'acheter et les flèches rouges suggèrent de v
    For sure, this indicator has become very popular amongst traders. Through coding this indicator will give you the most accurate levels possible for your trading analysis. We have also added in the ability for you to receive alerts when the price breaks above or below a Support or Resistance lines! HOW TO USE The red rectangles represent your resistance/supply zone. The green rectangles represent your support/demand zone.  BONUS FEATURES We coded this indicator with the ability to switch between
    Power Renko is an indicator which plots Renko bricks underneath the chart using a histogram. You can select the brick size and the timeframe of the Renko bricks as well as whether or not to use the close price or the high/low price of the candles. Renko bricks are based on price alone, not time, therefor the Renko bricks will not be aligned with the chart's time. They are extremely useful for trend trading and many different strategies can be formed from them. Buffers are provided allowing you t
    TWO PAIRS SQUARE HEDGE METER INDICATOR Try this brilliant 2 pairs square indicator It draws a square wave of the relation between your two inputs symbols when square wave indicates -1 then it is very great opportunity to SELL pair1 and BUY Pair2 when square wave indicates +1 then it is very great opportunity to BUY pair1 and SELL Pair2 the inputs are : 2 pairs of symbols         then index value : i use 20 for M30 charts ( you can try other values : 40/50 for M15 , : 30 for M30 , : 10 for H1 ,
    Trading Sessions Advanced
    Tumelo Patrick Rakotsoane
    4 (1)
    Trading Session Advanced This indicator was designed to indicate trading sessions in a chart. It draws boxes for each trading session in different colours. Trading Sessions: - London Session - New York Session - Tokyo Session - Sydney Session Some currencies are best traded during certain trading sessions. - EUR, GBP & CHF currencies have high volatility during London session.  - USD & CAD currencies have high volatility during New York session. - AUD, NZD & JPY currencies have high volatili
    Signal trend indicator. Detects the direction of the trend and is coloured accordingly.  Has built in audible and visual alerts when trends change. Can send notifications to your phone or email. Allows Trend and Counter-Trend trading. Works on all timeframes, all currency pairs, metals, indices and cryptocurrencies. Can be used with binary options. Distinctive features No re-drawing; Simple and clear settings; Four types of alerts; Works on all timeframes and all trading tools; Su
    Shark Deal Book
    Philip Pankaj Suthagar
    4 (3)
    Term  "shark"  in the business world denotes a high volume investor who just made a good investment in a highly Potential business deal.So, sharks are the ones who make the market move. In our case, if an American shark bought a Japanese company, he/she has to convert American dollars into Japanese yen to make the deal. So, the demand for the Japanese yen will increase sharply. Thus USD/JPY will go short rapidly if the deal was from the shark. Another example, In the case of forex, if fed increa
    Rasoir de marché   Scalpeur de marché Cet indicateur fait partie des systèmes RPTrade Pro Solutions. Market Scalper est un indicateur de tendance quotidien utilisant Price Action, Dynamic Support et Resistances. Il est conçu pour être utilisé par n'importe qui, même le débutant absolu en trading peut l'utiliser. Ne JAMAIS repeindre. Les indications sont données de près à près. Conçu pour être utilisé seul, aucun autre indicateur n'est requis. Vous donne des indications claires et simples
    TrendPlus
    Sivakumar Subbaiya
    4 (13)
    Trend Plus   Trendplus  Indicator   Time Frame: Suitable for any time frame.  Purpose: Trend Prediction. Blue and red candle indicate the buy and sell call respectively. Buy: When the blue candle is formed buy call is initiated. close the buy trades when the next red candle will formed.   Sell: When the Red candle is formed Sell call is initiated. close the Sell trades when the next blue candle will formed.   Happy trade!!
    FREE
    Trend Ray
    Andriy Sydoruk
    The indicator shows the potential trend direction by cyclical-wave dependence. Thus, all the rays of the intersection will be optimal rays, in the direction of which the price is expected to move, taking into account the indicator period. Rays can be used as a direction for potential market movement. But we must not forget that the approach must be comprehensive, the indicator signals require additional information to enter the market.
    Matrixs
    Andriy Sydoruk
    Matrix is a Forex arrow indicator. Displays signals simply and clearly! The arrows show the direction of the transaction, and are colored accordingly, which can be seen in the screenshots. As you can see, trading with such an indicator is easy. I waited for an arrow to appear in the desired direction - I opened a deal. An arrow formed in the opposite direction - closed the deal. The indicator also displays the lines with the help of which the arrow signals are formed, taking into account the int
    Les acheteurs de ce produit ont également acheté
    TPSproTREND PrO
    Roman Podpora
    4.79 (19)
    TPSpro TREND PRO   est un indicateur de tendance qui analyse automatiquement le marché et fournit des informations sur la tendance et chacun de ses changements, ainsi que des signaux pour entrer dans des transactions sans redessiner ! L'indicateur utilise chaque bougie et les analyse séparément. faisant référence à différentes impulsions - impulsion ascendante ou descendante. Points d'entrée précis dans les transactions sur les devises, les crypto-monnaies, les métaux, les actions, les indices 
    Dynamic Forex28 Navigator
    Bernhard Schweigert
    5 (2)
    Dynamic Forex28 Navigator - L'outil de trading Forex de nouvelle génération. ACTUELLEMENT 49 % DE RÉDUCTION. Dynamic Forex28 Navigator est l'évolution de nos indicateurs populaires de longue date, combinant la puissance de trois en un : Advanced Currency Strength28 Indicator (695 avis) + Advanced Currency IMPULSE avec ALERT (520 avis) + CS28 Combo Signals (Bonus). Détails sur l'indicateur https://www.mql5.com/en/blogs/post/758844 Qu'offre l'indicateur de force de nouvelle génération ? T
    Ultimate Index Advisor est un outil avancé conçu pour analyser les mouvements du marché avec précision et identifier dynamiquement les opportunités de trading. L'indicateur offre des signaux basés sur une combinaison de stratégies optimisées pour les tendances, les corrections et les retournements, le rendant polyvalent pour différents styles de trading. Avec une interface intuitive, Ultimate Index Advisor met en évidence des points d'entrée et de sortie clairs grâce à des flèches visibles sur
    TPSpro RFI Levels
    Roman Podpora
    4.82 (22)
    INSTRUCTIONS       RUS   -   ANGLAIS       Il   est recommandé de l'utiliser avec un indicateur       -       TPSpro   TENDANCE PRO -   Version MT4         Un élément clé du trading est constitué par les zones ou les niveaux à partir desquels les décisions d'achat ou de vente d'un instrument de trading sont prises. Malgré les tentatives des principaux acteurs de dissimuler leur présence sur le marché, ils laissent inévitablement des traces. Notre tâche était d'apprendre à identifier ces traces
    Connect Indicator
    Sukunthakan Ngernbamrung
    Connect Indicator is a tool used for connecting indicators between the MQL market and MT4. The connected indicators are made by our group and can be used for other applications, such as sending messages to the Line application or Telegram application. If you have any questions, please don't hesitate to ask us to receive support. Function and indicator buffer Buffer one is the high price of the previous candle. Buffer two is the high price of the previous candle. Usage To connect indicators to fu
    Entry Arrow Alerts: Finds market entry opportunities then notifies you via mobile or desktop alerts The key features include: Conservative mode . One entry signal per direction. Ideal for the patient trader looking to capture longer term moves. Aggressive mode . Multiple possible entry signals per direction. Ideal for the active trader looking to capture multiple moves within the same trend. Trigger Line . Price entry line helps cut down on false signals. Display Window . Allows you to instantly
    Supply and Demand Dashboard PRO
    Bernhard Schweigert
    4.8 (20)
    Actuellement 20% de réduction ! Ce tableau de bord est un logiciel très puissant qui fonctionne sur plusieurs symboles et jusqu'à 9 horizons temporels. Il est basé sur notre indicateur principal (Best reviews : Advanced Supply Demand ).   Le tableau de bord donne une excellente vue d'ensemble. Il montre :  Les valeurs d'offre et de demande filtrées, y compris l'évaluation de la force de la zone, Les distances en pips vers/et dans les zones, Il met en évidence les zones imbriquées, Il donne
    TrendMaestro
    Stefano Frisetti
    5 (3)
    note: this indicator is for METATRADER4, if you want the version for METATRADER5 this is the link:  https://www.mql5.com/it/market/product/108106 TRENDMAESTRO ver 2.4 TRENDMAESTRO recognizes a new TREND in the bud, he never makes mistakes. The certainty of identifying a new TREND is priceless. DESCRIPTION TRENDMAESTRO identifies a new TREND in the bud, this indicator examines the volatility, volumes and momentum to identify the moment in which there is an explosion of one or more of these data a
    VEUILLEZ LIRE LES INFORMATIONS CI-DESSOUS AVANT D'ACHETER LE PRODUIT! Apollo Pips PLUS SP est un produit unique! C'EST POUR CEUX QUI VEULENT OBTENIR MON NOUVEL INDICATEUR "APOLLO PIPS" PLUS BONUS "SUPER PACK" AVEC ACCÈS À TOUS MES INDICATEURS DE TRADING! En achetant le produit Apollo Pips PLUS SP, vous achetez en fait une toute nouvelle version de mon indicateur Apollo Pips. Cette version de l'indicateur dispose d'un algorithme amélioré et d'un paramètre facile à utiliser qui vous donne la possi
    Currently Price 20% OFF ( for unlimited use )   BONUS  AUX VIP Club 2024 : Include  EA Airbag  and  Load Data History  to enhance the performance of this tool to its maximum potential  Click Here to Download Files   ( for users only )   Hello World! Introducing.. SMCpro VIP tool and Indicator for MetaTrader 4, designed to revolutionize your trading experience with the ICT Smart Money Concept. This system is meticulously crafted to empower traders with advanced insights and precision in
    Line Magnit
    Aleksey Trenin
    The LineMagnit Indicator for MT4 is a highly precise tool that builds support and resistance levels which magnetically attract prices. This feature allows traders to easily determine the most probable entry and exit points in the market, as well as identify the market's directional forces, as levels are based on capital inflows into the instrument. Equipped with an intuitively understandable graphical interface, the LineMagnit Indicator enables users to quickly locate and analyze support and res
    TheStrat Monitor
    Robert Gerald Wood
    3 (2)
    If you've not already learnt about The Strat trading strategy , go google it now. I promise it won't be a waste of your time, and you will likely learn some new tricks whether you use it or not. OK, so now you know what TheStrat is, you will be able to understand what this indicator can do for you. Key Features In short, the Indicator will: Show Timeframe Continuity for all supported timeframes Supports two timeset views, Day trader and Swing trader Show when Full Timeframe Continuity is in pl
    Enigmera
    Ivan Stefanov
    5 (3)
    ENIGMERA : Le cœur du marché https://www.enigmera.com Introduction Cet indicateur et ce système de trading constituent une approche remarquable des marchés financiers. ENIGMERA utilise les cycles fractals pour calculer avec précision les niveaux de support et de résistance. Il indique la phase d'accumulation authentique et donne une direction et des objectifs.  Un système qui fonctionne que nous soyons dans une tendance ou une correction.  Comment fonctionne-t-il ? ENIGMERA comprend trois l
    NAM Order Blocks
    NAM TECH GROUP, CORP.
    5 (1)
    MT4 Multi-timeframe Order Blocks detection indicator. Features - Fully customizable on chart control panel, provides complete interaction. - Hide and show control panel wherever you want. - Detect OBs on multiple timeframes. - Select OBs quantity to display. - Different OBs user interface. - Different filters on OBs. - OB proximity alert. - ADR High and Low lines. - Notification service (Screen alerts | Push notifications). Summary Order block is a market behavior that indicates order collection
    RelicusRoad Pro
    Relicus LLC
    4.64 (102)
    Maintenant 147 $ (augmentant à 499 $ après quelques mises à jour) - Comptes illimités (PCS ou Mac) Manuel d'utilisation RelicusRoad + Vidéos de formation + Accès au groupe Discord privé + Statut VIP UNE NOUVELLE FAÇON DE REGARDER LE MARCHÉ RelicusRoad est l'indicateur de trading le plus puissant au monde pour le forex, les contrats à terme, les crypto-monnaies, les actions et les indices, offrant aux traders toutes les informations et tous les outils dont ils ont besoin pour rester renta
    Gold Channel is a volatility-based indicator, developed with a specific timing algorithm for the XAUUSD pair, which consists of finding possible corrections in the market. This indicator shows two outer lines, an inner line (retracement line) and an arrow sign, where the theory of the channel is to help identify overbought and oversold conditions in the market. The market price will generally fall between the boundaries of the channel. If prices touch or move outside the channel it is a tra
    The Stochastic Basket Currency Strenght  brings the Stochastic indicator to a new level.  Expanding the boundaries of TimeFrames and mono-currency analysis, the SBCS take the movements of each currency that composes the cross and confront them in the whole basket of 7 crosses.  The indicator works with any combination of AUD, CAD, CHF, EUR, GBP, JPY, NZD, USD pairs and with full automation takes in account every stochastic value (main line) for the selected Time Frame.  After that, the indicator
    Actuellement 20% de réduction ! La meilleure solution pour tout débutant ou trader expert ! Ce logiciel de tableau de bord fonctionne sur 28 paires de devises. Il est basé sur 2 de nos principaux indicateurs (Advanced Currency Strength 28 et Advanced Currency Impulse). Il donne un excellent aperçu de l'ensemble du marché Forex. Il montre les valeurs de l'Advanced Currency Strength, la vitesse de mouvement des devises et les signaux pour 28 paires de devises dans tous les (9) délais. Imagine
    Nous vous présentons ON Trade Waves Patterns Harmonic Elliot Wolfe, un indicateur avancé conçu pour détecter divers types de schémas sur le marché à l'aide de méthodes manuelles et automatiques. Voici comment il fonctionne : Schémas Harmoniques : Cet indicateur peut identifier les schémas harmoniques qui apparaissent sur votre graphique. Ces schémas sont essentiels pour les traders qui pratiquent la théorie du trading harmonique, telle qu'elle est décrite dans le livre de Scott Carney "Harmonic
    (Currently 30% OFF) Before reading the description of this indicator, I just want to introduce to you following concept Moving Average Line - Typical moving average which is based on one chart alone.  Currency Strength Line - The moving average of a certain pair in which the strength is based on 28 pairs. Can be said as the real moving average line. Moving Average indeed is one of the most popular indicator which almost every trader use. Currency Strength Meter is also a trend indicator whic
    How to use Pair Trading Station Pair Trading Station is recommended for H1 time frame and you can use it for any currency pairs. To generate buy and sell signal, follow few steps below to apply Pair Trading Station to your MetaTrader terminal. When you load Pair Trading Station on your chart, Pair Trading station will assess available historical data in your MetaTrader platforms for each currency pair. On your chart, the amount of historical data available will be displayed for each currency pai
    Cet indicateur est un indicateur d'analyse automatique des vagues, parfait pour le trading pratique ! Cas... Remarque :   je n'ai pas l'habitude d'utiliser des noms occidentaux pour l'évaluation des vagues. En raison de l'influence de la convention de dénomination de Tang Lun (Tang Zhong Shuo Zen), j'ai nommé la vague de base comme   un stylo   et la bande d'onde secondaire comme   un segment   . en même temps, le segment a la direction de la tendance.Le   segment de tendance principal   est n
    Jeslyn
    Justine Kelechi Ekweh
    Il s'agit d'un système polyvalent qui convient à la fois aux traders manuels du Forex, soit comme système de scalper, soit comme stratégie pour entrer dans une très forte dynamique, les traders d'options binaires ou pour être utilisé par les EA universels dans le trading automatisé. Jeslyn est une stratégie basée sur des années de recherche et se concentre sur une stratégie d'action de prix particulière. Cela peut ressembler à un simple indicateur de flèche, mais il a des algorithmes sophi
    Bomb Bank Signal
    Igor Pereira Calil
    5 (1)
    Signal Bomb Bank : votre indicateur de confiance dans MetaTrader 4 Bomb Bank Signal est un indicateur puissant pour MetaTrader 4, conçu pour identifier les tendances les plus pertinentes du marché financier. Si vous recherchez un outil qui anticipe avec précision les mouvements, la Bomb Bank est l’alliée qu’il vous faut. Comment ça marche : Cet indicateur combine trois méthodes distinctes – analyse de volume, clôture de bougie et tendance symétrique – pour détecter et signaler les opportu
    SR arrows liquid lines
    Teresinha Moraes Correia
    In the fifth update , the indicator now aims to predict the direction of the next candle, issuing a buy or sell arrow precisely when the conditions are met. Since its first version, which showed support and resistance levels on the chart, up to the current version 5, many improvements have been made. One of the key changes is the removal of visual support and resistance levels to prevent memory overload. This is no longer necessary, as arrows are now issued when the price is near or touches t
    TPA True Price Action indicator reveals the true price action of the market makers through 100% non-repainting signals (except early signals mode) strictly at the close of a candle! TPA shows entries and re-entries, every time the bulls are definitely stronger than the bears and vice versa. Not to confuse with red/green candles. The shift of power gets confirmed at the earliest stage and is ONE exit strategy of several. There are available now two free parts of the TPA User Guide for our custo
    Oscillateur de Tendance : Identification Fluide et Fiable des Tendances de Marché L’Oscillateur de Tendance est un indicateur avancé pour MT4, conçu pour aider les traders à identifier avec précision la direction de la tendance et les points de retournement potentiels. Avec une représentation visuelle intuitive, cet indicateur montre clairement quand le marché est en tendance haussière ou baissière, simplifiant ainsi l’analyse et améliorant la lisibilité du graphique. Adapté à une grande variété
    MR Reversal Patterns 4
    Sergey Khramchenkov
    5 (2)
    In the "Masters of Risk" trading system, one of the main concepts is related to places where markets change direction. In fact, this is a change in priority and a violation of the trend structure at the extremes of the market, where supposedly there are or would be stop-losses of "smart" participants who are outside the boundaries of the accumulation of volume. For this reason, we call them "Reversal Patterns" - places with a lot of weight for the start of a new and strong trend. Some of the imp
    PipTick VSA MT4
    Michal Jurnik
    1 (2)
    The   Volume Spread Analysis indicator   is based on the original Volume Spread Analysis method. It was designed for quick and easy recognition of VSA patterns. Even though this indicator looks very simple, it is the most sophisticated tool we've ever made. It is a really powerful analytical tool that generates very reliable trading signals. Because it is very user-friendly and understandable, it is suitable for every type of trader, regardless of his experience. What is VSA? VSA - Volume Spr
    Volume by Price MT4
    Brian Collard
    4.6 (10)
    The Volume by Price Indicator for MetaTrader 4 features Volume Profile and Market Profile TPO (Time Price Opportunity). Volume and TPO histogram bar and line charts. Volume Footprint charts. TPO letter and block marker collapsed and split structure charts. Static, dynamic and flexible range segmentation and compositing methods with relative and absolute visualizations. Session hours filtering and segment concatenation with Market Watch and custom user specifications. Graphical layering, positio
    Plus de l'auteur
    Custom Alerts MT5
    Daniel Stein
    5 (2)
    Custom Alerts est un outil polyvalent de surveillance multi-marchés qui identifie les configurations prometteuses sur les huit principales devises (USD, CAD, GBP, EUR, CHF, JPY, AUD et NZD), ainsi que sur le GOLD (XAU), les 28 paires Forex et GOLD basées sur ces devises, et jusqu'à sept indices tels que US30, UK100, WTI, Bitcoin, etc. Il est entièrement personnalisable. L'outil rassemble les données de nos indicateurs FX Power, FX Volume et IX Power et vous informe des événements importants.  
    FX Power MT5 NG
    Daniel Stein
    4.75 (8)
    Déverrouillez toute la puissance de FX Power NG : l'ultime mesureur de force des devises Depuis plus de huit ans, FX Power permet aux traders du monde entier de bénéficier d'une analyse fiable et précise de la force des devises. Aujourd'hui, FX Power NG fait passer cet outil de confiance au niveau supérieur, en offrant des fonctionnalités avancées qui apportent une précision, une personnalisation et des informations inégalées à votre trading. Qu'est-ce qui fait de FX Power NG un outil indisp
    FX Power MT4 NG
    Daniel Stein
    5 (14)
    Déverrouillez toute la puissance de FX Power NG : l'ultime mesureur de force des devises Depuis plus de huit ans, FX Power permet aux traders du monde entier de bénéficier d'une analyse fiable et précise de la force des devises. Aujourd'hui, FX Power NG fait passer cet outil de confiance au niveau supérieur, en offrant des fonctionnalités avancées qui apportent une précision, une personnalisation et des informations inégalées à votre trading. Qu'est-ce qui fait de FX Power NG un outil indisp
    FX Volume MT5
    Daniel Stein
    4.93 (14)
    Obtenez un véritable avantage sur le Forex avec FX Volume : L'indicateur de volume ultime FX Volume est le premier et le seul indicateur de volume à révéler le véritable sentiment du marché d'un point de vue d'initié. En fournissant des informations uniques sur la façon dont les acteurs institutionnels du marché et les courtiers sont positionnés, FX Volume vous permet de négocier avec la prévoyance habituellement réservée aux acteurs majeurs. Dites adieu aux délais des rapports COT - FX Volume
    Custom Alerts MT4
    Daniel Stein
    5 (1)
    Custom Alerts est un outil polyvalent de surveillance multi-marchés qui identifie les configurations prometteuses sur les huit principales devises (USD, CAD, GBP, EUR, CHF, JPY, AUD et NZD), ainsi que sur le GOLD (XAU), les 28 paires Forex et GOLD basées sur ces devises, et jusqu'à sept indices tels que US30, UK100, WTI, Bitcoin, etc. Il est entièrement personnalisable. L'outil rassemble les données de nos indicateurs FX Power, FX Volume et IX Power et vous informe des événements importants.  
    FX Levels est un indicateur de support et de résistance exceptionnellement précis qui fusionne la méthode traditionnelle Lighthouse avec une approche dynamique innovante, fonctionnant parfaitement sur tous les symboles de trading. Cela inclut les paires de devises, les indices, les actions ou les matières premières. FX Levels identifie les points d'inversion et les affiche sur le graphique, qui peuvent être idéalement utilisés comme cibles de profit dans vos activités de trading. Pour développe
    FX Levels est un indicateur de support et de résistance exceptionnellement précis qui fusionne la méthode traditionnelle Lighthouse avec une approche dynamique innovante, fonctionnant parfaitement sur tous les symboles de trading. Cela inclut les paires de devises, les indices, les actions ou les matières premières. FX Levels identifie les points d'inversion et les affiche sur le graphique, qui peuvent être idéalement utilisés comme cibles de profit dans vos activités de trading. Pour développe
    IX Power MT4
    Daniel Stein
    4.67 (6)
    IX Power apporte enfin la précision imbattable de FX Power aux symboles non-Forex. Il détermine avec précision l'intensité des tendances à court, moyen et long terme de vos indices, actions, matières premières, ETF et même crypto-monnaies préférés. Vous pouvez analyser tout ce que votre terminal a à offrir. Essayez-le et découvrez comment votre timing s'améliore considérablement lors de vos transactions. Caractéristiques principales d'IX Power Résultats de calcul précis à 100 %, sans ré
    IX Power MT5
    Daniel Stein
    4.17 (6)
    IX Power   apporte enfin la précision imbattable de FX Power aux symboles non-Forex. Il détermine avec précision l'intensité des tendances à court, moyen et long terme de vos indices, actions, matières premières, ETF et même crypto-monnaies préférés. Vous pouvez   analyser tout ce que   votre terminal a à offrir. Essayez-le et découvrez comment   votre timing s'améliore considérablement   lors de vos transactions. Caractéristiques principales d'IX Power Résultats de calcul précis à 100 %,
    FX Trend
    Daniel Stein
    4.8 (94)
    Vous voulez devenir un trader forex 5 étoiles constamment rentable ? 1. Lisez la description de base de notre système de trading simple et la mise à jour majeure de sa stratégie en 2020 2. Envoyez une capture d'écran de votre achat pour recevoir votre invitation personnelle à notre chat de trading exclusif FX Trend affiche la direction de la tendance, sa durée, son intensité et l'évaluation de la tendance qui en résulte pour tous les cadres temporels en temps réel. Vous verrez d'un coup d'œi
    Taurus MT5
    Daniel Stein
    5 (1)
    Taurus symbolise l'apogée des efforts déployés pour affiner la stratégie déjà efficace du retour à la moyenne, en tirant parti de nos données uniques sur les volumes de transactions réels. Il négocie chaque symbole en utilisant ses meilleurs paramètres uniques, offrant un rapport risque/récompense exceptionnel et une expérience de négociation équilibrée et sans stress pour ses utilisateurs. Faits marquants Stratégie de retour à la moyenne basée sur des données uniques de volume réel Gestion sér
    FX Trend MT5
    Daniel Stein
    4.63 (32)
    Vous voulez devenir un trader forex 5 étoiles constamment rentable ? 1.   Lisez la description de base de notre   système de   trading simple et   la mise à jour majeure de sa stratégie en 2020 2.   Envoyez une capture d'écran de votre achat pour recevoir votre invitation personnelle à notre chat de trading exclusif FX Trend   affiche la direction de la tendance, sa durée, son intensité et l'évaluation de la tendance qui en résulte pour tous les cadres temporels en temps réel. Vous verrez d'u
    Vous voulez devenir un trader forex 5 étoiles constamment rentable ? 1. Lisez la description de base de notre système de trading simple et  de  sa mise à jour stratégique majeure en 2020 2. Envoyez une capture d'écran de votre achat pour obtenir votre invitation personnelle à notre chat de trading exclusif Ce gestionnaire de trades est le complément idéal pour tous les utilisateurs de FX Trend qui souhaitent utiliser une gestion des trades entièrement automatisée. Il détecte immédiatement
    Trade Manager MT5
    Daniel Stein
    4.33 (3)
    Vous voulez devenir un trader forex 5 étoiles constamment rentable ? 1.   Lisez la description de base de notre   système de   trading simple   et  de  sa mise à jour stratégique majeure en 2020 2.   Envoyez une capture d'écran de votre achat pour obtenir votre invitation personnelle à notre chat de trading exclusif Ce gestionnaire de trades   est le complément idéal pour tous les utilisateurs de   FX Trend   qui souhaitent utiliser une gestion des trades entièrement automatisée. Il détecte
    Taurus MT4
    Daniel Stein
    Taurus symbolise l'apogée des efforts déployés pour affiner la stratégie déjà efficace du retour à la moyenne, en tirant parti de nos données uniques sur les volumes de transactions réels. Il négocie chaque symbole en utilisant ses meilleurs paramètres uniques, offrant un rapport risque/récompense exceptionnel et une expérience de négociation équilibrée et sans stress pour ses utilisateurs. Faits marquants Stratégie de retour à la moyenne basée sur des données uniques de volume réel Gestion sér
    Crosshair est un outil fantastique qui simplifie notre analyse graphique en alignant parfaitement les bougies de prix avec les valeurs des indicateurs dans les sous-fenêtres. Vous pouvez l'activer et le désactiver par une simple pression sur la touche "C" de votre clavier, et il offre un mode règle pour des mesures précises qui peut être activé et désactivé par la touche "R" de votre clavier. Veuillez regarder notre court tutoriel vidéo intégré ci-dessous pour voir comment il fonctionne.
    Crosshair est un outil fantastique qui simplifie notre analyse graphique en alignant parfaitement les bougies de prix avec les valeurs des indicateurs dans les sous-fenêtres. Vous pouvez l'activer et le désactiver par une simple pression sur la touche "C" de votre clavier, et il offre un mode règle pour des mesures précises qui peut être activé et désactivé par la touche "R" de votre clavier. Veuillez regarder notre court tutoriel vidéo intégré ci-dessous pour voir comment il fonctionne.
    SI Connect MT5
    Daniel Stein
    5 (3)
    SI Connect est un utilitaire qui établit la connexion à nos serveurs pour utiliser FX Volume ou les systèmes de trading SIEA. Instructions techniques pour préparer votre terminal à l'utilisation de SI Connect Autorisez les requêtes web et insérez https://stein.investments dans la liste des URLs autorisées dans votre Terminal Options -> Subcategory Expert Advisors . Vous n'avez besoin que d'une seule instance d'EA par terminal, mais elle doit fonctionner constamment en arrière-plan pour récupér
    FREE
    SI Connect
    Daniel Stein
    5 (1)
    SI Connect est un utilitaire qui établit la connexion à nos serveurs pour utiliser FX Volume ou les systèmes de trading SIEA. Instructions techniques pour préparer votre terminal à l'utilisation de SI Connect Autorisez les requêtes web et insérez https://stein.investments dans la liste des URLs autorisées dans votre Terminal Options -> Subcategory Expert Advisors . Vous n'avez besoin que d'une seule instance d'EA par terminal, mais elle doit fonctionner constamment en arrière-plan pour récupér
    FREE
    SIEA Zen MT4
    Daniel Stein
    SIEA ZEN - major update   Live signals We recommend using the SIEA MT5 versions to run realistic real-tick multi-symbol backtest. TRADING STYLE SIEA ZEN   trades all 28 trading pairs based on the 8 major currencies, USD, CAD, EUR, CHF, GBP, AUD, NZD, and JPY. Our unique volume analysis determines market imbalance and how intense they are to spot reverse entry opportunities. SIEA ZEN  closes all its positions at the end of every month and starts a new cycle at the beginning of the ne
    SIEA PRO NG est la nouvelle génération de SIEA PRO et est entièrement différent de tous les EA précédents de notre société. Les prix indiqués sont des prix réduits pour le lancement de SIEA PRO NG sur le marché ! Veuillez utiliser la version MT5 de SIEA PRO NG pour effectuer un backtest multi-symboles en temps réel. Les faits marquants en un coup d'œil négocie une stratégie de retour à la moyenne basé sur 5 années complètes de nos données uniques de volume réel chaque transaction est assortie
    SIEA Zen
    Daniel Stein
    4 (4)
    SIEA ZEN - major update   Default risk live signal     Dynamic risk live signal TRADING STYLE SIEA ZEN trades all 28 trading pairs based on the 8 major currencies, USD, CAD, EUR, CHF, GBP, AUD, NZD, and JPY. Our unique volume analysis determines market imbalance and how intense they are to spot reverse entry opportunities. SIEA ZEN  closes all its positions at the end of every month and starts a new cycle at the beginning of the next month. In this way, we'll achieve an awesome
    SIEA Pro MT5 NG
    Daniel Stein
    4.5 (2)
    SIEA PRO NG est la nouvelle génération de SIEA PRO et est entièrement différent de tous les EA précédents de notre société. Les prix indiqués sont des prix réduits pour le lancement de SIEA PRO NG sur le marché ! Les faits principaux en un coup d'œil négocie une stratégie de retour à la moyenne basé sur 5 années complètes de nos données uniques de volume réel chaque transaction est assortie d'un stop loss et d'un take profit fixes la durée moyenne des transactions est inférieure à 48 heures d
    Filtrer:
    Kabelo Mataboge
    63
    Kabelo Mataboge 2024.07.10 18:12 
     

    When applied correctly, FX volume is almost 100% accurate in terms of direction. Adding a solid entry strategy has significantly improved my trading win rate. I'm pleased to have found a reliable trading indicator after testing and using over 1,000 repainting, recalculating, and unreliable indicators. Please, Daniel, keep up the excellent work and product.

    Daniel Stein
    95118
    Réponse du développeur Daniel Stein 2024.07.10 21:51
    Dear Kabelo, thank you so much for this wonderful feedback. It's highly appreciated. 🙏🙂
    Ingo Reimann
    223
    Ingo Reimann 2023.12.21 16:13 
     

    The best and most precise product that I have had the pleasure of getting to know in my trading career. I can recommend it to everybody. Since I started using these products, trading has also been working. The support from the developers and the community are also in a class of their own.

    Daniel Stein
    95118
    Réponse du développeur Daniel Stein 2023.12.21 16:27
    Dear Ingo, thank you very much for your outstanding feedback. It's highly appreciated, and we're more than happy having members like you in our trading group. 🙂
    Tim Eubanks
    5762
    Tim Eubanks 2023.08.31 02:51 
     

    Very ineffective tool!

    Daniel Stein
    95118
    Réponse du développeur Daniel Stein 2023.08.31 07:31
    And for me, it's the most efficient tool because it tells me exactly when it's worth looking at the market.
    If you like to know how I use FX Volume for my daily manual trading, I suggest taking a look at my Volume Power description at https://www.mql5.com/en/blogs/post/753806 You can also subscribe to our Morning Briefing channel to get daily updates, details and screenshots at https://www.mql5.com/en/channels/morningbriefing
    Both help to get a better understanding of how to work with FX Volume.
    Juan Chacon
    1229
    Juan Chacon 2022.11.16 21:16 
     

    I bought it twice and it was a waste of time and money, please do not spend your money, my advice is to use stop loss and exceed the profit ratio.

    Daniel Stein
    95118
    Réponse du développeur Daniel Stein 2023.08.25 19:41
    Dear Juan, I don't understand how Volume is related to using a stop loss. And why did you never raise any questions about how to use this kind of real-market data? I recommend taking a look at my Volume Power description at https://www.mql5.com/en/blogs/post/753806 which explains in all details how I use FX Volume for trading. You can also subscribe to our Morning Briefing channel to get daily updates, details and screenshots at https://www.mql5.com/en/channels/morningbriefing And finally, we do have FX Volume info channel on Telegram at https://t.me/SI_FX_Volume to understand in-depth what FX Volume is about
    3316589p
    870
    3316589p 2022.08.29 20:34 
     

    Hi Daniel, Great indicator used in conjunction with Fx Power, an invite for the the chat group would be appreciated

    Daniel Stein
    95118
    Réponse du développeur Daniel Stein 2022.08.29 20:54
    Thanks a lot for your positive feedback. I sent you an invitation via private message. Best regards, Daniel
    wuzzy66
    922
    wuzzy66 2022.07.02 09:41 
     

    Another excellent product from Daniel who is the creator this indicator lets you make informed Decision ASAP when you know the volume of the trade is been concentrated on tried it on Gold excellent it showed be that there was more volume on the Dollar than Gold and took straight a sell position which paid off no more guess work with this indicator combing it other tools such as the FX power

    Daniel Stein
    95118
    Réponse du développeur Daniel Stein 2022.07.02 18:18
    Thanks a lot for your detailed review and excellent feedback. It's highly appreciated.👍
    Carlos Alexandre Ribeiro Da Silva
    376
     

    Excellent indicator, I resubscribed it because it is not the entry trigger, but the "certainty" of the market direction. It brings you the peace of mind of following the big players. Not to mention the support of all Daniel's products. More than I recommend!!!

    Daniel Stein
    95118
    Réponse du développeur Daniel Stein 2022.07.02 18:17
    Thanks a lot for your wonderful review. 👍
    Thomas Bradley Butler
    30898
    Thomas Bradley Butler 2022.03.29 19:50 
     

    maybe long term but not for day trading. Long +6000 USD and -300 GBP with 62% long USD and 30% long GBP. Should sell GBP/USD but it does the opposite. Really just confusion. lost most of the trades with the volume

    Daniel Stein
    95118
    Réponse du développeur Daniel Stein 2022.07.02 18:16
    Hi Thomas, I recommend having a look at its info channel to get a better understanding of how to use FX Volume https://t.me/SI_FX_Volume
    josedan
    325
    josedan 2022.01.31 15:52 
     

    This is the best tool as far as am concerned.. As a trend trader, you need volume and all what I see in the market is tick volume.. Daniel was able to come up with this amazing tool and the tool has made me realize that what I was taught by NNFX about tick volume is garbage... So many people criticise the tool for being lagging but I differ... Fxvolume is not lagging, you have to find a way as per how to use it so as to fit it into your system... I am only pleading with him to include minute comparison because it is what I use in entering trade in time... Please Daniel include minute comparison. I contacted Daniel about including minute comparison which he earlier promised to include but he said the update does not gather enough momentum and directed me to use history lines... I do use history lines but it is stressful... Please include minute comparison in the tool for me.. Daniel and co.... have reached out to me as per the minute comparison... They have promised to look into it... I must commend them for excellent customer service delivery.. Daniel has been so helpful in helping me as per answering my questions.. Yes, the requested feature is there in the updated version... I do really like it

    Daniel Stein
    95118
    Réponse du développeur Daniel Stein 2022.04.01 14:36
    Dear Jose, the requested feature has been released with version 4.0. We're sure you'll like it.
    victor9090
    637
    victor9090 2021.12.09 23:10 
     

    Simplemente voy a decir una palabra: Gracias! He encontrado lo que siempre he querido. Simplemente maravilloso trabajo y lo seguiré pagando por muchos años mas.

    MILAD ORANGI
    117
    MILAD ORANGI 2021.12.09 21:42 
     

    Unfortunately, the support was not as good as I thought and will not be updated

    Daniel Stein
    95118
    Réponse du développeur Daniel Stein 2021.12.24 12:42
    Dear Milad, you can't request a new feature and expect to get it immediately. Of course, we improve and update our tools regularly, but we follow our schedule, not yours.
    motsusi
    170
    motsusi 2021.08.12 01:46 
     

    Fx Pqwer assisted me great deal with my trading but is limited to currencies. As I ventured into gold, I realised there was a huge gap left by absence of Fx Power. I reluctantly purchased Fx Volume as it covers gold. That has been one of my best ever decisions in trading this year. Fx Vlolume coupled with Fx Trend is indeed a masterpiece. Than you Daniel for this 35th century innovation.

    Zachary David Cox
    928
    Zachary David Cox 2021.04.12 14:10 
     

    Very helpful and well done indicator. Thanks

    cicas65
    220
    cicas65 2021.03.10 10:35 
     

    Un'unica parola per descrivere l'estro di Daniel: Stupefacente! Tutti i prodotti di altissimo livello. Complimenti Daniel sei un grande! One word to describe Daniel's inspiration: Amazing! All products of the highest level. Congratulations Daniel you are great!

    safariforex
    136
    safariforex 2021.03.08 22:50 
     

    If you are reading this message, congratulation, you finally made it. Welcome to the winning team. And no it's not a sale pitch, just showing my appreciation for the author and his amazing indicator.

    Arnel Arnao
    2002
    Arnel Arnao 2021.03.04 07:21 
     

    First Thank you for sharing this indicator. Its Highly Recommended Indicator. Worth every penny. I recover the rental fee in just 1 day of trading. The Customer service is excellent. I just have 1 wish and I hope Stein will look into it that will make this more powerful. I wish Stein will provide an option for showing volume data in a single panel instead of switching back in forth in the options. I want to see Ratio,Change, Long/Short/total volume at one glance. Sometimes I missed some important information because I did not check it. Overall 6 stars for this excellent indicator.

    Daniel Stein
    95118
    Réponse du développeur Daniel Stein 2021.03.04 08:46
    Hi Arnel, first of all, thanks for your positive feedback. We're happy you enjoy using FX Volume. A combined view of all information is already on our todo list, but you can also combine several FX Volume instances in one chart to get all the information you need. Here's the corresponding post of our FX Volume info channel https://t.me/SI_FX_Volume/57. In case of questions drop a line and I'll assist. All the best, Daniel
    LUDY LAMBARA
    1355
    LUDY LAMBARA 2021.01.13 08:37 
     

    this is the best trading tool ever shared to public.... and the support was very quick.... 5star

    Sandy Wahyudi
    584
    Sandy Wahyudi 2020.12.04 16:39 
     

    Amazing all tools from Daniel. I have already use all tools..trend, power, lighthouse, volume, and power play. Just follow STS and forget it. All my trade like the games. Good suuport too from Daniel. Thanks.

    RDI
    1482
    RDI 2020.11.09 22:07 
     

    L'utilisateur n'a laissé aucun commentaire sur la note

    crimson
    456
    crimson 2020.07.15 14:34 
     

    This volume indicator is unique and amazing. Somehow it didn't go well with my trades. It shows real volume data, but seems lagging indicator to me.

    12
    Répondre à l'avis
    Version 4.82 2024.10.16
    Fixed alerts that were incorrectly turned off.
    Version 4.81 2024.10.15
    Fixed and improved GUI responsiveness on MT4
    Version 4.79 2024.10.14
    Fixed a recently introduced iCustom bug that caused a "cannot set timer" error.
    Version 4.78 2024.09.28
    FX Volume 4.78 contains the following changes:

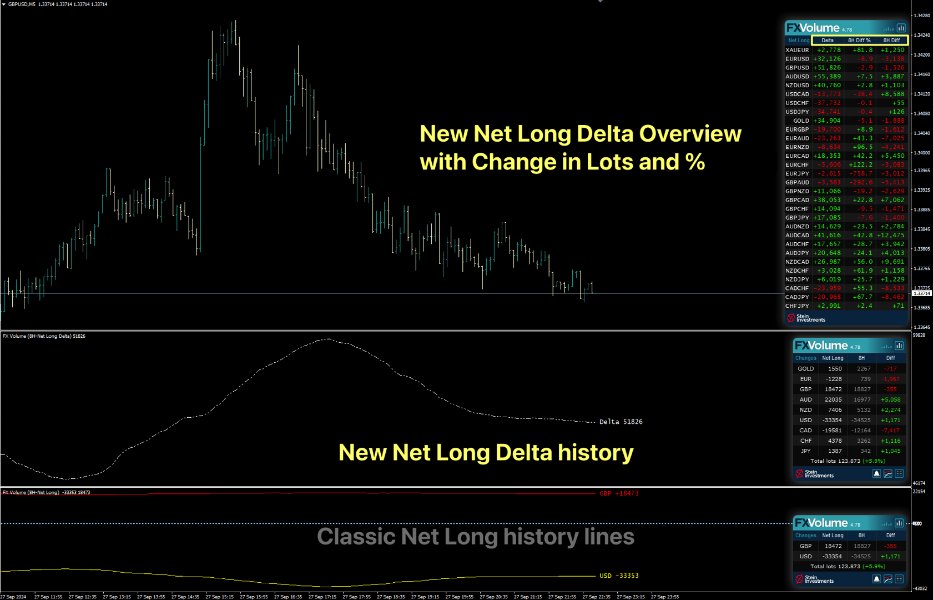
    All views have been reconstructed using the updated SI framework. The Net Long Delta History Mode has been introduced as new History Line Mode.

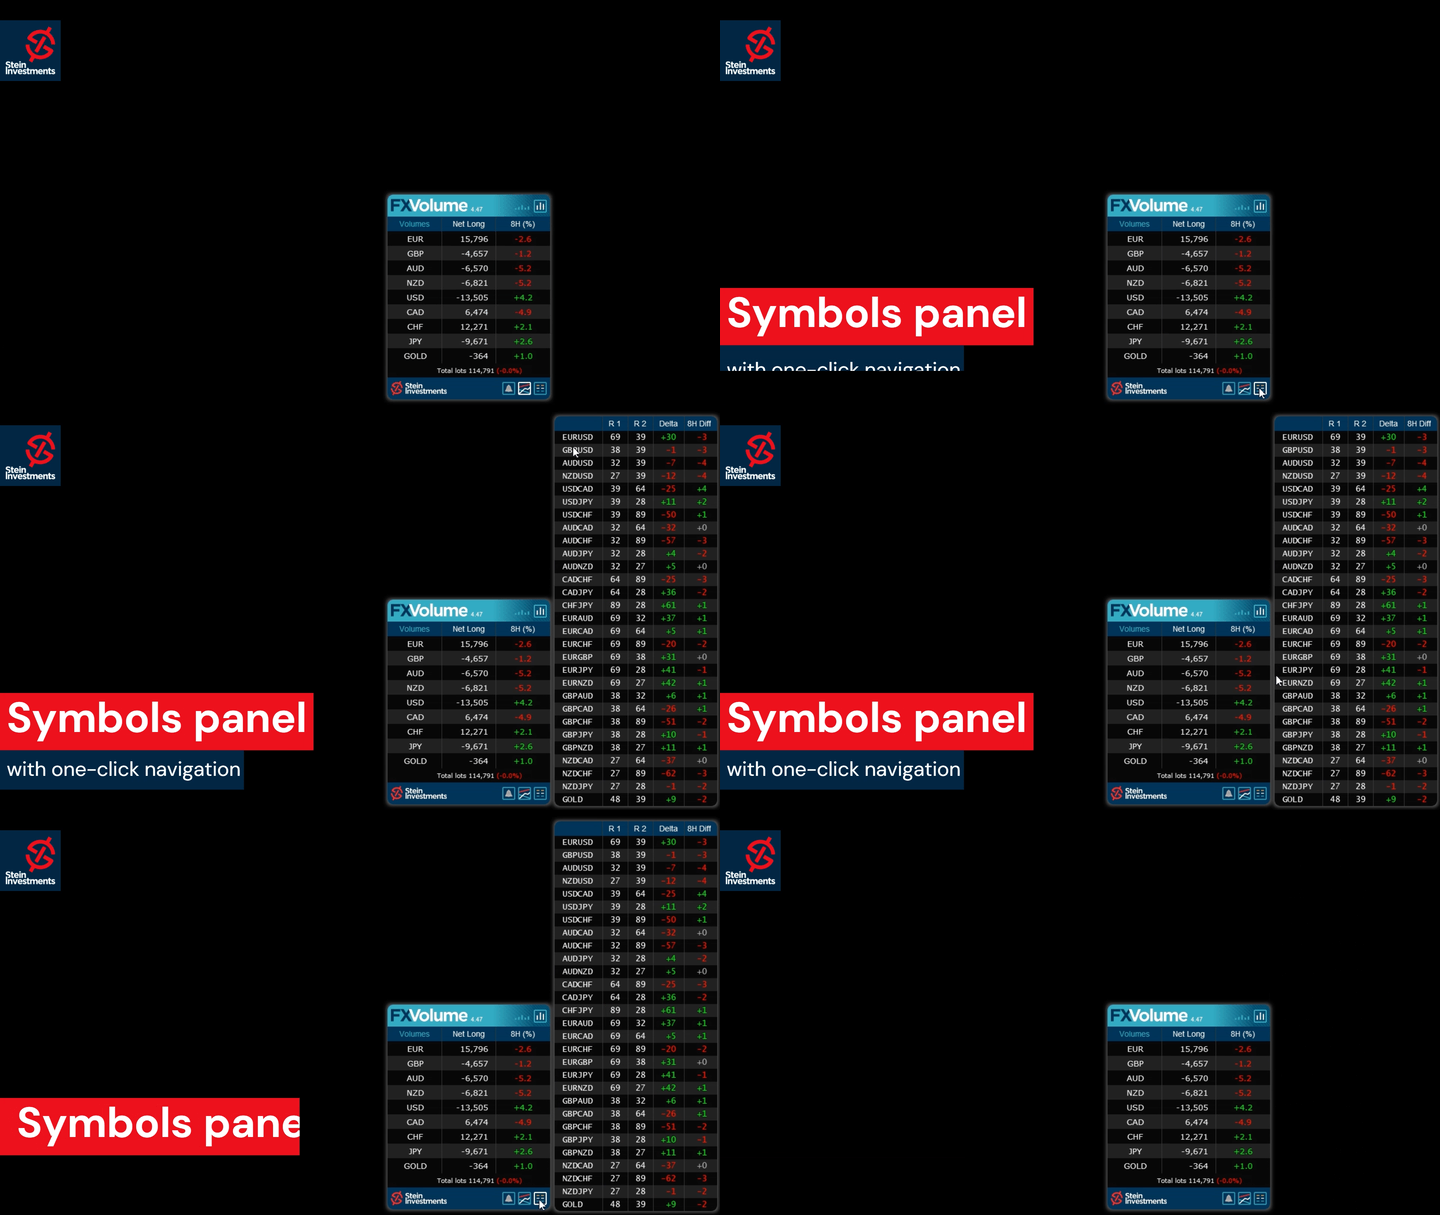
    The Net Long Delta Overview has been added as an alternative view in the Symbol List panel, and has been established as the default view for the symbol list when any of the three Net Long options is chosen in the properties.

    Gold has been set to display by default.

    Additionally, saved settings will now be cleared when a chart is closed.
    Version 4.68 2024.07.12
    New Features:
    - Alert Scheduler: Now you can customize the timing for indicator signals to fit your daily routine without being disturbed when you're busy.

    Bug Fixes:
    - Fixed occasional loss of history line colours, width, and style.
    - Removed "Gold" plot visibility when not used by settings.

    Improvements:
    - Enhanced data reliability in extreme cases.
    - Improved processing for "full" updates.
    Version 4.55 2023.08.30
    Fixed bug when symbols alert enabled
    Version 4.54 2023.08.07
    Fixed color change bug on history line labels
    Version 4.53 2023.08.01
    Added INSTANCE_ID input parameter

    Fixed GOLD bug, shifting all currencies data
    Version 4.52 2023.07.31
    Fixed iCustom call, sometimes displaying the panel

    Added Gold input parameters, and updated to use last framework changes
    Version 4.51 2023.07.27
    Fixed alert input parameter labels
    Version 4.50 2023.07.26
    Fixed invalid pointer, framework bug when no history lines are displayed

    Fixed bug in loading FXV parameters
    Version 4.49 2023.07.25
    Fixed MT4 strategy tester issue of missing history line colors
    Version 4.48 2023.07.24
    Fixed minor bugs

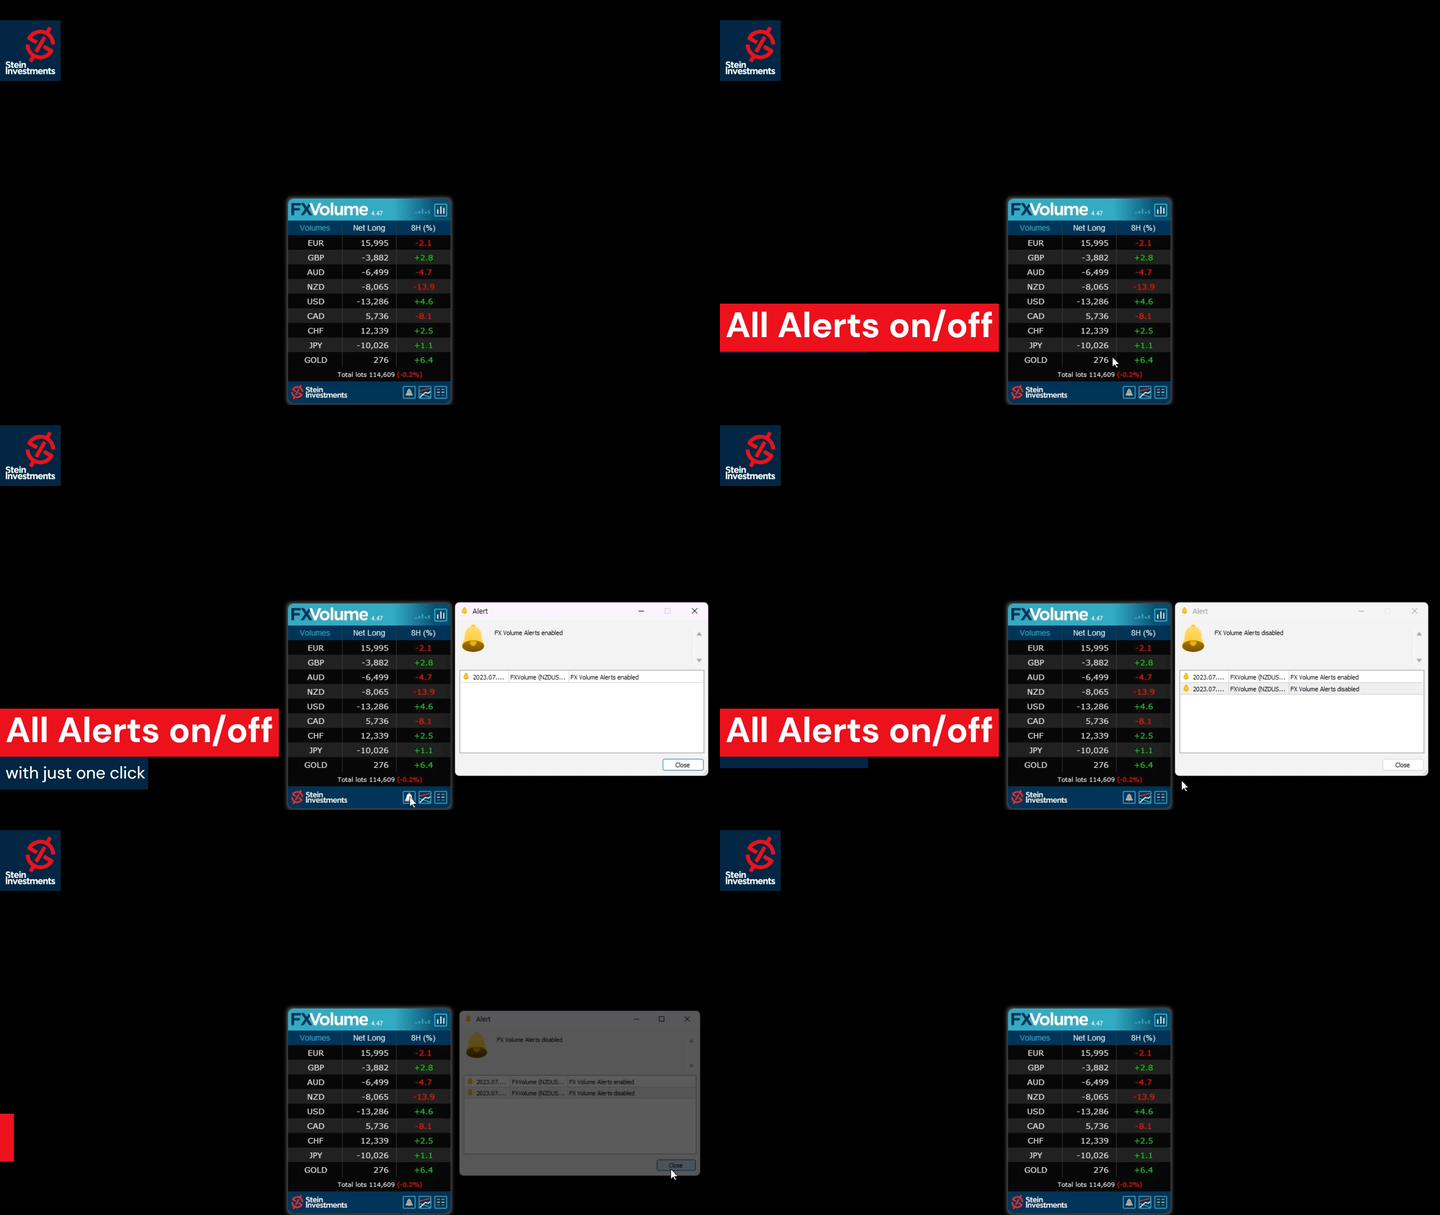
    Added an alert button in the panel

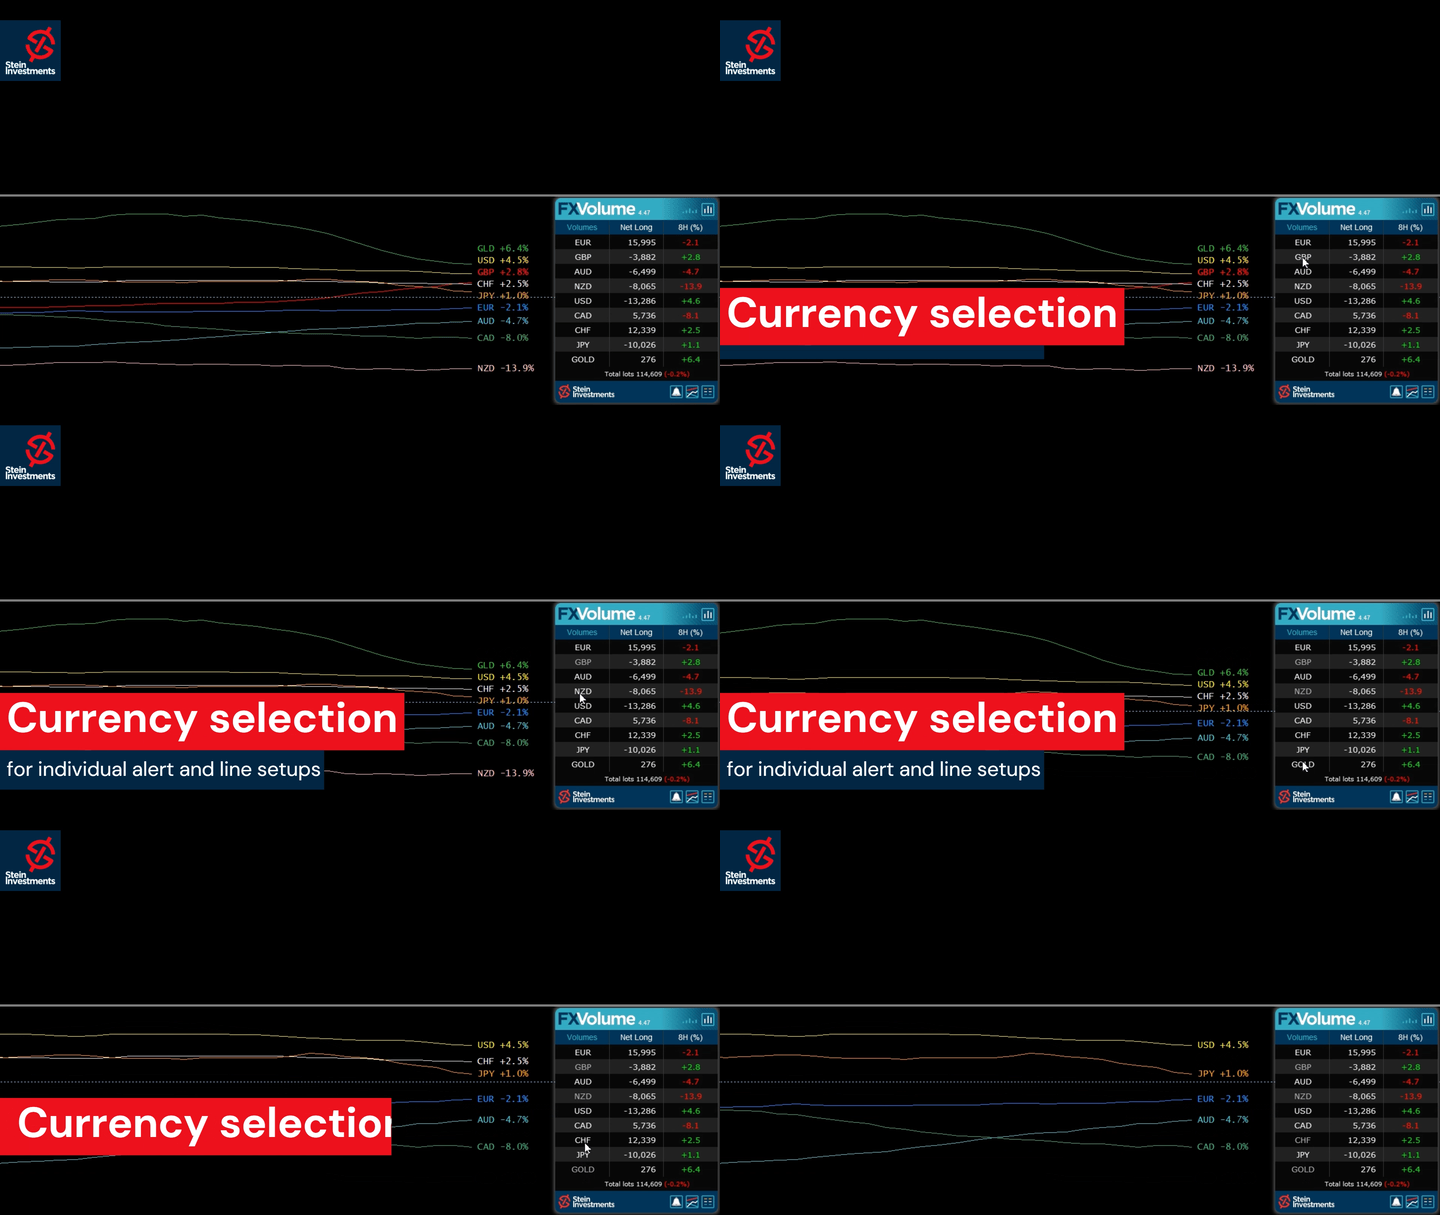
    Alerts are now individually configurable according to currencies selected

    Update with last framework and generic changes

    Changed input parameters (without effect on iCustom requests)

    Changed currency sorting in the panel following a logical convention for symbol names
    Version 4.42 2023.06.01
    Fixed GUI DPI adjustment bug
    Version 4.41 2023.06.01
    ⚠️Due to necessary changes in our panel management, you have to reconfigure your charts once after the update⚠️

    New Features
    Added history mode "Net Long % change"
    Added new main panel view "Net long % change"
    Added alerts for "Net long % change" drop & rise

    Changed indicator label on chart to display one decimal at % values
    Changed indicator digits according to history mode
    Changed the zoom factor to use % values
    Symbols list refactoring as a new panel


    Graphics
    New rounded corner panel design.
    Added a different color for the "Past" data column.
    Added input for panel back color if the auto-scheme is disabled
    Improved plot labels display to avoid overlapping. (MT5 only)


    Under the hood
    Apply complete internal refactoring
    Apply the last framework update
    Version 4.10 2022.03.08
    Fixed resource loading issue on some Mac/Linux systems

    Fixed graphical panel bug when missing past data
    Version 4.0 2022.03.02
    FX Volume 4.0 comes with two additional features.

    1. The option to use the internal comparison calculation on a minute basis which allows comparison below our previous minimum of 1 hour.

    2. Inspired by our fellow trader Luke, we created a Net Long Volume view including history lines to understand better how the Net Long volume correlates with the market moves we see on the chart.

    Check our Stein Investments YouTube channel to see a video of the new features.

    We're sure you'll like the new features.
    Version 3.58 2021.09.01
    Optimized FX Volume to be fully compatible with MT4/MT5 templates
    Version 3.53 2021.05.08
    Transition version to use data in common data folder

    Fixed bug with GMT when running FX Volume on a weekend for the first time

    Optimizations when used as free demo version in the strategy tester

    Version 3.50 2021.04.08
    Fixed minor bug when alerts are enabled
    Version 3.49 2021.04.01
    This update contains the following changes:

    - New Alert options based on Long and Short Volume
    - New Alert filters based on the dominance of one side available,
    i.e. if Volume Long is bigger than Volume Short, you'll get only alerts for the Volume Long side
    - Improved communication with the new SI Connect 2.x
    - Optimized settings managements

    and these changes are related to the strategy tester usage

    - Fixed current candle update bug
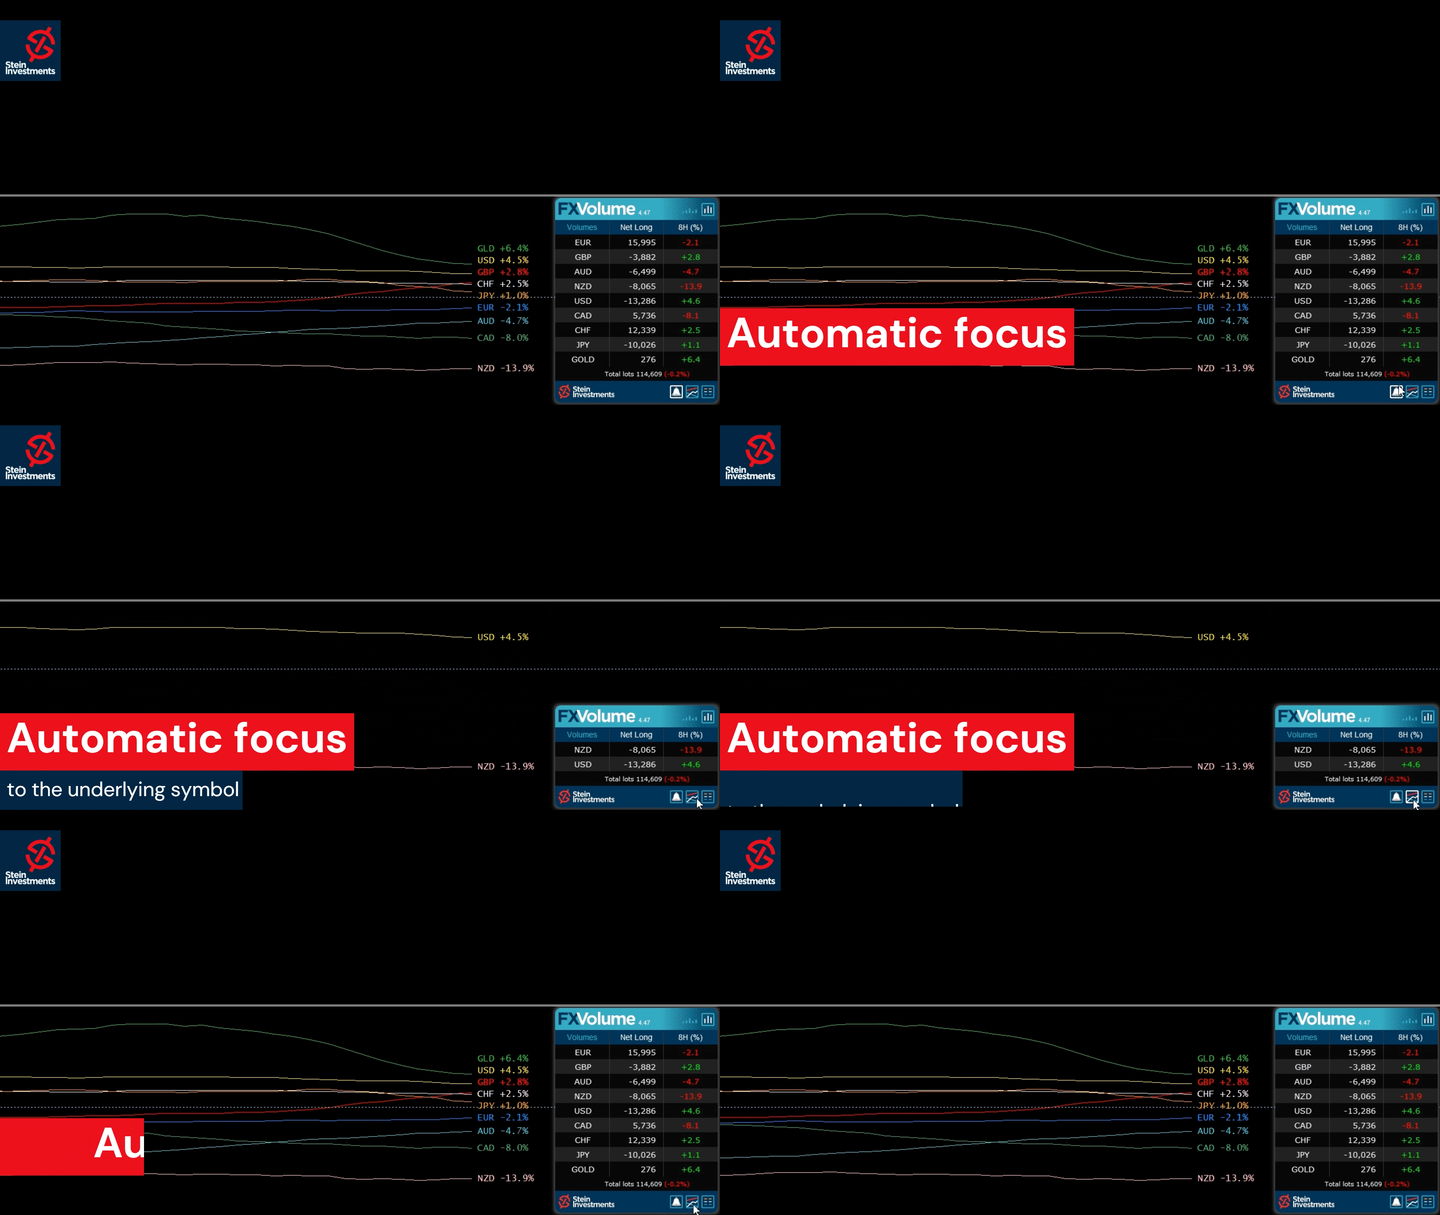
    - Added parameter to start with a focus on chart currencies
    - Improved backtesting performance
    Version 3.35 2021.03.11
    Fixed M1 issue when used in the strategy tester
    Version 3.34 2021.03.10
    Fixed row labels in Changes view
    Version 3.33 2021.03.10
    Internal refactoring
    Changed SI Connect detection method
    Improved performance when used in the strategy tester
    Version 3.28 2021.02.26
    FX Volume GUI enabled in Strategy Tester visual mode when called via iCustom
    Version 3.27 2021.02.26
    Besides various minor fixes and improvements we made a few specific improvements when using FX Volume inside an EA and in the strategy tester like:

    - Improve behaviour when called from iCustom
    - Improved data processing (all modes)
    - Fix minor display bugs while using the visual mode
    - Disabled alerts in tester mode
    Version 3.25 2021.02.22
    Optimized SI Connect EA detection in case of heavy usage (more than 20 instances)
    Version 3.24 2021.02.17
    Fix symbols list display (top of the list possibly hidden)
    Version 3.23 2021.02.17
    With this update, it's finally possible to combine different views AND comparison periods in just one chart.

    In this way, you'll easily see if the short term volume is still dynamic and supporting the volume change of a higher period.
    This offers an entirely new grade of precision because you now see exactly when to enter when to exit and if it's still worth to hold the position.

    We hope you'll enjoy the new flexibility provided by FX Volume.
    Version 3.18 2021.02.10
    Fixed bug resulting in orphan objects on the chart

    Fixed bug of line style changes when using several instances
    Version 3.17 2021.02.04
    This release is another huge step forward and provides the following new features.

    - Additional colouration for the positive and negative percentage values

    - History lines for Volume Total, Volume Long and Volume short are now available

    - All history lines can be hidden completely via parameters in the indicator properties

    - Use multiple instances of FX Volume in one chart to create individual comparison views.
    Note: Every instance has to use a different "History lines and buffers" mode to manage all instances correctly.

    - Volume Total, Volume Long and Volume Short are now available in the indicator buffers

    IMPORTANT: Please note that the history lines and the panel information is managed independently!
    If you switch to a different panel view, this does NOT change the volume history lines. You have to change them in the indicator properties.

    Please note also that the value labels of the history lines differ from the information seen in the panel because the panel displays always the latest available information while the history line buffer provides an OHLC volume data average for the entire candle. Please visit our FX Volume info channel at https://t.me/SI_FX_Volume to get more detailed information
    Version 3.1 2021.02.01
    Renamed view labels for a better usability
    Version 3.0 2021.02.01
    This major update provides a deeper insight into the real trading market sentiment

    Now you can see the total volume of the long and short side separately as well as how it changed during the selected comparison period. With this information, you can easily spot on which side of the market there is an upcoming dynamic in the real trading volume.

    And because we are often asked for it we added all this information for GOLD as well.

    Enjoy the new amazing features of FX Volume and leave a review if you like it.
    Version 2.26 2020.12.21
    Fixed minor bug occurring rarely at a terminal restart
    Version 2.25 2020.12.18
    Minor bug fixed causing an empty panel due to unchanged data

    Added special section for the alert option in the indicator properties
    Version 2.24 2020.12.16
    The following new features have been added:

    -Alert on long ratio rise/drop
    -Alert on total volume rise/drop
    -Alert on delta increase/decrease

    We hope you'll enjoy the new alert options.
    Version 2.22 2020.12.02
    Disabled DEBUG mode
    Version 2.21 2020.11.23
    Fixed empty panel bug
    Version 2.20 2020.09.18
    Changed Delta calculation display to provide more accurate results

    Added total volume buffer -> ask for the updated code snippets

    FX Volume is now ready to be used in the MT4 strategy tester!

    Please note that you have to copy the FX Volume data file manually from \\MQL4\Files to \\tester\files\SI Lab in your terminal's data folder to be able to run backtests with FX Volume in your MT4 (an MT5 handles this task automatically)

    Version 2.16 2020.06.24
    The panel uses current and raw data only. OHLC is used only for history lines.

    Fixed bug in panel update when data are not directly available.

    Added an alert for insufficient Terminal "Max bars" settings.
    Version 2.0 2020.06.20
    Dear customers, please welcome our fantastic FX Volume 2.0. We spent weeks of work designing this beautiful panel, adding excellent features, and providing more detailed information to offer you outstanding user experience and a real edge in trading.

    To benefit from all improvements it is necessary that you update FX Volume and SI Connect to the latest available version!
    Version 1.26 2020.05.14
    Fixed bug in detecting the SI Connect EA
    Version 1.25 2020.05.14
    Use updated libraries
    Version 1.24 2020.03.09
    Added security to avoid alert flooding

    Fixed bug which checks and sends alert continuously if the data file can't be opened
    Version 1.23 2020.03.08
    Improved backward compatibility
    Version 1.19 2020.03.08
    Improved EA detection -> switch to SI Connect
    Version 1.15 2020.03.04
    Fixed bug chart changing to EURUSD when clicking above "Changes/Ratios" label

    Added the possibility to set your individual color and line style via the Colors tab at the indicator properties
    Version 1.13 2020.03.02
    Fixed GMT Offset