Candle Painter
- Indicateurs
- Benjamin Nicola
- Version: 1.5
- Mise à jour: 3 octobre 2022
- Activations: 5
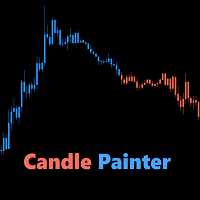
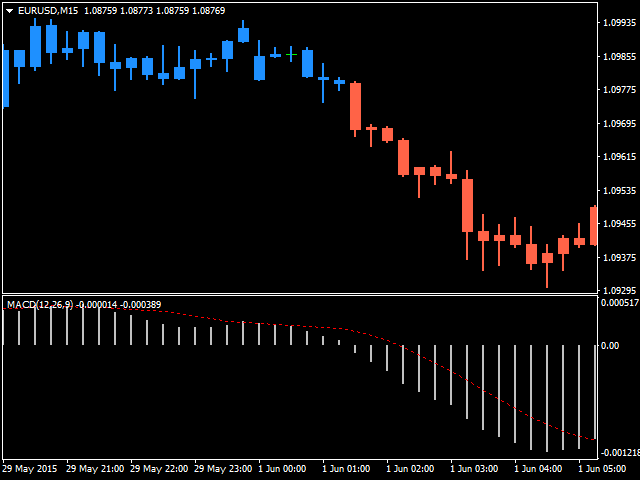
You can choose from a long list of indicators and follow the trend of the colored candles, or get warned by the overbought/oversold color on the candles.
Uptrend and downtrend levels can be set for the oscillators.
Oscillators with main and signal lines, such as MACD, Stochastic and RVI, also have the option to follow trend by crossings.
Overbought and oversold levels can also be drawn on top of the candles or be turned off.
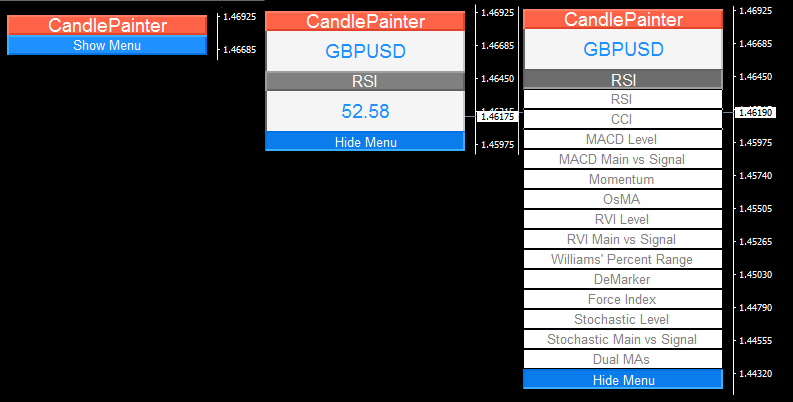
You can choose from a variety of indicators, such as:
- RSI
- CCI
- MACD Histogram Level
- MACD Main vs Signal line
- OsMA
- Stochastic Level
- Stochastic Main vs Signal line
- Williams' Percentage Range
- Momentum
- DeMarker
- Force Index
- 2MAs
- RVI
How to Use
- At first, select the indicator you want to use.
- Set the parameters of the indicator you have selected.
Example: Select RSI and set the parameters RSI Period and RSI Price as you wish.
- Go down to Trend Settings and fill in Uptrend and Downtrend.
Example: The middle line from RSI is at value 50.If you want to paint the candles above 50 as Uptrend you fill in 50, if you want to start painting from 55 you fill in 55.
Remember that different indicators have different middle lines, for instance, the MACD middle line is at 0. - Fill in the OBOS (Overbought & Oversold) settings. You can choose if you want to paint the OBOS candles on top of the trend candles by setting PaintOBOS true or false. Set the Overbought and Oversold parameters just like at step 3 but now fill in the OBOS values.
Example: The Overbought value of RSI is usually 70 and the Oversold value is 30.
- Set the Candle settings parameters for the Body and the Wick, you can leave the wick to 1, the Body depends on the zoom of your chart (I am looking for a way to automate this).
- Go to the Colors tab and choose the colors as you like.
Attention
If you select MACD/RVI/Stochastic Main vs Signal line, the candles will be painted according to the Main vs Signal lines.
Example: If the Main line is above the signal line, UpTrend candles will be drawn on top of your chart candles and vice versa.
If you have any questions or new ideas for this indicator, do not hesitate to ask/tell me.
Thank you for your interest,
Ben Nicola


Priceless tool!