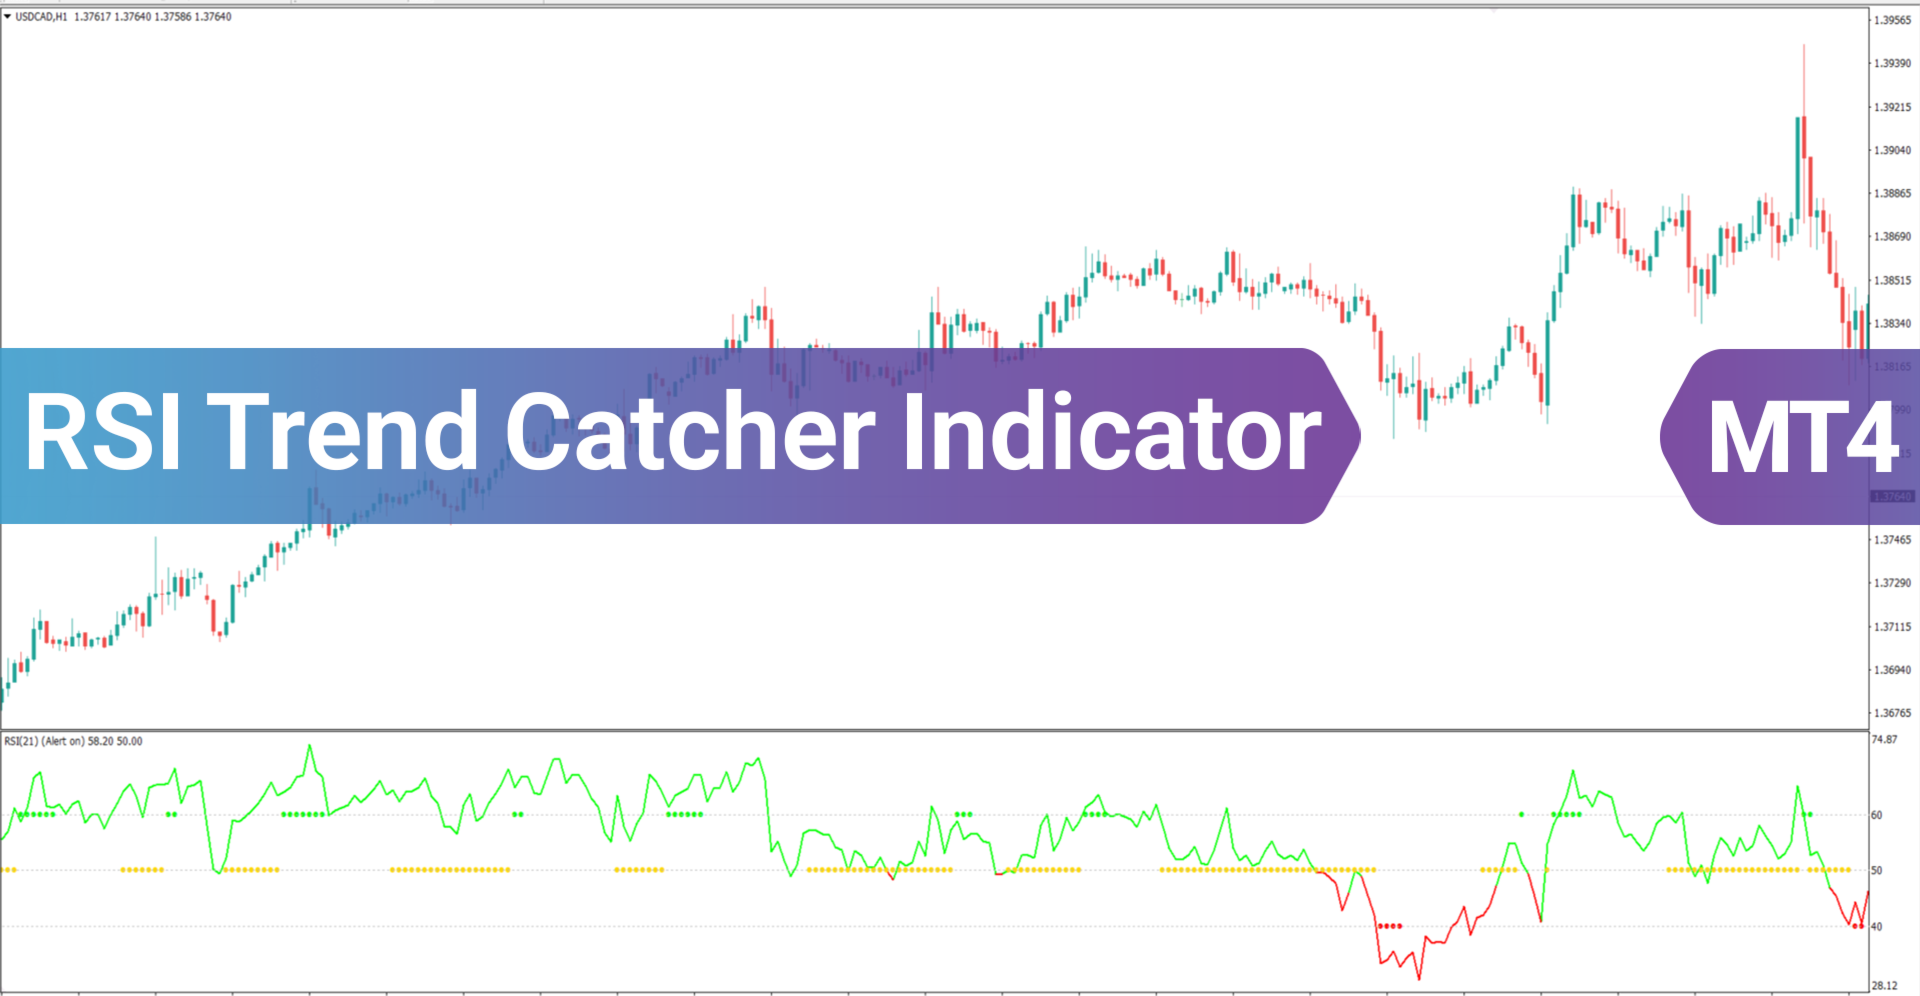
RSI Trend Catcher Oscillator MT4
- Indicateurs
- Eda Kaya
- Version: 1.3
RSI Trend Catcher Oscillator for MetaTrader 4
The RSI Trend Catcher Oscillator for MetaTrader 4 is a customized MT4 indicator that works based on principles similar to the classic RSI. It detects overbought and oversold conditions and provides optimal entry and exit points. The RSI Trend Catcher uses three distinct colors to visualize trends: green for bullish movements, red for bearish trends, and yellow for neutral phases. Its design integrates Bollinger Bands to enhance signal generation accuracy.
«Indicator Installation & User Guide»
MT5 Indicator Installation | RSI Trend Catcher Oscillator MT5 | ALL Products By TradingFinderLab | Best MT5 Indicator: Refined Order Block Indicator for MT5 | Best MT5 Utility: Trade Assistant Expert TF MT5 | TP & SL Tool: Risk Reward Ratio Calculator RRR MT5 | Money Management: Easy Trade Manager MT5 | Trade Copier: Free Fast Local Trade Copier MT5
Indicator Specifications Table
| Category | Signal and Prediction - Oscillator - Trading Tool |
| Platform | MetaTrader 4 |
| Skill Level | Intermediate |
| Indicator Type | Continuation - Reversal - Non-repainting |
| Time Frame | Multi Time Frame |
| Trading Style | Short-Term - Medium-Term - Long-Term |
| Market | Forex - Cryptocurrencies |
Indicator Overview
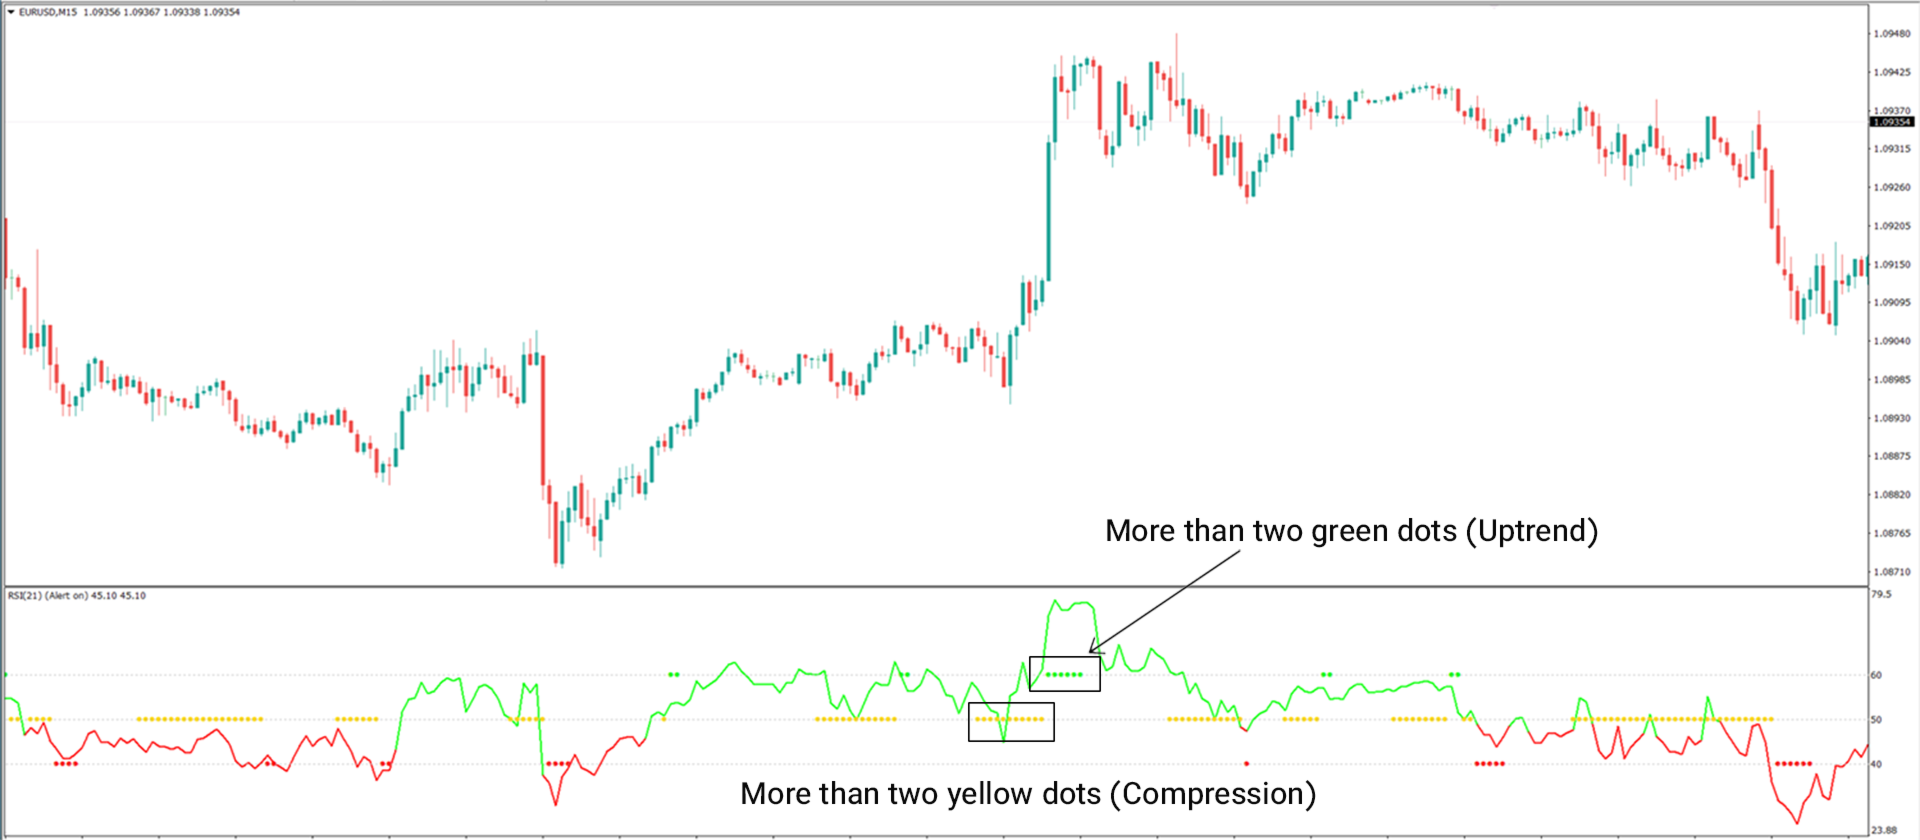
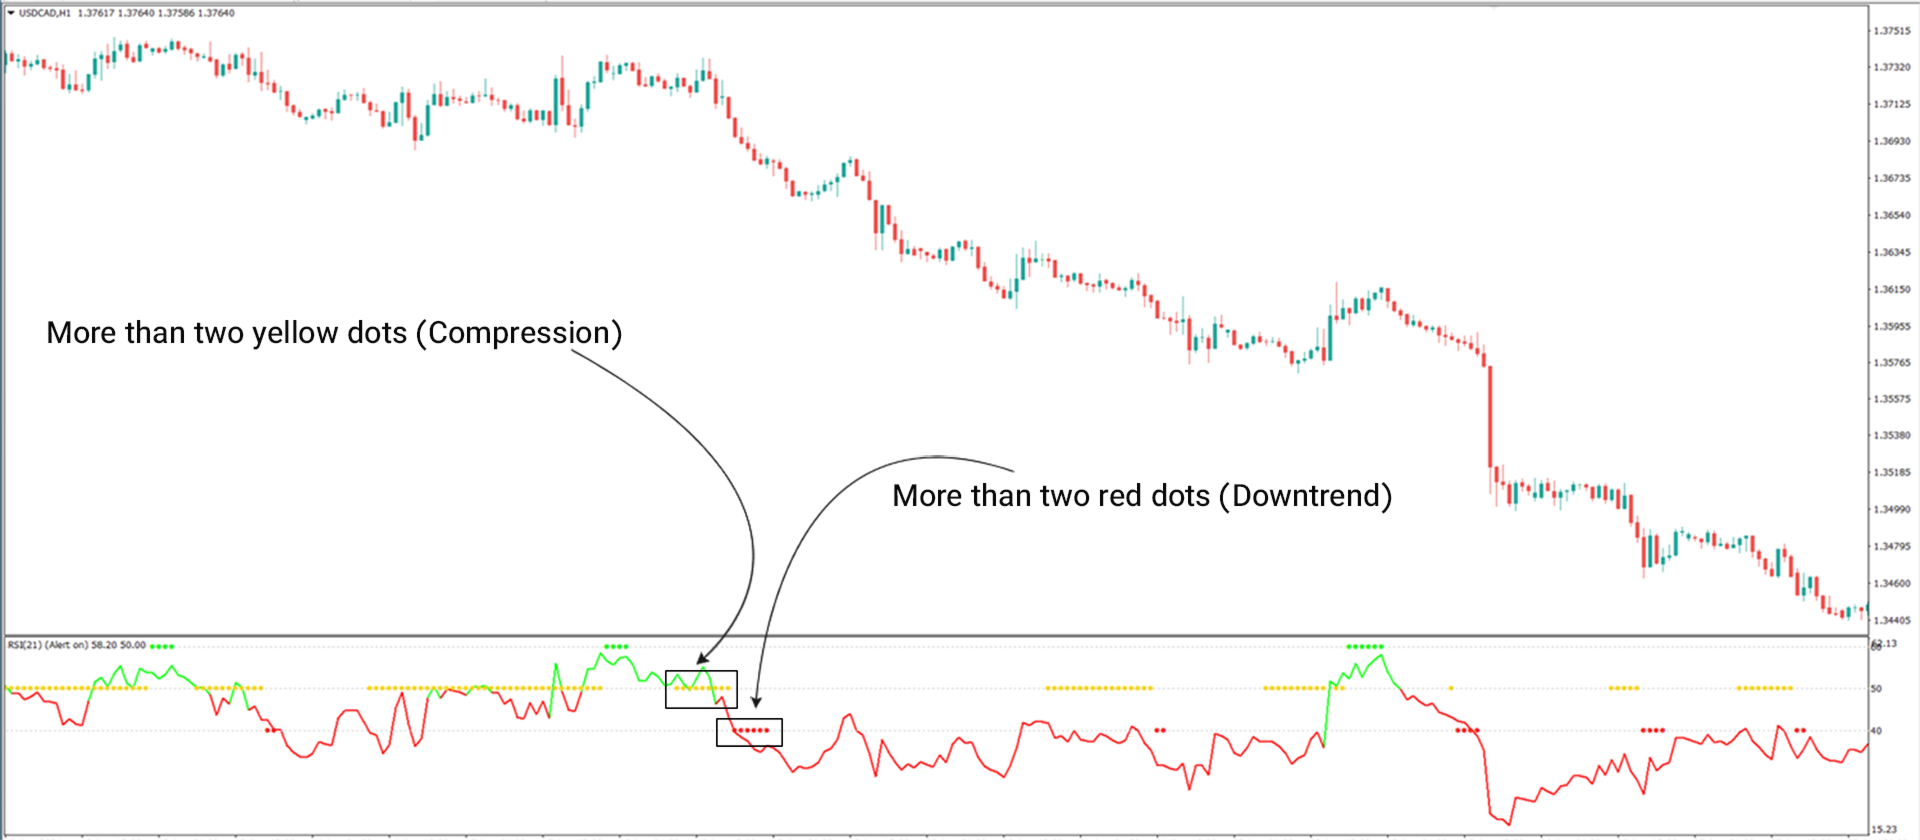
The RSI Trend Catcher Oscillator for MetaTrader 4 shows an uptrend through green curves and a downtrend via red curves. When two or more yellow points appear, it suggests a phase of buying and selling compression; following this, if green dots and a green curve emerge, it confirms an uptrend, while the appearance of red dots with a red curve signals a potential downward move.
Bullish Trend Conditions
On the 15-minute EUR/USD chart, the RSI Trend Catcher Oscillator for MetaTrader 4 identifies bullish setups. As shown, the presence of multiple yellow dots followed by a series of green dots, along with the oscillator rising above the 50% mark, indicates the establishment of an upward trend.
Bearish Trend Conditions
On the 1-hour USD/CAD chart, the RSI Trend Catcher Oscillator for MetaTrader 4 highlights bearish scenarios. When yellow dots precede the formation of multiple red dots and the oscillator shifts below the 50% level, it points toward the start of a downward trend.
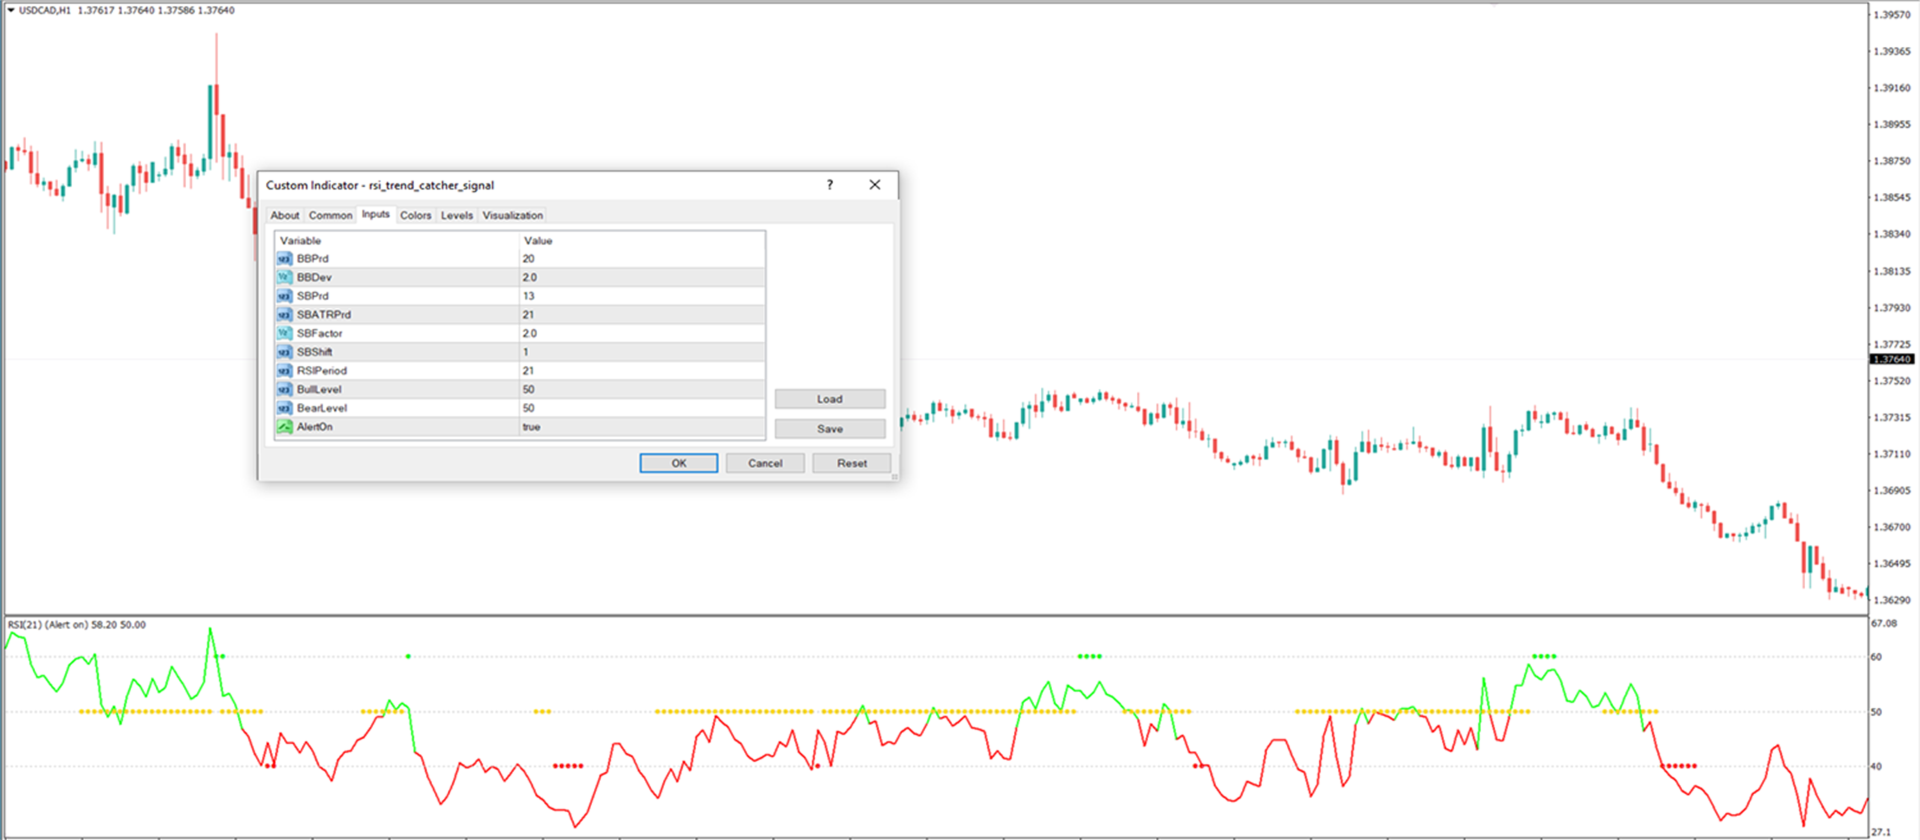
Settings
• Bollinger Band Period: 20;
• Bollinger Band Deviation: 2.0;
• SB_period: 13 (Moving Average Period);
• SB ATR Period: 21 (ATR Calculation);
• SB_factor: ATR Multiplier set to 2.0;
• SB_shift: Moving Average Shift set to 1;
• RSI Period: 21;
• Bullish Threshold (Close Price): 50;
• Bearish Threshold: 50;
• Alerts: Enabled for Signal Notifications.
Summary
The RSI Trend Catcher Oscillator for MetaTrader 4 enhances traditional RSI functionality by providing clearer trend and reversal signals. It is a powerful, user-friendly tool suitable for identifying market trends across all trading timeframes.