Multi EMA Trend Visualizer
- Utilitaires
- Nana Yaw Osei
- Version: 1.0
EMA Line Visualizer with Trend Analysis
Description:
The Exponential Moving Average (EMA) Line Visualizer EA plots multiple EMAs on your chart (25, 50, 100, 200, and a custom EMA) and analyzes real-time trend direction.
It detects whether the market is currently in an Uptrend, Downtrend, or Flat condition based on the latest EMA relationships.
Features:
-
Multi-EMA Display
Plot multiple EMAs with customizable periods. -
Custom Colors
Set distinct colors for each EMA line for better visual tracking. -
Trend Analysis
Clearly shows if the current market trend is up, down, or ranging. -
Timeframe Flexibility
Works with any MetaTrader 5 timeframe.
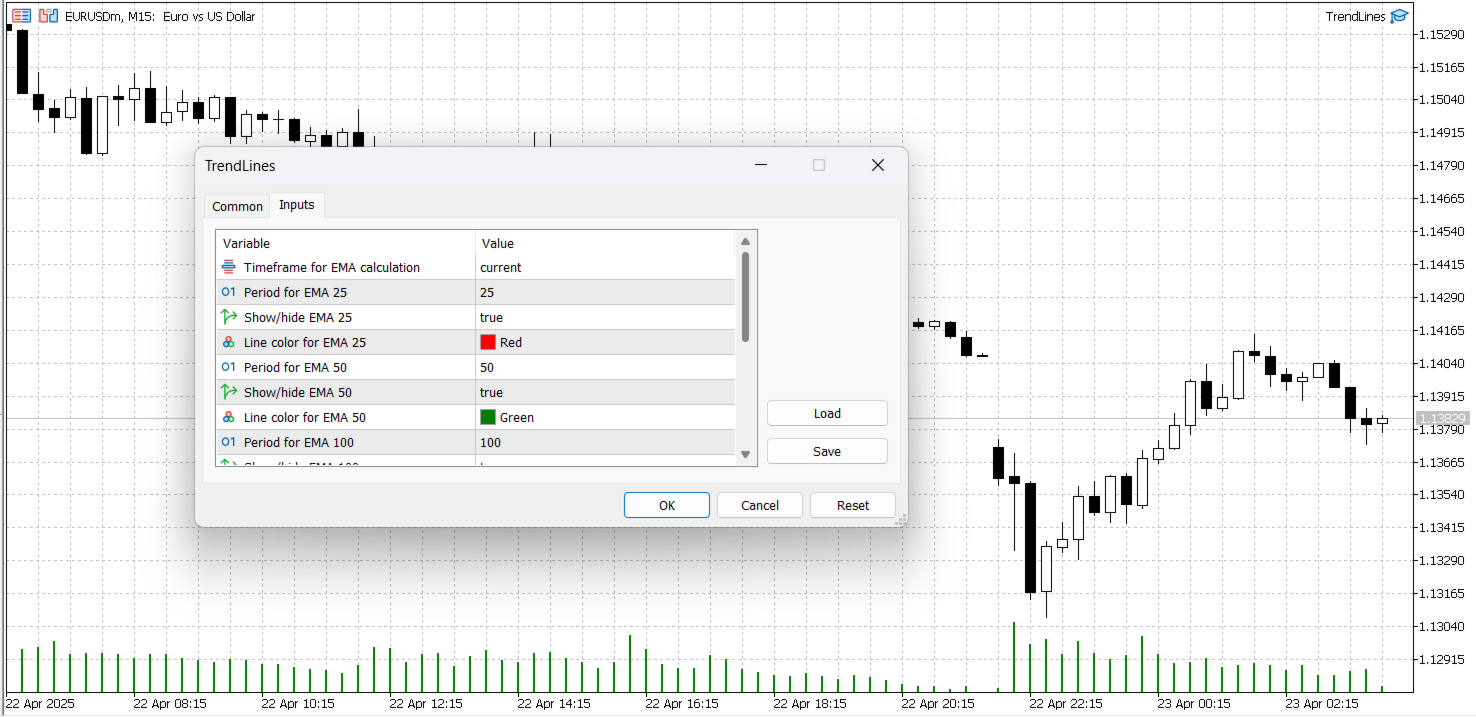
Input Parameters:
-
TimeFrame – EMA calculation timeframe (default is current chart timeframe).
-
EMAPeriods – Periods to use for EMA lines (default: 25, 50, 100, 200).
-
ShowEMA – Toggle visibility for each EMA line.
-
EMAColors – Choose specific colors for each EMA line.
-
CustomEMA – Enable and define a custom EMA period.
How It Works:
-
Calculates EMAs using iMA based on selected periods and timeframes.
-
Compares EMA values to determine the current trend.
-
Displays EMA lines and trend direction directly on the chart.
Usage:
-
Attach the EA to any MetaTrader 5 chart.
-
Adjust the input settings to your preferences.
-
View the EMAs and current trend direction visually on the chart.