Liquidity Finder MT4
- Indicateurs
- Eda Kaya
- Version: 1.3
Liquidity Finder Indicator MT4
The Liquidity Finder Indicator MT4 is a powerful tool integrated into MetaTrader 4 (MT4) that assists traders in detecting zones of high liquidity concentration. This indicator automatically highlights both dynamic (angled) and static (horizontal, dotted) trend lines, offering insight into areas where price is likely to react. Static lines often align with significant chart patterns like Double Tops or Double Bottoms, acting as key markers for potential liquidity zones.
«Indicator Installation & User Guide»
MT4 Indicator Installation | Liquidity Finder MT5 | ALL Products By TradingFinderLab | Best MT4 Indicator: Refined Order Block Indicator for MT4 | Best MT4 Utility: Trade Assistant Expert TF MT4 | TP & SL Tool: Risk Reward Ratio Calculator RRR MT4 | Money Management: Easy Trade Manager MT4
Indicator Overview
| Indicator Category | ICT - Smart Money - Key Levels |
| Platform | MetaTrader 4 |
| Skill Level | Intermediate to Expert |
| Indicator Type | Breakout - Momentum - Leading |
| Time Frames | M1, M5, M15, M30, H1, H4 |
| Trading Approach | Scalping, Intraday, Day Trading |
| Market Instruments | Forex, Cryptocurrencies, Equities |
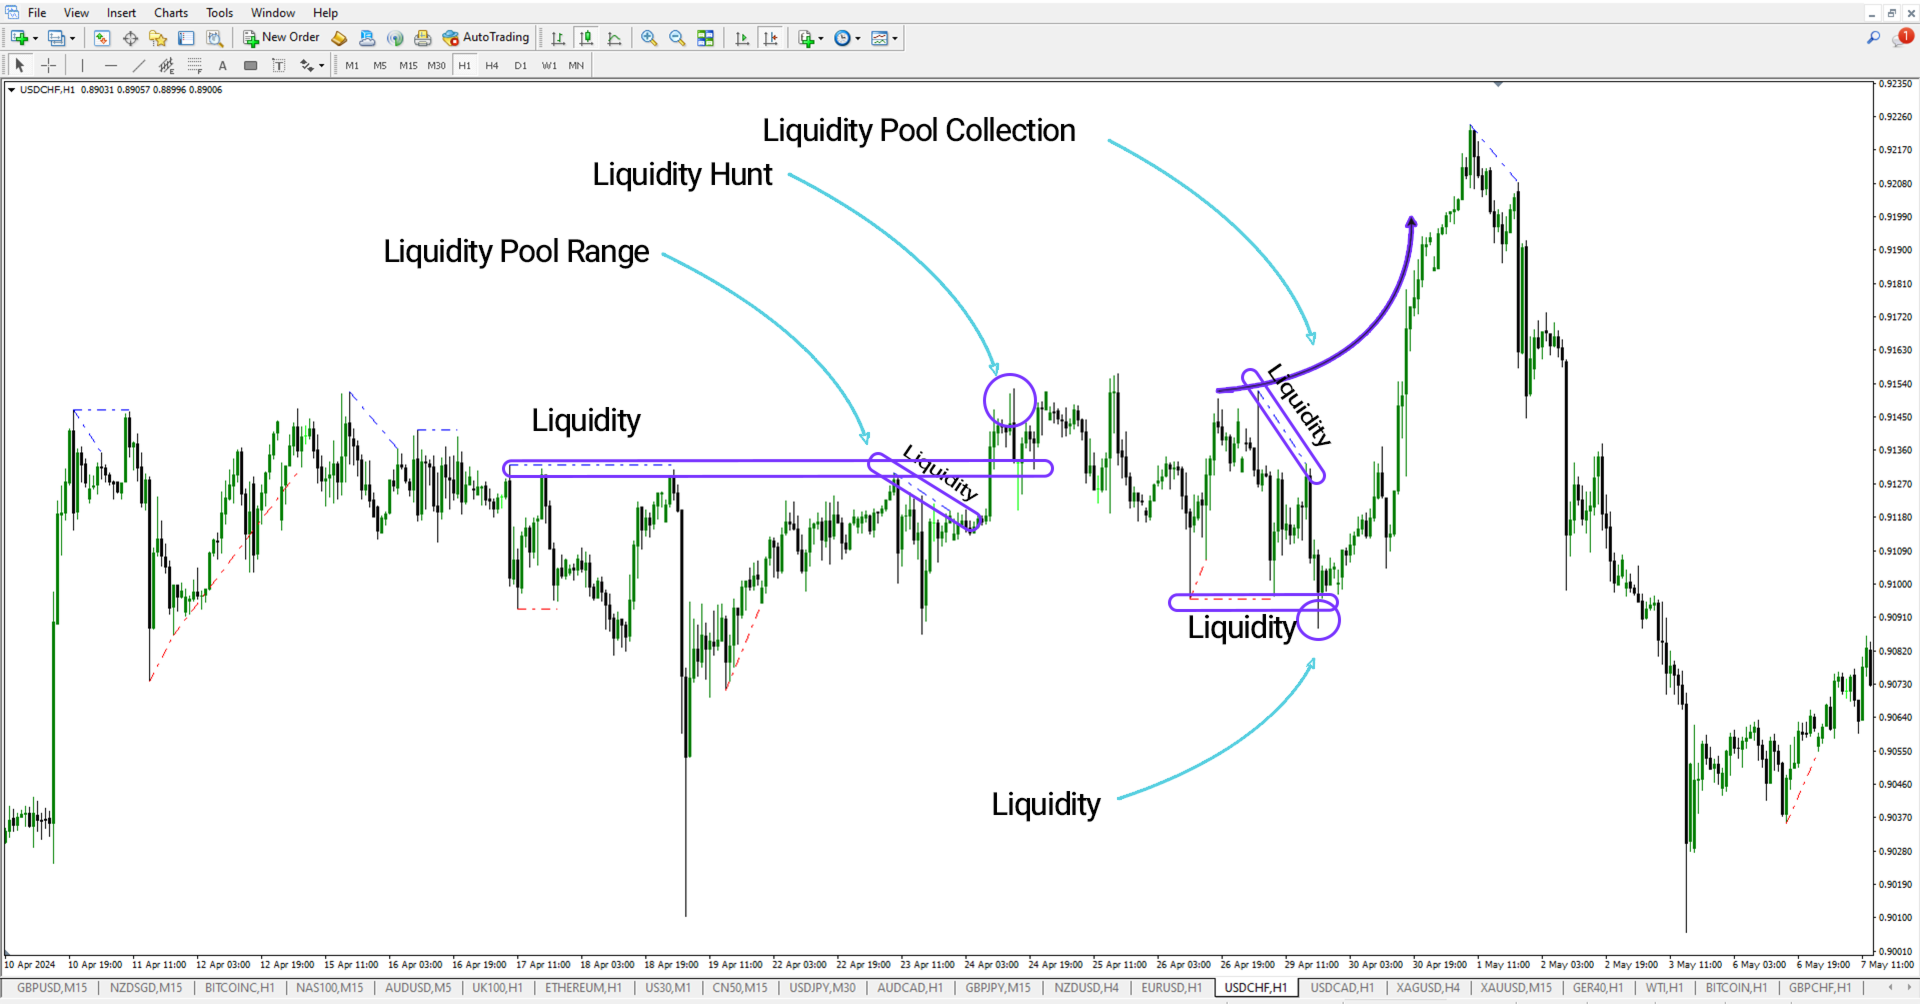
Stop Hunt on the High
In the USD/CHF chart example, the market builds a range with several matching highs, indicating a liquidity buildup. As expected, price drives upward to tap into this cluster at approximately 0.91525. Once that liquidity is swept, the market briefly retraces and captures further liquidity from lower zones. The lowest point reaches around 0.90884, where demand steps in. Following this liquidity sweep, the market surges with increased momentum, continuing in the bullish direction.
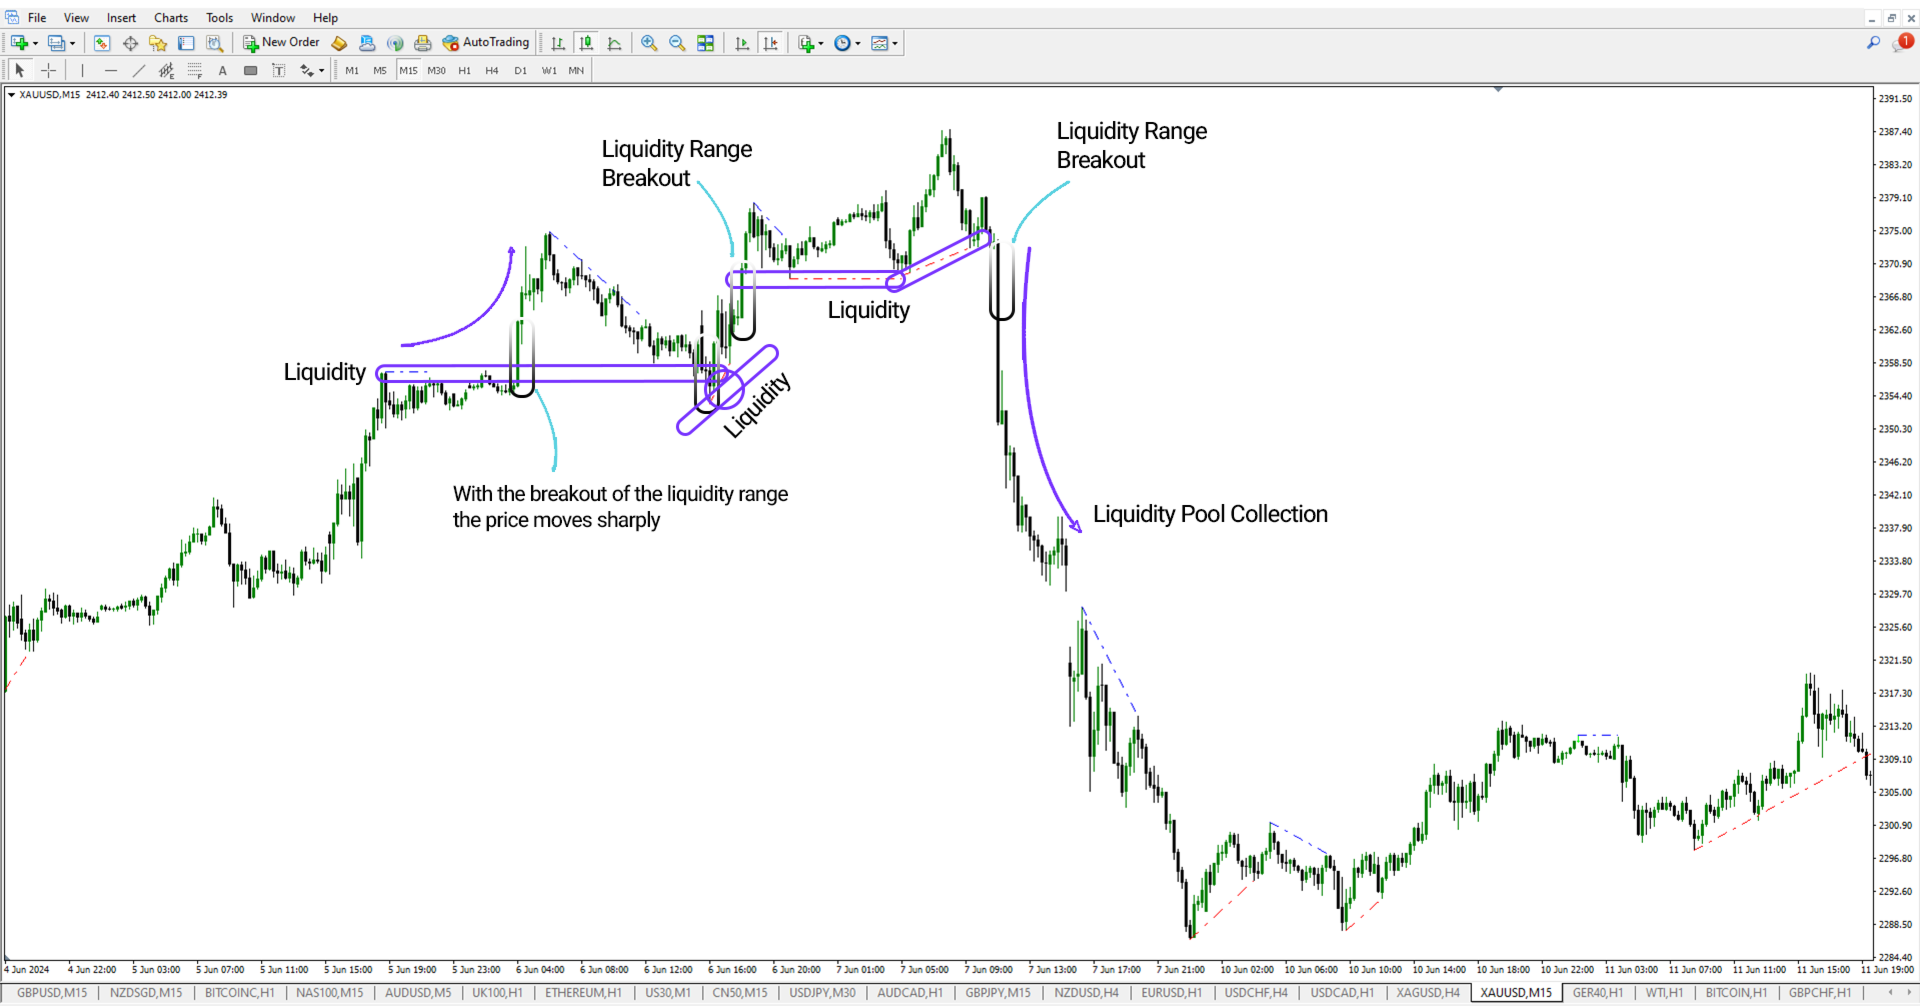
Stop Hunt on the Low
On a 15-minute XAUUSD chart, price first rallies beyond the 2358.50 resistance, triggering stop-losses and filling pending orders above the high. It then sharply reverses to the 2354.40 level, which temporarily serves as a support. At this area, price consolidates, absorbs liquidity, and then makes a new push upward toward 2387.40 — a level that acts as fresh resistance. This behavior clearly outlines how the market manipulates liquidity zones to fuel future movements.
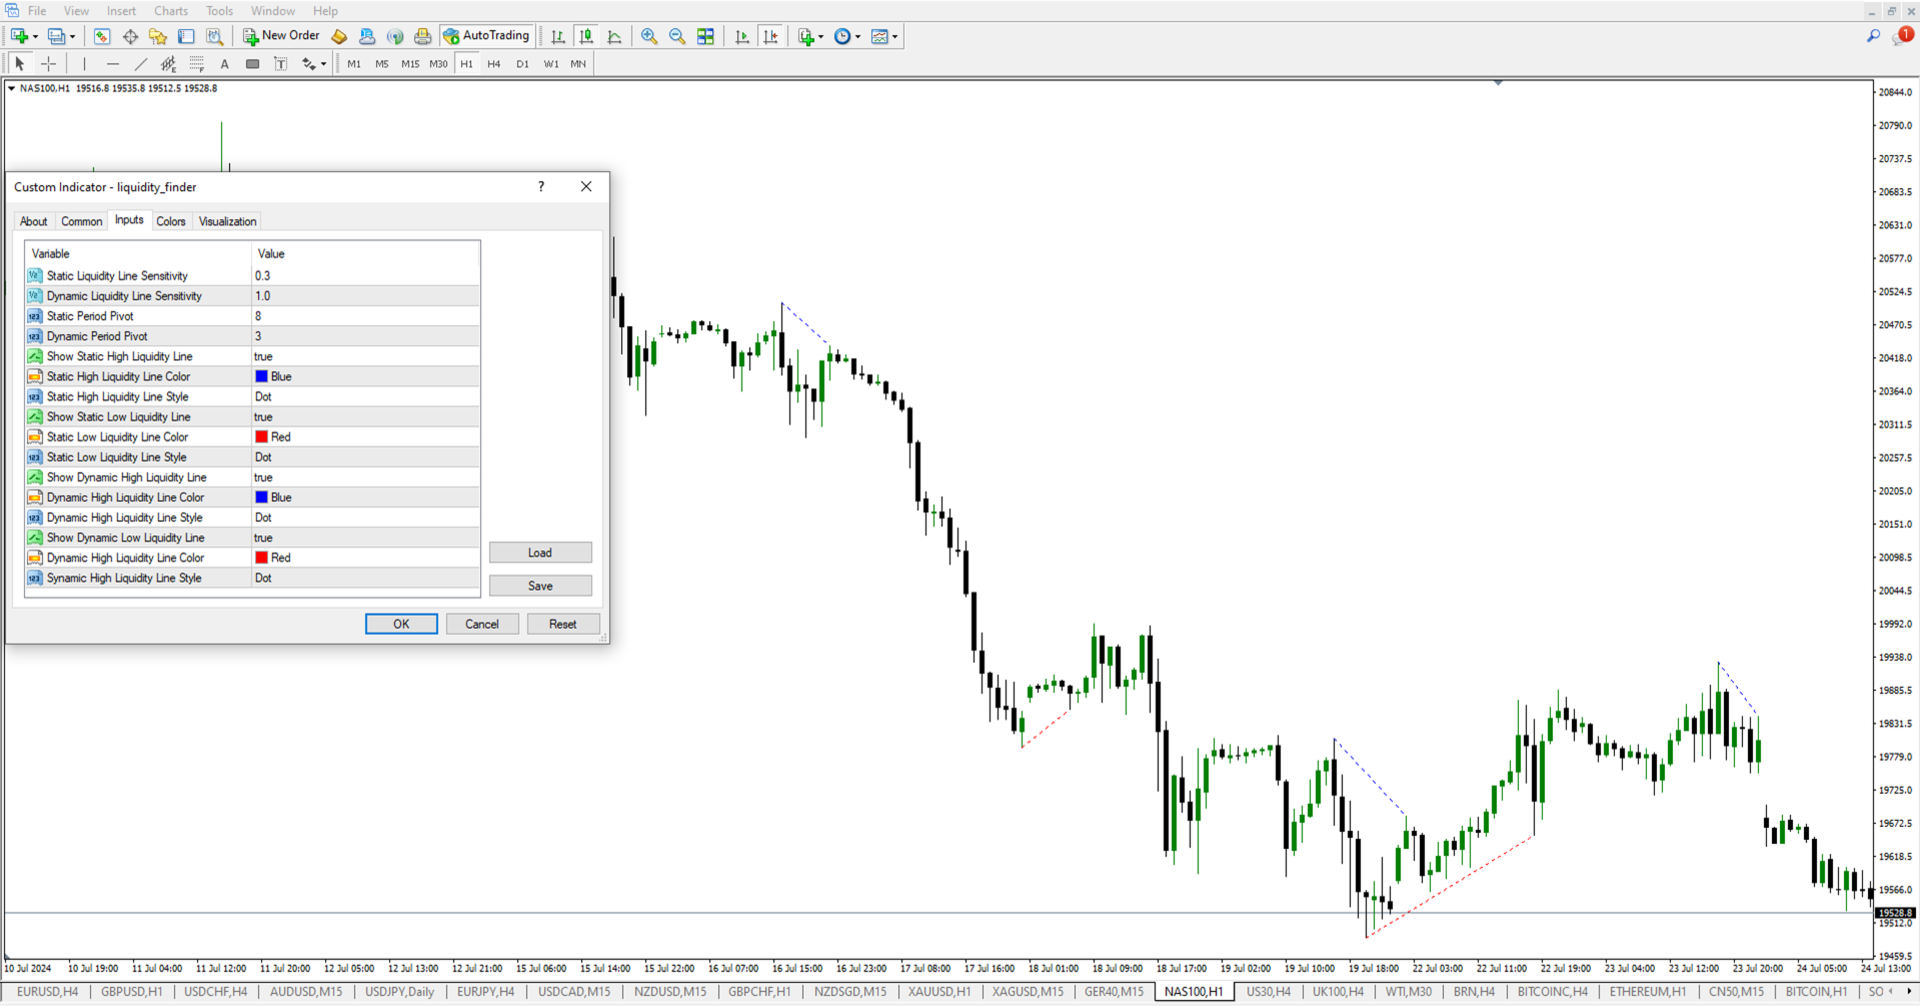
Indicator Configuration Options
• Static Line Sensitivity – Adjust responsiveness of static liquidity detection
• Dynamic Line Sensitivity – Controls sensitivity for angled liquidity lines
• Static Pivot Period – Number of periods used to detect horizontal liquidity zones
• Dynamic Pivot Period – Period setting for diagonal liquidity detection
• Toggle Static High/Low Lines – Enable or disable display for static levels
• Static Line Color & Style – Customize appearance of static high/low lines
• Toggle Dynamic High/Low Lines – Show/hide dynamic trend-based liquidity zones
• Dynamic Line Color & Style – Visual settings for dynamic lines
Conclusion
The Liquidity Finder Indicator MT4 is an advanced solution for detecting liquidity hotspots across financial charts. It assists traders in understanding institutional order placement zones and provides a visual representation of where liquidity is concentrated — whether from retail clusters or institutional activity — enhancing decision-making for entry and exit points.