• Aperçu
  • Avis (23)
  • Commentaires (38)
  • Nouveautés

Tipu CCI

4.8
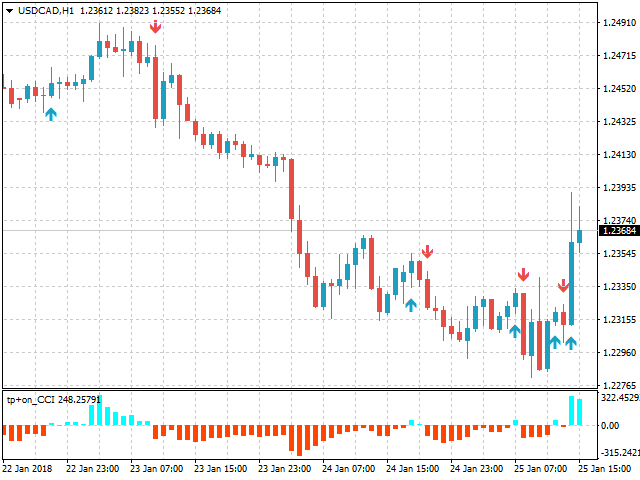
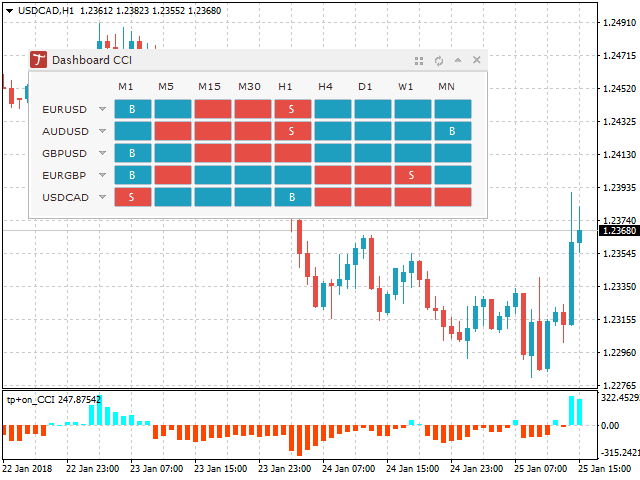
  • 28 symbols, multi-time frame powerful Dashboard for the full market view
  • Customizable Buy/Sell alerts, push alerts, email alerts, and visual on-screen alerts.
  • Marked buy/sell signals
  • Two color trend histogram.

The commodity channel index (CCI) is an oscillator originally introduced by Donald Lambert in 1980. CCI measures current price level relative to an average price level over a given period of time. CCI is high when prices are above the average price, and low when the prices are below the average price. CCI is a useful tool not only for identifying trend but also the overbought/oversold levels.


About Tipu Panel Series

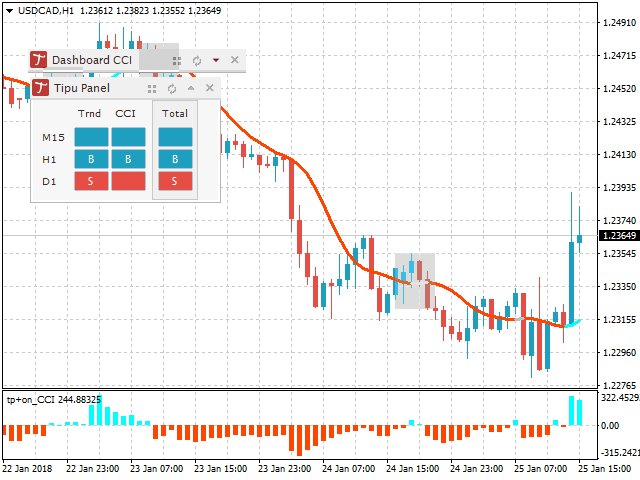
Tipu Panel series is set of indicators created to consolidate indicators in form of a panel. As a trader, indicators can easily create a cluster on the chart and distract you from the bigger picture. It can also be overwhelming and visually exhausting. Tipu Panel simplifies this by displaying each indicator in a beautifully boxed panel. You can customize the panel to display indicator signals for multiple time frames and also to quickly switch time frames. There are two types of indicators that make up the Tipu Panel series, the master indicator, and the add-in indicators. The master indicator (Tipu Panel indicator) plots a beautifully designed panel, and the add-in indicators feed the data to this master indicator panel. These two types of indicators work together for a faster, and efficient performance on the chart.


Calculation

CCI = (Typical Price - 20-period SMA of TP) / (.015 x Mean Deviation)


Parameters

  • Section #1 Tipu CCI settings
    • CCI Period – settings for CCI.
    • Applied Price – settings for CCI.
    • Overbought – settings for CCI.
    • Oversold – settings for CCI.
    • Mark Buy/Sell Signals - choose Arrow or Vertical Lines or nothing.
    • Arrow offset (pips) - (works only if mark the buy/sell signals = Arrow) select value to offset Arrows from high (if sell), and low (if buy). Increasing Arrow Offset (pips) move arrows away from the high/lows.
    • Buy/Sell Colors – Colors for the marks
  • Section #2 Multi-currency Dashboard setting
    • Enable Tipu Dashboard? – choose to display and hide.
    • Overbought/Oversold font and background colors on the Dashboard buttons.
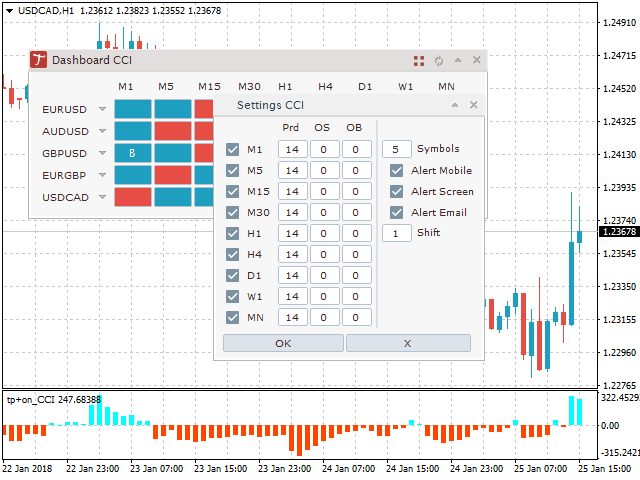
    • Additional settings for the Dashboard are controlled by the Dashboard settings button
  • Section #3 Tipu Panel Settings
    • Enable Panel?: visibility settings, select true/false to show panel (need Tipu Panel added to the chart).
    • Short Name for the Panel: short name for the panel heading on Tipu Panel
  • Section #4 Global Alert Settings
    • Alert Buy: select true/false to enable buy alerts.
    • Alert Sell: select true/false to enable sell alerts.
    • Alert Shift: candle delay for the signal, enter 1 if you want the alert sent after one candle to be passed.
    • Alert Mobile: select true/false to get the push notifications on your device, make sure the device settings are correct here.
    • Alert Onscreen: select true/false to get alert on the terminal, this alert is shown in a separate window.
    • Alert Email: select true/false to get email alerts, make sure email settings are correct here.
Avis 20
Sukru Denizgezen
221
Sukru Denizgezen 2023.05.05 12:44 
 

iyi çalışıyor teşekkürler paylaşım için EA sını yaptım bakalım kar edecekmi

Yerly
660
Yerly 2022.11.07 07:43 
 

Merci.

John Winsome Munar
3471
John Winsome Munar 2022.06.20 15:05 
 

Helpful indicator

Produits recommandés
Pin Bars
Yury Emeliyanov
5 (3)
Objectif principal: "Pin Bars" est conçu pour détecter automatiquement les barres pin sur les graphiques des marchés financiers. Une barre d'épingle est une bougie avec un corps caractéristique et une longue queue, qui peut signaler un renversement ou une correction de tendance. Comment ça marche: L'indicateur analyse chaque bougie sur le graphique, déterminant la taille du corps, de la queue et du nez de la bougie. Lorsqu'une barre d'épingle correspondant à des paramètres prédéfinis est déte
FREE
Extremum Reverse Bar
Yurij Izyumov
2.8 (5)
This indicator has been created for finding the probable reversal points of the symbol price. A small candlestick reversal pattern is used it its operation in conjunction with a filter of extremums. The indicator is not redrawn! If the extremum filter is disabled, the indicator shows all points that have a pattern. If the extremum filter is enabled, the condition works – if the history Previous bars 1 candles back contains higher candles and they are farther than the Previous bars 2 candle, such
FREE
Sm Ichimoku Scanner
Steeve Christian Martol
5 (4)
Multi Time Frame Indicator acts as a Scanner based on the Ichimoku Trading System. The outcome is displayed on a board. This helps you to make "at a glance" a mental picture of the System without having to open the chart. Up to 10 Currencies can be watched. Scanned elements And Legend "KUMO Futur" - Green : The Kumo Futur is Bullish. "KUMO Futur" - Red : The Kumo Futur is Bearish. "PRICE Cross KJ" - Green : The Price is Above the Kijun Sen.  "PRICE Cross KJ" - Red : The Price is Below the Kijun
FREE
Maltese cross GBP   Универсальный инструмент для определения трендов, флетов и торговли по графическим паттернам. Объединяет техники Гана, Эллиота, Мюррея. Просто разместите его на графике и он покажет направление и скорость движения цены, выделит разворотные моменты. Maltese cross поможет точно определять узловые моменты в истории, планировать торговые действия и сопровождать открытые сделки.  Эта бесплатная демонстрационная версия MalteseCross ограничена GBPUSD и кроссами GBP. Никаких прочих
FREE
EasyATR BacktestTool
Kim Thanh Nguyen
5 (1)
A tool for backtesting my ATR Trailing Stoploss Helper ( https://www.mql5.com/en/market/product/34103 ) Added on-screen buttons for manual backtesting: - Clicking on button SET, then click on a candle where you want to see how this indicator would draw the ATR trailing stop for that exact time. Parameter: DRAW_ATR_TRAILING_STOP_LEVEL_TIMEFRAME = PERIOD_H4; //timeframe to calculate the value of ATR DRAW_ATR_TRAILING_STOP_LEVEL_PERIOD = 10; //period of the ATR DRAW_ATR_TRAILING_STOP_LEVEL_MULTIPL
FREE
AC Pivot Panel:  AC Pivot Panel is a pivot point indicator including favorite selection panel accessible in the chart. For pivot traders, it is well convenient to easily and quickly can adjust their pivots setting in the chart. To reaching this goal, a panel has been considered to user can easily switch to each pivot levels by different method and time period.  In the current version:     All pivots including supports and resistance can be selected to display or disappear in the chart just by
FREE
Cet indicateur est conçu pour la création pratique et rapide de captures d'écran de graphiques dans le terminal de trading. Il simplifie grandement le processus d'enregistrement des graphiques dans un certain répertoire, en fournissant une interface pratique avec un bouton sur le graphique, qui est activé par un simple clic. Les principales fonctions de l'indicateur sont les suivantes Création automatique d'une capture d'écran du graphique lorsque le bouton est pressé. Possibilité de sélect
FREE
Highly configurable Demarker indicator. Features: Highly customizable alert functions (at levels, crosses, direction changes via email, push, sound, popup) Multi timeframe ability Color customization (at levels, crosses, direction changes) Linear interpolation and histogram mode options Works on strategy tester in multi timeframe mode (at weekend without ticks also) Adjustable Levels Parameters: Demarker Timeframe:  You can set the lower/higher timeframes for Demarker. Demarker Bar Shift: Y
FREE
Note: this product is a free limited version of the full featured product Currency Timeframe Strength Matrix . It only includes AUD, CAD, CHF currencies instead of all 8 currencies. It includes only 5S, 1M, 5M time frames instead of all 8 (5S, 1M, 5M, 15M, 30M, 1H, 4H, 1D). What is it? The Currency TimeFrame Strength Matrix is a simple and comprehensive Forex map that gives a snapshot of what is happening in the Forex market at the very present time. It illustrates the strength and momentum
FREE
TrendPlus
Sivakumar Subbaiya
4.08 (12)
Trend Plus   Trendplus  Indicator   Time Frame: Suitable for any time frame.  Purpose: Trend Prediction. Blue and red candle indicate the buy and sell call respectively. Buy: When the blue candle is formed buy call is initiated. close the buy trades when the next red candle will formed.   Sell: When the Red candle is formed Sell call is initiated. close the Sell trades when the next blue candle will formed.   Happy trade!!
FREE
Head and Shoulders Pattern Indicator - Your Key to Recognizing Trend Reversals Unlock the power of pattern recognition with the "Head and Shoulders Pattern Indicator." This cutting-edge tool, designed for MetaTrader, is your trusted ally in identifying one of the most powerful chart patterns in technical analysis. Whether you're a novice or an experienced trader, this indicator simplifies the process of spotting the Head and Shoulders pattern, allowing you to make informed trading decisions. Key
FREE
Wise Men Indicator demo
Bohdan Kasyanenko
3 (2)
The indicator displays signals according to the strategy of Bill Williams on the chart. Demo version of the indicator has the same features as the paid, except that it can work only on a demo account . Signal "First Wise Man" is formed when there is a divergent bar with angulation.  Bullish divergent bar - with lower minimum and closing price in the upper half. Bearish divergent bar - higher maximum and the closing price at the bottom half. Angulation is formed when all three lines of Alligat
FREE
Triple RSI
Pablo Leonardo Spata
1 (1)
LOOK AT THE FOLLOWING STRATEGY WITH THIS INDICATOR. Triple RSI is a tool that uses the classic Relative Strength Indicator, but in several timeframes to find market reversals.    1.  ️ Idea behind the indicator and its strategy: In Trading, be it Forex or any other asset, the ideal is to keep it simple, the simpler the better . The triple RSI strategy is one of the simple strategies that seek market returns. In our experience, where there is more money to always be won, is in the marke
FREE
This indicator calculates gann support and resistance prices with use gann pyramid formulation and draw them on the chart. And If you want, Indicator can alert you when the current price arrive these pivot levels. Alert Options: Send Mobil Message, Send E-mail, Show Message and Sound Alert Levels: S1, S2, S3, S4, S5, R1, R2, R3, R4, R5 Inputs:  GannInputPrice: Input price for gann pyramid formulation. GannInputDigit: How many digit do you want to use for calculation formula. (The number and the
FREE
MT4 Candlestick Pattern Alert Indicator: Stay Ahead of Trading Opportunities Overview The MT4 Candlestick Pattern Alert Indicator is a robust tool designed to empower traders by detecting candlestick patterns and delivering timely alerts through notifications, emails, and pop-up alerts. This invaluable tool saves traders precious time, allowing focused analysis on patterns and potential profitable trades. Importance of Candlestick Patterns Candlestick patterns are pivotal in technical analysis,
FREE
The indicator searches for matches in history for a specified range of the latest known oscillated Moving Average data. Found matches are indicated on the graph as colored fields. Analysis of historical data (the behavior of quotes in history) will help make decisions in trading. The matches found are updated when a new bar is opened (i.e., the calculation is performed upon opening prices). The value of the increase accuracy (Accuracy) must be changed with a decrease in the timeframe, and
FREE
Trendline Architect
Torsten Hempel
5 (4)
This indicator calculates and draws lines over the chart. There are two types of trends: Trend A: the line is drawn using local lows for uptrends and local highs for downtrends Trend B: the line is drawn using local highs for uptrends and local lows for downtrends There are a few conditions, which have to be fulfilled and can be changed by the parameters (see also picture 4): MinBarAge : the count of bars to the last base point of a line is called BarAge and has to be greater than the parameter
FREE
Highly configurable Osma indicator. Features: Highly customizable alert functions (at levels, crosses, direction changes via email, push, sound, popup) Multi timeframe ability Color customization (at levels, crosses, direction changes) Linear interpolation and histogram mode options Works on strategy tester in multi timeframe mode (at weekend without ticks also) Adjustable Levels Parameters: Osma Timeframe:  You can set the lower/higher timeframes for Osma. Osma     Bar Shift:  Y ou can set
FREE
--- FREE VERSION - WORKS ONY ON EURUSD ------------------------------------------------------------------- This is a unique breakout strategy that is used for determination of the next short term trend/move. The full system is available on MQL5 under the name "Forecast System". Here is the link -->  https://www.mql5.com/en/market/product/104166?source=Site Backtest is not possible, because calculations are done based on the data of all timeframes/periods. Therefore I propose you use the technol
FREE
Introducing our groundbreaking indicator designed to elevate your trading experience by employing a unique fusion of price and time calculations. This innovative tool goes beyond traditional methods, utilizing advanced algorithms to draw levels and determine the authenticity of market peaks. Welcome to a new era of precision trading with our [Indicator Name]! Key Features: Price and Time Calculations: Harnesses the power of sophisticated price and time calculations to identify key levels on the
FREE
A new interpretation of the classical indicator in the form of an oscillator for a more accurate representation of the situation on the market. Less lagging than the standard Alligator. All settings are fully accessible, such as the type and prices for which it is built. Thanks to the additional parameters, it became possible to fine tune. Distinctive features Does not redraw. Additional parameters for fine tuning. Works on all timeframes and symbols. Suitable for manual trading and developm
FREE
Chart Symbol Changer for MT4
Juvenille Emperor Limited
5 (7)
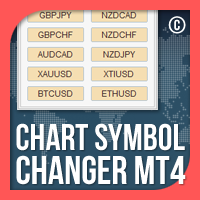
Chart Symbol Changer pour MT4 est un indicateur/utilitaire qui vous offre la possibilité de changer le symbole graphique actuel qui est attaché en cliquant sur un bouton de symbole sur son panneau. Chart Symbol Changer pour MT4 vous donne la possibilité de configurer les 32 boutons de symboles selon vos préférences personnelles, en ajoutant les paires que vous souhaitez surveiller et échanger le plus. De cette façon, vous ne manquerez jamais une opportunité, car vous pouvez avoir une vue plus r
FREE
(traduction Google) Cet indicateur est basé sur le " Time Segmented Volume (TSV) " original développé par Worden Brothers, Inc . Cependant, j'ai ajouté quelques fonctionnalités supplémentaires à celui-ci. On peut choisir le prix à appliquer, au lieu d'avoir uniquement le prix de clôture par défaut utilisé par l'original. On peut également choisir la pondération de volume à utiliser, y compris un pseudo-volume basé sur la plage réelle, ou aucune pondération de volume du tout. (Original text) This
FREE
Indicator ini berdasarkan Gain ADX - Follow Trend - Disertai Pivot, Support & Resistant Daily Dengan indicator ini semoga menjadikan indicator yang porofit able, selama mengikuti signal yang tampil, apabila berwarna Hijau siap2 untuk Buy, dan berwarna Merah siap2 untuk Sell. Akan tampil signal Sell/Buy di saat gain mencukupi, baik TF Kecil maupun TF Besar TF Besar / High TF adalah Trend Kuat TF Kecil / Low TF adalah Trend Lemah Open Posisi pada High TF, signal akan menunjukkan Sell/Buy.
FREE
BoxInside MT4
Evgeny Shevtsov
4.86 (7)
This indicator calculates the volume profile and places labels that correspond to the VAH, VAL and POC levels, for each candle individually. Indicator operation features The indicator works on the timeframes from M5 to MN, but it uses the history data of smaller periods: M1 - for periods from M5 to H1, M5 - for the H4 period, M30 - for the D1 period, H4 - for the W1 period, D1 - for the MN period. The color and location of the VAL, VAH and POC labels on the current candle are considered to be
FREE
Basic Supply Demand
Mehran Sepah Mansoor
4.33 (3)
L'indicateur de base de l'offre et de la demande est un outil puissant conçu pour améliorer votre analyse du marché et vous aider à identifier les zones clés d'opportunité sur n'importe quel graphique. Avec une interface intuitive et facile à utiliser, cet indicateur Metatrader gratuit vous donne une vision claire des zones d'offre et de demande, vous permettant de prendre des décisions de trading plus informées et plus précises / Version MT5 gratuite Scanner du tableau de bord pour cet indicate
FREE
BB Engulfing Bar V2
Nedyalka Zhelyazkova
4.57 (7)
The indicator defines the Bullish and Bearish Engulfing Bar. The pattern has greater reliability when the open price of the engulfing candle is well above the close of the first candle, and when the close of the engulfing candle is well below the open of the first candle. For an engulfing bar to be valid it must fully engulf at least one previous bar or candle - includes all the body and the wick. The engulfing bar can engulf more than one bar as long as it completely engulfs the previous bar.
FREE
BB Engulfing Bar
Nedyalka Zhelyazkova
3.25 (4)
The indicator defines the Bullish and Bearish Engulfing Bar. The pattern has greater reliability when the open price of the engulfing candle is well above the close of the first candle, and when the close of the engulfing candle is well below the open of the first candle. For an engulfing bar to be valid it must fully engulf at least one previous bar or candle - includes all the body and the wick. The engulfing bar can engulf more than one bar as long as it completely engulfs the previous bar.
FREE
Dear Friends, Market Inforamtion Downloader is a simple utilities program to download the market informations in a separate excel file with the name of the current chart you are using with same time frame. You needed to enter the number of periods. example. I'm in EURUSD, Day time frame. I choose to download the data last 50 candles(50 days) then I will enter 50 in the periods. After you getting the data, you use it for various analysis. Regards, Sankar Ganesh 
FREE
Iceberg Divergen Indicator
Komang Putra Riswanjaya
5 (2)
Iceberg Divergence Indicator will help traders to find divergent patterns that occur on the charts very easily and simply This indicator will visualize divergences pattern that occur on the chart by combining it with an awesome oscillator indicator Key Features Easy to use : The Iceberg divergent indicator is made as simple as possible so that it is easy to use Pattern Visualization : Divergent patterns will be visualized on the live chart Precision : The indicator detects divergent patterns
FREE
Les acheteurs de ce produit ont également acheté
Gann Made Easy
Oleg Rodin
4.86 (83)
Gann Made Easy est un système de trading Forex professionnel et facile à utiliser qui est basé sur les meilleurs principes de trading en utilisant la théorie de mr. WD Gann. L'indicateur fournit des signaux d'ACHAT et de VENTE précis, y compris les niveaux Stop Loss et Take Profit. Vous pouvez échanger même en déplacement en utilisant les notifications PUSH. S'il vous plaît contactez-moi après l'achat! Je partagerai avec vous mes astuces de trading et d'excellents indicateurs bonus gratuitement!
- Real price is 80$ - 40% Discount ( It is 49$ now ) Contact me for instruction, add group and any questions! Related Products:  Bitcoin Expert , Gold Expert Introduction The breakout and retest strategy is traded support and resistance levels. it involves price breaking through a previous level.  The break and retest strategy is designed to help traders do two main things, the first is to avoid false breakouts. Many false breakouts start with a candlestick that breaks out of a level but ends w
FX Volume
Daniel Stein
4.58 (33)
Obtenez votre mise à jour quotidienne du marché avec des détails et des captures d'écran via notre Morning Briefing ici sur mql5 et sur Telegram ! FX Volume est le PREMIER et SEUL indicateur de volume qui fournit un VRAI aperçu du sentiment du marché du point de vue d'un courtier. Il fournit des informations impressionnantes sur la façon dont les acteurs institutionnels du marché, comme les courtiers, sont positionnés sur le marché des changes, bien plus rapidement que les rapports COT. Voir c
Enigmera
Ivan Stefanov
5 (3)
ENIGMERA : Le cœur du marché https://www.enigmera.com Introduction Cet indicateur et ce système de trading constituent une approche remarquable des marchés financiers. ENIGMERA utilise les cycles fractals pour calculer avec précision les niveaux de support et de résistance. Il indique la phase d'accumulation authentique et donne une direction et des objectifs.  Un système qui fonctionne que nous soyons dans une tendance ou une correction.  Comment fonctionne-t-il ? ENIGMERA comprend trois l
Gold Stuff
Vasiliy Strukov
4.89 (241)
Gold Stuff est un indicateur de tendance conçu spécifiquement pour l'or et peut également être utilisé sur n'importe quel instrument financier. L'indicateur ne se redessine pas et ne traîne pas. Délai recommandé H1. Au niveau de l'indicateur de travail, l'Expert Advisor EA Gold Stuff est entièrement automatique. Vous pouvez le trouver sur mon profil. Vous pouvez obtenir une copie gratuite de notre indicateur Strong Support et Trend Scanner, veuillez envoyer un message privé. moi! Contactez
Atomic Analyst
Issam Kassas
5 (2)
Tout d'abord, il convient de souligner que cet indicateur de trading n'est ni repainting, ni redrawing et ne présente aucun délai, ce qui le rend idéal à la fois pour le trading manuel et automatisé. Manuel de l'utilisateur : réglages, entrées et stratégie. L'Analyste Atomique est un indicateur d'action sur les prix PA qui utilise la force et le momentum du prix pour trouver un meilleur avantage sur le marché. Équipé de filtres avancés qui aident à éliminer les bruits et les faux signaux, et à
FX Power MT4 NG
Daniel Stein
5 (13)
Obtenez votre mise à jour quotidienne du marché avec des détails et des captures d'écran via notre Morning Briefing ici sur mql5 et sur Telegram ! FX Power MT4 NG est la nouvelle génération de notre très populaire indicateur de force des devises, FX Power. Et qu'est-ce que ce compteur de force de nouvelle génération offre ? Tout ce que vous avez aimé de l'original FX Power PLUS Analyse de la force de l'OR/XAU Des résultats de calcul encore plus précis Périodes d'analyse configurables individuel
Trend Punch
Mohamed Hassan
4.95 (19)
This indicator is unstoppable when combined with our other indicator called  Support & Resistance . After purchase, send us a message and you will get it   for  FREE as a BONUS! Introducing Trend Punch , the revolutionary forex trend indicator that will transform the way you trade! Trend Punch is uniquely designed to provide precise buy and sell arrows during strong market trends, making your trading decisions clearer and more confident. Whether you're trading major currency pairs or exotic sym
Gann Swing Structure
Kirill Borovskii
5 (1)
This indicator is based on the mathematics of the great trader W.D. Ganna. With its help, you can easily find strong levels by analyzing swings to find the optimal entry point. The indicator works on all instruments and all timeframes. The indicator is fully manual and has control buttons. All you need to do is press the NEW button, a segment will appear, which you can place on any movement, swing or even 1 candle that you want to analyze. By placing the segment, press the OK button. A grid (th
Scalper Inside PRO
Alexey Minkov
4.73 (56)
An exclusive indicator that utilizes an innovative algorithm to swiftly and accurately determine the market trend. The indicator automatically calculates opening, closing, and profit levels, providing detailed trading statistics. With these features, you can choose the most appropriate trading instrument for the current market conditions. Additionally, you can easily integrate your own arrow indicators into Scalper Inside Pro to quickly evaluate their statistics and profitability. Scalper Inside
Dynamic Forex28 Navigator
Bernhard Schweigert
5 (1)
Dynamic Forex28 Navigator - L'outil de trading Forex de nouvelle génération. ACTUELLEMENT 49 % DE RÉDUCTION. Dynamic Forex28 Navigator est l'évolution de nos indicateurs populaires de longue date, combinant la puissance de trois en un : Advanced Currency Strength28 Indicator (695 avis) + Advanced Currency IMPULSE avec ALERT (520 avis) + CS28 Combo Signals (Bonus). Détails sur l'indicateur https://www.mql5.com/en/blogs/post/758844 Qu'offre l'indicateur de force de nouvelle génération ? T
Actuellement 20% de réduction ! La meilleure solution pour tout débutant ou trader expert ! Ce logiciel de tableau de bord fonctionne sur 28 paires de devises. Il est basé sur 2 de nos principaux indicateurs (Advanced Currency Strength 28 et Advanced Currency Impulse). Il donne un excellent aperçu de l'ensemble du marché Forex. Il montre les valeurs de l'Advanced Currency Strength, la vitesse de mouvement des devises et les signaux pour 28 paires de devises dans tous les (9) délais. Imagine
Trend Screener
STE S.S.COMPANY
4.81 (88)
Indicateur de tendance, solution unique révolutionnaire pour le trading et le filtrage des tendances avec toutes les fonctionnalités de tendance importantes intégrées dans un seul outil ! Il s'agit d'un indicateur multi-période et multi-devises 100 % non repeint qui peut être utilisé sur tous les symboles/instruments : forex, matières premières, crypto-monnaies, indices et actions. OFFRE À DURÉE LIMITÉE : L'indicateur Support and Resistance Screener est disponible pour seulement 50 $ et à vie. (
TPSproTREND PrO
Roman Podpora
4.79 (19)
TPSpro TREND PRO   est un indicateur de tendance qui analyse automatiquement le marché et fournit des informations sur la tendance et chacun de ses changements, ainsi que des signaux pour entrer dans des transactions sans redessiner ! L'indicateur utilise chaque bougie et les analyse séparément. faisant référence à différentes impulsions - impulsion ascendante ou descendante. Points d'entrée précis dans les transactions sur les devises, les crypto-monnaies, les métaux, les actions, les indices 
Nous vous présentons ON Trade Waves Patterns Harmonic Elliot Wolfe, un indicateur avancé conçu pour détecter divers types de schémas sur le marché à l'aide de méthodes manuelles et automatiques. Voici comment il fonctionne : Schémas Harmoniques : Cet indicateur peut identifier les schémas harmoniques qui apparaissent sur votre graphique. Ces schémas sont essentiels pour les traders qui pratiquent la théorie du trading harmonique, telle qu'elle est décrite dans le livre de Scott Carney "Harmonic
Scalper Vault
Oleg Rodin
5 (27)
Scalper Vault est un système de scalpage professionnel qui vous fournit tout ce dont vous avez besoin pour un scalpage réussi. Cet indicateur est un système de trading complet qui peut être utilisé par les traders de forex et d'options binaires. Le délai recommandé est M5. Le système vous fournit des signaux fléchés précis dans le sens de la tendance. Il vous fournit également des signaux supérieurs et inférieurs et des niveaux de marché Gann. Les indicateurs fournissent tous les types d'alertes
TPA True Price Action indicator reveals the true price action of the market makers through 100% non-repainting signals (except early signals mode) strictly at the close of a candle! TPA shows entries and re-entries, every time the bulls are definitely stronger than the bears and vice versa. Not to confuse with red/green candles. The shift of power gets confirmed at the earliest stage and is ONE exit strategy of several. There are available now two free parts of the TPA User Guide for our custo
Stratos Pali
Michela Russo
5 (1)
Stratos Pali Indicator   is a revolutionary tool designed to enhance your trading strategy by accurately identifying market trends. This sophisticated indicator uses a unique algorithm to generate a complete histogram, which records when the trend is Long or Short. When a trend reversal occurs, an arrow appears, indicating the new direction of the trend. Important Information Revealed Leave a review and contact me via mql5 message to receive My Top 5 set files for Stratos Pali at no cost! D
Currency Strength Wizard est un indicateur très puissant qui vous offre une solution tout-en-un pour un trading réussi. L'indicateur calcule la puissance de telle ou telle paire de devises en utilisant les données de toutes les devises sur plusieurs périodes. Ces données sont représentées sous la forme d'un indice de devise facile à utiliser et de lignes électriques de devise que vous pouvez utiliser pour voir la puissance de telle ou telle devise. Tout ce dont vous avez besoin est d'attacher l'
Le système PRO Renko est un système de trading très précis spécialement conçu pour le trading de graphiques RENKO. Il s'agit d'un système universel qui peut être appliqué à divers instruments de négociation. Le système neutralise efficacement ce qu'on appelle le bruit du marché en vous donnant accès à des signaux d'inversion précis. L'indicateur est très facile à utiliser et n'a qu'un seul paramètre responsable de la génération du signal. Vous pouvez facilement adapter l'outil à n'importe q
Black dragon indicator
Ramil Minniakhmetov
4.86 (111)
L'indicateur de détection de tendance complètera toute stratégie et peut également être utilisé comme un outil indépendant. IMPORTANT! Contactez-moi immédiatement après l'achat pour recevoir des instructions et un bonus ! Recommandations pour travailler avec l'indicateur, vous pouvez télécharger en commentaire #5 Avantages Facile à utiliser, ne surcharge pas le graphique avec des informations inutiles ; Capacité à utiliser comme filtre pour n'importe quelle stratégie ; Il a des niveaux
TPSpro RFI Levels
Roman Podpora
4.82 (22)
INSTRUCTIONS       RUS   -   ANGLAIS       Il   est recommandé de l'utiliser avec un indicateur       -       TPSpro   TENDANCE PRO -   Version MT4         Un élément clé du trading est constitué par les zones ou les niveaux à partir desquels les décisions d'achat ou de vente d'un instrument de trading sont prises. Malgré les tentatives des principaux acteurs de dissimuler leur présence sur le marché, ils laissent inévitablement des traces. Notre tâche était d'apprendre à identifier ces traces
Currency Strength Exotics
Bernhard Schweigert
4.87 (30)
ACTUELLEMENT 20% DE RÉDUCTION ! La meilleure solution pour tout débutant ou trader expert ! Cet indicateur est spécialisé pour montrer la force de la devise pour tous les symboles comme les paires exotiques, les matières premières, les indices ou les contrats à terme. C'est le premier de son genre, n'importe quel symbole peut être ajouté à la 9ème ligne pour montrer la force réelle de la devise de l'or, l'argent, le pétrole, DAX, US30, MXN, TRY, CNH etc. Il s'agit d'un outil de trading uniq
Trend Pulse
Mohamed Hassan
5 (4)
Please contact me after purchase to immediately get your PDF strategy + documentation for Trend Pulse !  Introducing Trend Pulse , a unique and robust indicator capable of detecting bullish, bearish, and even ranging trends! Trend Pulse uses a special algorithm to filter out market noise with real precision. If the current symbol is moving sideways, Trend Pulse will send you a ranging signal, letting you know that it's not a good time to enter a trade. This excellent system makes Trend Pulse
Tout d'abord, il convient de souligner que cet outil de trading est un indicateur non repeint, non redessiné et non retardé, ce qui le rend idéal pour le trading professionnel. Cours en ligne, manuel utilisateur et démonstration. L'indicateur Smart Price Action Concepts est un outil très puissant à la fois pour les nouveaux et les traders expérimentés. Il regroupe plus de 20 indicateurs utiles en un seul, combinant des idées de trading avancées telles que l'analyse du trader Inner Circle et les
MetaBands M4
Vahidreza Heidar Gholami
5 (2)
MetaBands uses powerful and unique algorithms to draw channels and detect trends so that it can provide traders with potential points for entering and exiting trades. It’s a channel indicator plus a powerful trend indicator. It includes different types of channels which can be merged to create new channels simply by using the input parameters. MetaBands uses all types of alerts to notify users about market events. Features Supports most of the channel algorithms Powerful trend detection algorith
ICT, SMC, SMART MONEY CONCEPTS, SMART MONEY, Smart Money Concept, Support and Resistance, Trend Analysis, Price Action, Market Structure, Order Blocks, BOS/CHoCH,   Breaker Blocks ,  Momentum Shift,   Supply&Demand Zone/Order Blocks , Strong Imbalance, HH/LL/HL/LH,    Fair Value Gap, FVG,  Premium  &   Discount   Zones, Fibonacci Retracement, OTE, Buy Side Liquidity, Sell Side Liquidity, BSL/SSL Taken, Equal Highs & Lows, MTF Dashboard, Multiple Time Frame, BigBar, HTF OB, HTF Market Structure, 
Gold Channel is a volatility-based indicator, developed with a specific timing algorithm for the XAUUSD pair, which consists of finding possible corrections in the market. This indicator shows two outer lines, an inner line (retracement line) and an arrow sign, where the theory of the channel is to help identify overbought and oversold conditions in the market. The market price will generally fall between the boundaries of the channel. If prices touch or move outside the channel it is a tra
Le profit de la structure du marché change à mesure que le prix s'inverse et recule. L'indicateur d'alerte d'inversion de la structure du marché identifie le moment où une tendance ou un mouvement de prix approche de l'épuisement et est prêt à s'inverser. Il vous avertit des changements dans la structure du marché qui se produisent généralement lorsqu'un renversement ou un recul majeur est sur le point de se produire. L'indicateur identifie initialement les cassures et la dynamique des prix,
Automated Trendlines
Georgios Kalomoiropoulos
5 (16)
Les lignes de tendance sont l'outil d'analyse technique le plus essentiel dans le trading forex. Malheureusement, la plupart des commerçants ne les dessinent pas correctement. L'indicateur Automated Trendlines est un outil professionnel pour les traders sérieux qui vous aide à visualiser le mouvement de tendance des marchés. Il existe deux types de lignes de tendance, les lignes de tendance haussières et les lignes de tendance baissières. Dans la tendance haussière, la ligne de tendance
Plus de l'auteur
Tipu Stochastic
Kaleem Haider
3.86 (7)
Tipu Stochastic is the modified version of the original Stochastic Oscillator published by MetaQuotes here . Features Choose three types of signals (Reversals, Main Signal Cross, and Overbought/Oversold Cross). Customizable Buy/Sell alerts, push alerts, email alerts, and visual on-screen alerts. Marked overbought and oversold levels. Add Tipu Panel (found here ) and unlock the following additional features: An easy to use Panel that shows the trend + signal of the selected time frames. Show St
Tipu RSI
Kaleem Haider
4.59 (34)
Tipu RSI Features 28 symbols, multi-time frame powerful Dashboard for the full market view Customizable Buy/Sell alerts, push alerts, email alerts, and visual on-screen alerts. Marked overbought and oversold levels. Three colors RSI that marks the normal, oversold and overbought levels. The relative strength index (RSI) is an oscillator devised by J. Welles Wilder in his famous book New Concepts in Technical Trading Systems in 1978.1 He also introduced Parabolic SAR (see Tipu Parabollic SAR Pane
FREE
Tipu Heikin Ashi Panel
Kaleem Haider
4.56 (18)
Tipu Heikin-Ashi Panel is the modified version of the original Heiken Ashi indicator published by MetaQuotes here . A professional version of this indicator is available here . Features An easy to use Panel that shows the Heiken Ashi trend of selected timeframe. Customizable Buy/Sell alerts, push alerts, email alerts, or visual on-screen alerts. Customizable Panel. The panel can be moved to any place on the chart or minimized to allow more space. Heikin means "the average", and Ashi means "foo
FREE
Tipu Trend
Kaleem Haider
4.5 (8)
Tipu Trend is a non-lag, non-repaint, smart indicator, that shows the trend of selected time frames. Features Customizable Buy/Sell alerts, push alerts, email alerts, or visual on-screen alerts. As easy to trade indicator that smooths the noise in the price action. Highlights ranging markets. Add Tipu Panel (found here ) and unlock the following additional features. An easy to use Panel that shows the trend + signal of the selected time frames. Customizable Panel. The panel can be moved to any
FREE
Tipu Parabolic SAR Panel
Kaleem Haider
4.91 (11)
Tipu Parabolic SAR Panel is the modified version of the original Parabolic SAR indicator published by MetaQuotes here . Dashboard Panel (multi symbol) version for this indicator is available here . Features An easy to use Panel that shows the Parabolic SAR trend and signals of selected timeframe. Customizable Buy/Sell alerts, push alerts, email alerts, or visual on-screen alerts. Customizable Panel. The panel can be moved to any place on the chart or minimized to allow more space. To enable th
FREE
Tipu Panel
Kaleem Haider
4.88 (8)
Tipu Panel series is set of innovative indicators created to consolidate indicators in form of a panel. As a trader, indicators can easily create a cluster on the chart and distract you from the bigger picture. It can also be overwhelming and visually exhausting. Tipu Panel simplifies this by displaying each indicator in a beautifully boxed panel. You can customize the panel to display indicator signals for multiple time frames and also to quickly switch time frames. There are two types of indic
FREE
Tipu Trader
Kaleem Haider
3 (2)
Tipu Trader is a part of Tipu Panel ecosystem that was developed out of need for quick and simple trading. Tipu Trader is an easy to use trade panel for commonly used trade functions. Create you own signals with Tipu Panel and trade along with Tipu Trader, a simple and easy to use trade panel. Features An easy to use trade panel for most commonly used trade functions. Create your own personal trade signals with Tipu Panel , and trade with Tipu Trader. Customizable Panel. The panel can be moved
FREE
Tipu Stops
Kaleem Haider
5 (6)
Tipu Stops is a simple indicator that plots buy/sell stop loss channels and pips value using commonly used indicators. Tipu Stops also works complementary to the Tipu Trader Panel. You can use the stop loss values from Tipu Stops in Tipu Trader before using the panel for trading. How to Use Add the indicator to the chart and select your preferred method of stop loss plot. You may choose from the following methods: Average True Range on PRICE_CLOSE. Average True Range bands on Hull Moving Avera
FREE
Tipu Parabolic SAR Dashboard is based on the Tipu Parabolic SAR indicator. Please contact me here at MQL5 if you would like to use this panel for your custom signals. Tipu Parabolic SAR Dashboard is a multi-currency, multi-timeframe panel created to help traders in analyzing the markets quickly using the Parabolic SAR indicator signal. The dashboard panel is designed to help traders quickly change symbols and periods. If you are constantly missing trade opportunities while browsing through the
Filtrer:
Sukru Denizgezen
221
Sukru Denizgezen 2023.05.05 12:44 
 

iyi çalışıyor teşekkürler paylaşım için EA sını yaptım bakalım kar edecekmi

rgener1962
14
rgener1962 2022.12.30 10:30 
 

Très bien. merci

Yerly
660
Yerly 2022.11.07 07:43 
 

Merci.

Mauro Giuseppe Tondo
1990
Mauro Giuseppe Tondo 2022.09.28 02:11 
 

good

John Winsome Munar
3471
John Winsome Munar 2022.06.20 15:05 
 

Helpful indicator

ulynoff
14
ulynoff 2021.02.06 12:40 
 

На меньших ТF частенько не успивает,на старших более точен до 80%.

Valentin Butorin
4123
Valentin Butorin 2020.10.03 13:53 
 

L'utilisateur n'a laissé aucun commentaire sur la note

rambreak
75
rambreak 2020.05.01 21:58 
 

L'utilisateur n'a laissé aucun commentaire sur la note

Thomas Fairhurst
1188
Thomas Fairhurst 2019.06.15 10:34 
 

Very useful indicator. I like the attention for detail.

Victor Manuel Valderrama Zamora
7866
Victor Manuel Valderrama Zamora 2019.03.11 07:50 
 

L'utilisateur n'a laissé aucun commentaire sur la note

Palmix
134
Palmix 2019.01.12 16:30 
 

Отличный индикатор - с точностью до 90%! До сих пор работаю со старой версией - без панели. Мне она больше нравится ))

Matthew Todorovski
12938
Matthew Todorovski 2018.06.30 13:31 
 

L'utilisateur n'a laissé aucun commentaire sur la note

zacante
631
zacante 2018.05.23 04:04 
 

L'utilisateur n'a laissé aucun commentaire sur la note

Alexey Suvorov
779
Alexey Suvorov 2018.04.05 09:05 
 

L'utilisateur n'a laissé aucun commentaire sur la note

Tim Eubanks
5762
Tim Eubanks 2018.03.14 01:11 
 

L'utilisateur n'a laissé aucun commentaire sur la note

Michal Vido
241
Michal Vido 2018.01.25 21:29 
 

great

Samuele Borella
955
Samuele Borella 2018.01.10 17:43 
 

Absolutely great indicator.!!!

Wildwood2012
34
Wildwood2012 2017.11.20 17:17 
 

Great product!

Ali irwan
5135
Ali irwan 2017.07.20 08:51 
 

L'utilisateur n'a laissé aucun commentaire sur la note

Gennadiy Voltornist
11909
Gennadiy Voltornist 2017.04.22 17:39 
 

L'utilisateur n'a laissé aucun commentaire sur la note

12
Répondre à l'avis
Version 2.20 2018.05.14
Added a reset button to reset settings to default in the dashboard settings
Added checkbox option for the total column and checkbox option for the total column alerts only.
Changed the minimum CCI oversold period to -200, and maximum CCI overbought period to 200.
Version 2.10 2018.02.06
Fixed dashboard crash possibly caused by other indicators, the dashboard is based on objects and deleting "all" object from other indicators can cause dashboard to crash
Version 2.0 2018.01.29
New version 2.0
Added 28 symbols, all timeframes dashboard, control settings from the dashboard
Compatible with Tipu Panel v2.0, added support for monthly timeframe on Tipu panel
Fixed alerts
Version 1.30 2017.06.26
Fixed problem with buy/sell alerts. Added option to enable/disable buy, and sell alerts.
Version 1.20 2016.05.31
Fixed issue with scrolling back. The indicator was breaking and giving false picture when scrolling to previous unloaded time.
Version 1.10 2016.03.16
Added support for all time frames (except month) on Tipu Panel.