Daily ATR Zones
- Indicateurs
- Andrii Kovalevskyi
- Version: 1.0
Daily ATR Zones – Precision Intraday Range Mapping
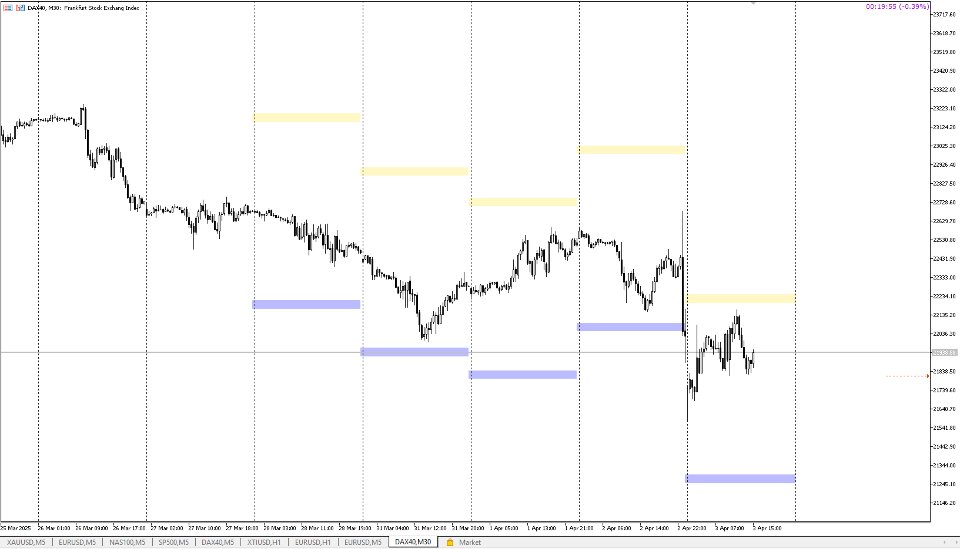
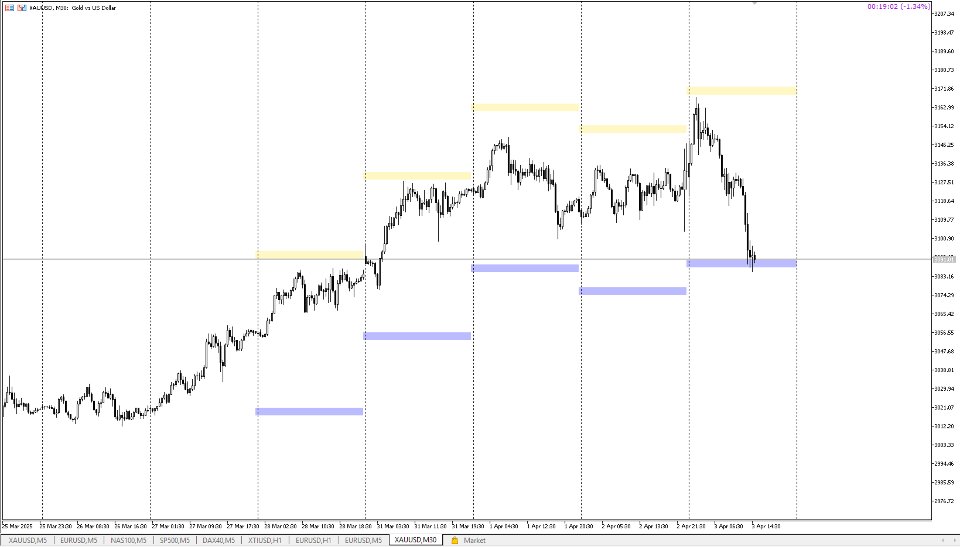
Daily ATR Zones is a clear tool that plots intraday high/low targets using the Average True Range (ATR) of the previous days. These zones help traders anticipate potential price extremes, identify liquidity pockets, and define reversal or breakout levels — all based on objective volatility data.
Key Features:
✅ Flat Zone Logic — Based on Open ± ATR , not bands around price
✅ Custom Zone Thickness — Adjustable via ATR ratio ( ZoneHeightRatio )
✅ Clean Visualization — Draws filled rectangles instead of lines
✅ Daily Zone Mapping — Choose to show only the most recent or last few days
✅ No Repainting — Zones are calculated using historical D1 data
✅ Lightweight & Efficient — Optimized to work on any timeframe
How It Works
For each trading day:
-
The indicator gets the Daily Open and the ATR value.
-
Then it calculates:
-
Upper Zone: from Open + ATR upward
-
Lower Zone: from Open - ATR downward
-
-
Rectangles are drawn at those levels with fixed thickness (e.g., 10% of ATR )
-
Zones update daily and remain static after creation.
