• Aperçu
  • Avis
  • Commentaires

RSI Divergence Suite Pro

RSI Divergence Suite Pro - Indicateur Avancé pour MetaTrader 5

Aperçu Le RSI Divergence Suite Pro est un indicateur technique avancé pour MetaTrader 5 qui détecte automatiquement les divergences entre le prix et le RSI, fournissant des signaux de trading de haute précision. Cet indicateur professionnel combine la puissance du RSI avec l'analyse des divergences, le support/résistance multi-timeframe et un système d'alerte complet.

Caractéristiques Principales

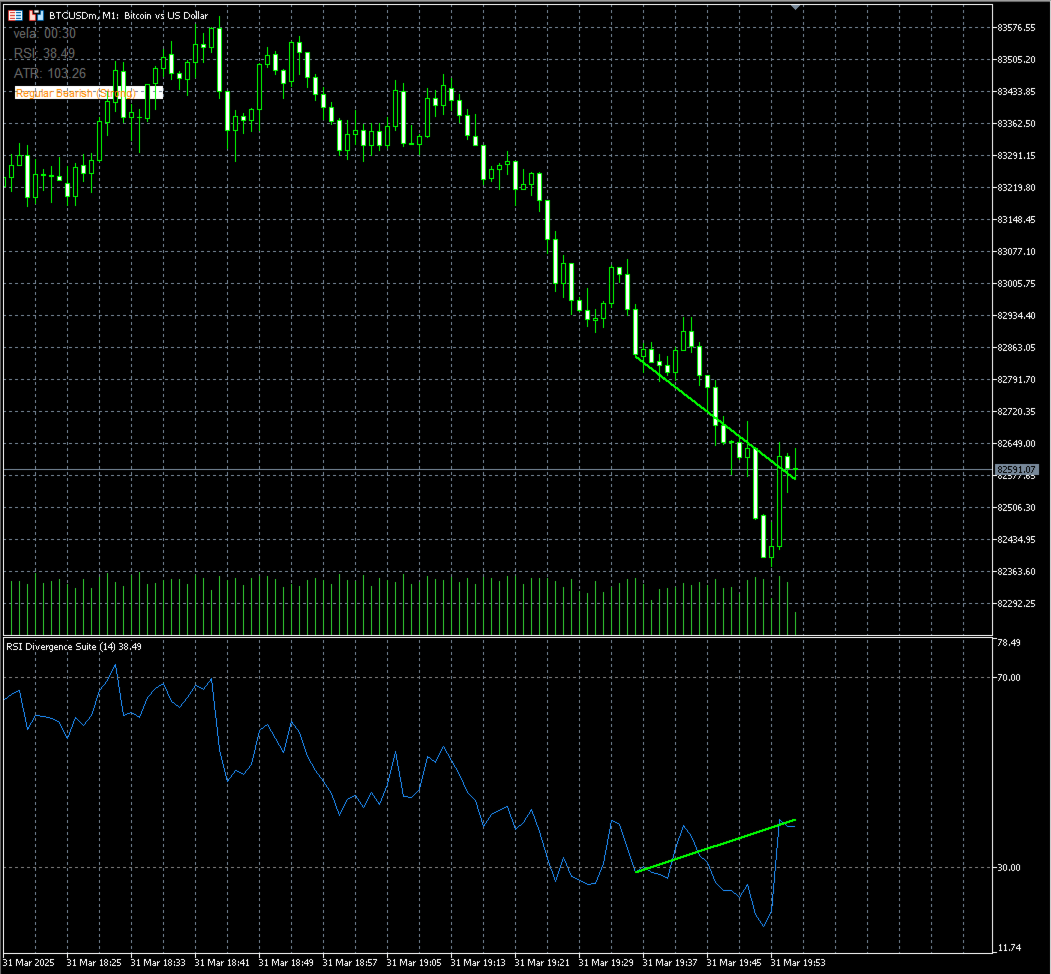
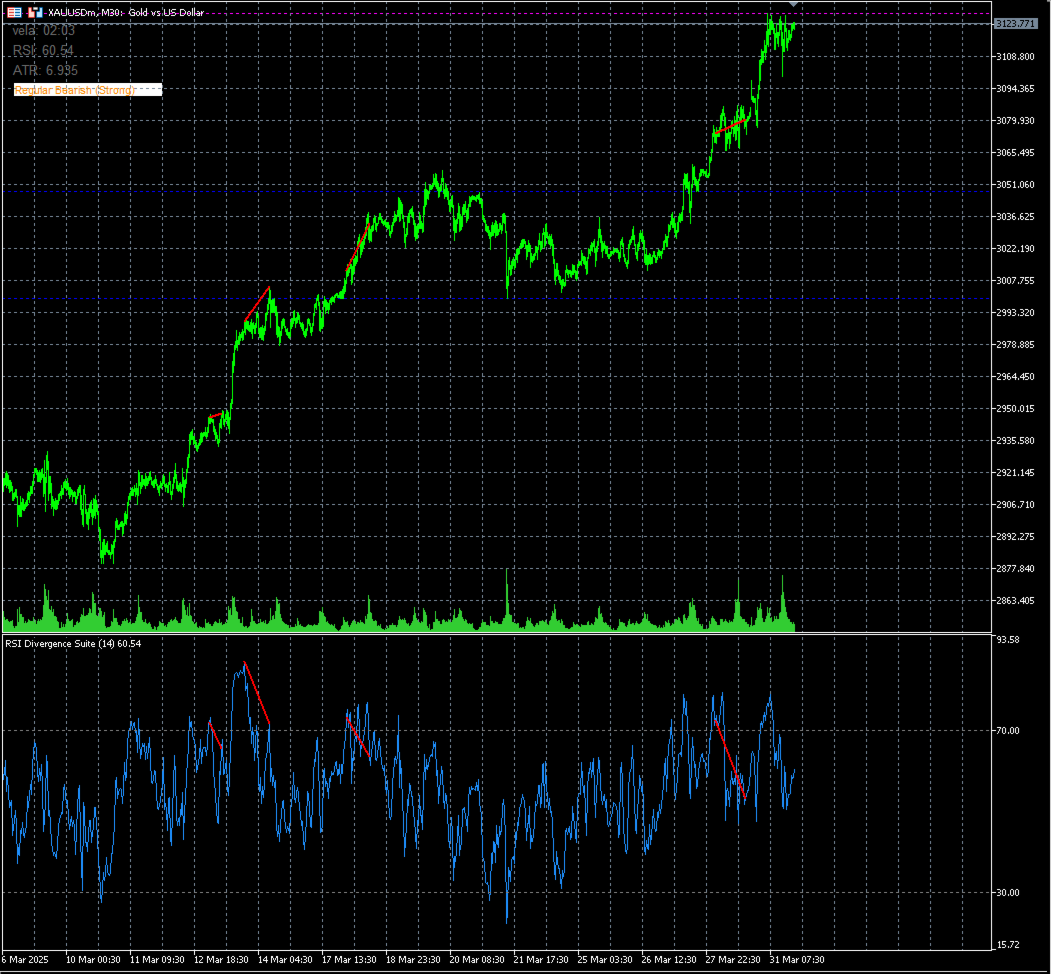
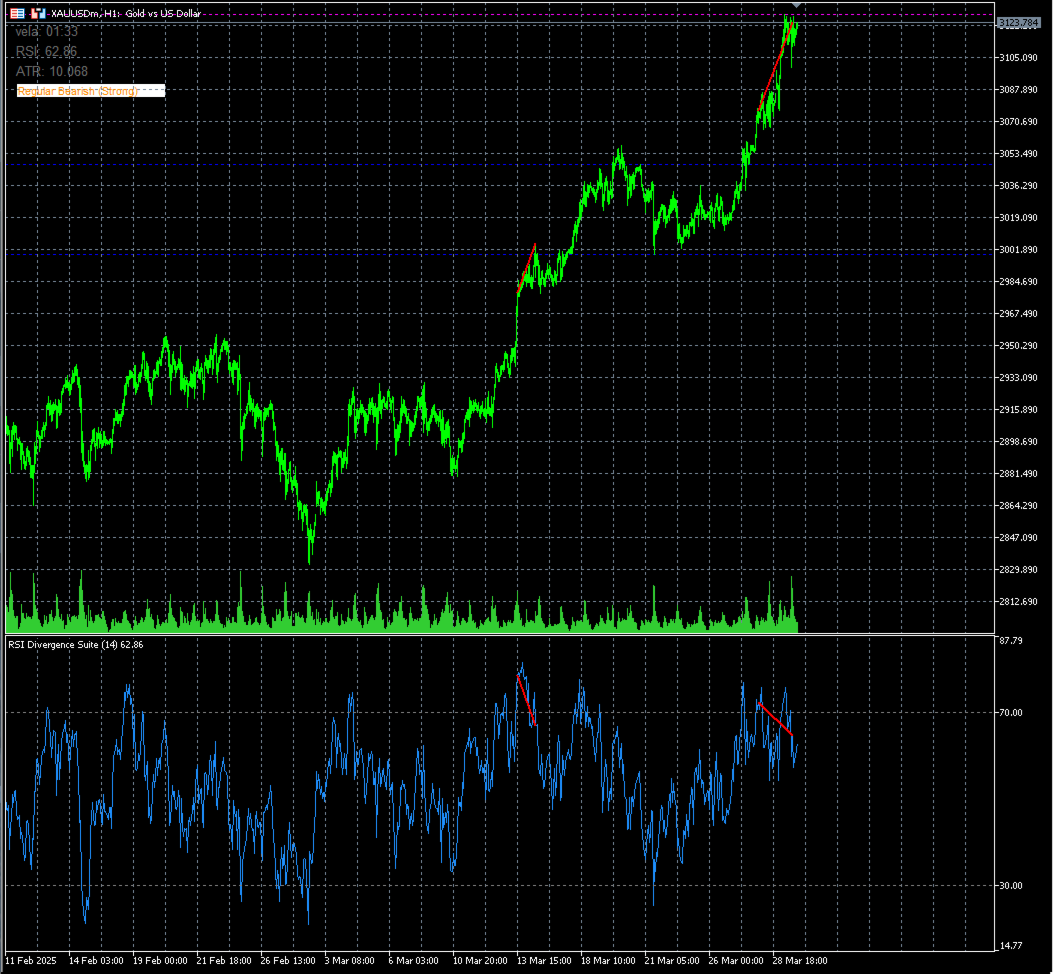
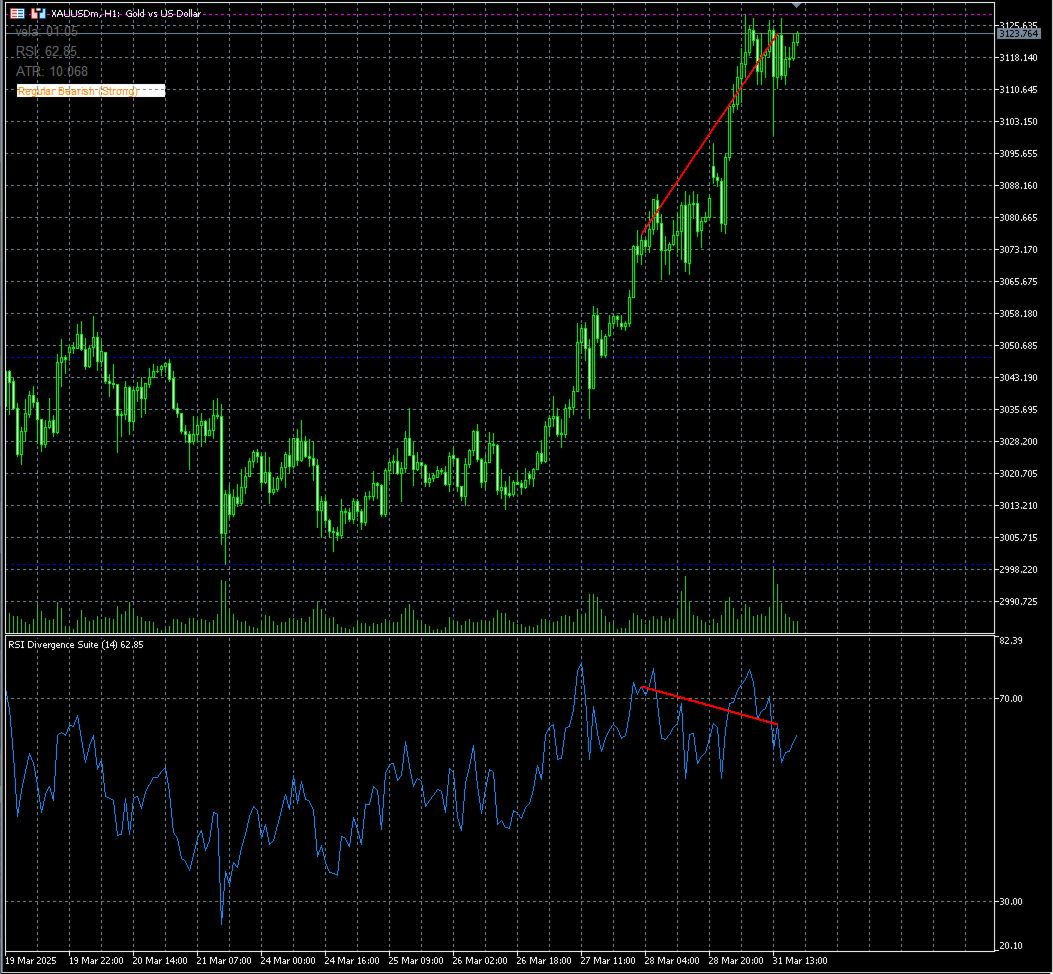
  1. Détection Avancée des Divergences
  • Quatre types de divergences :
    • Divergence Haussière Régulière : Signal haussier lorsque le prix forme des plus bas inférieurs mais que le RSI forme des plus bas supérieurs
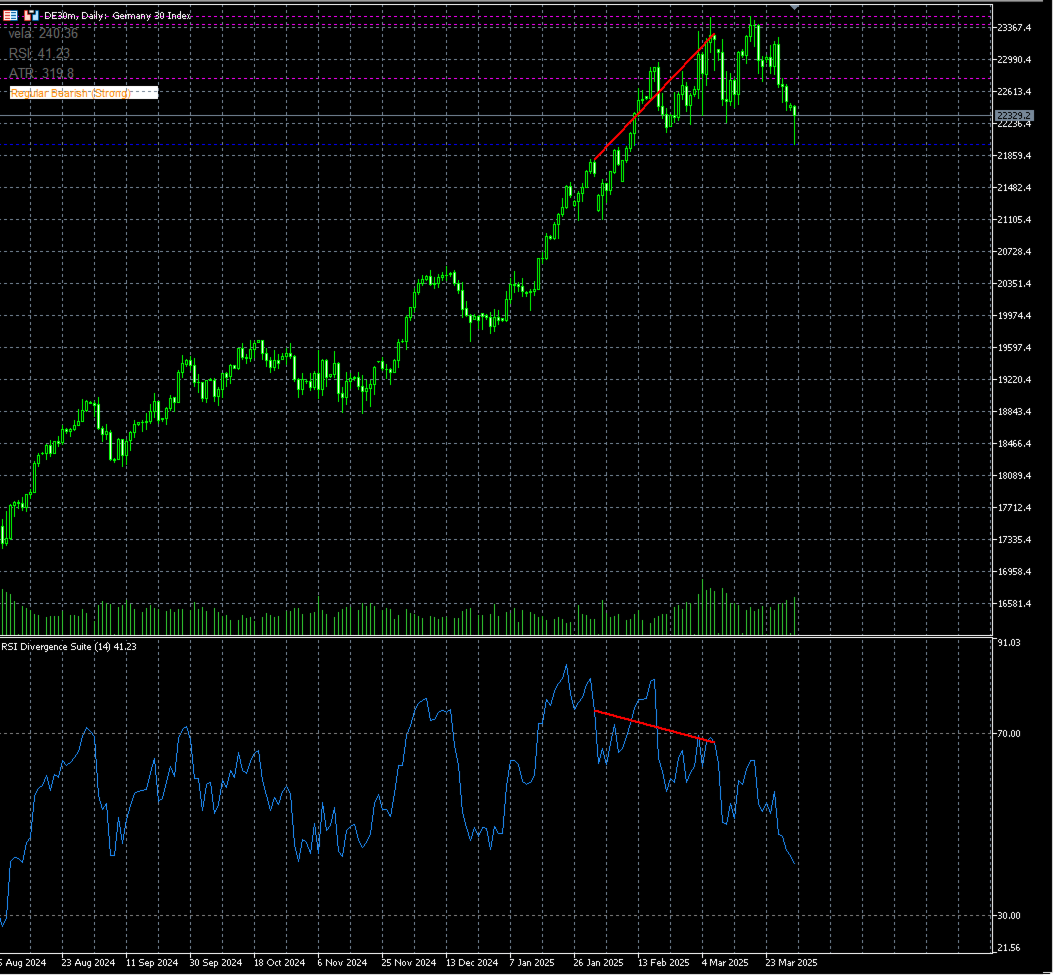
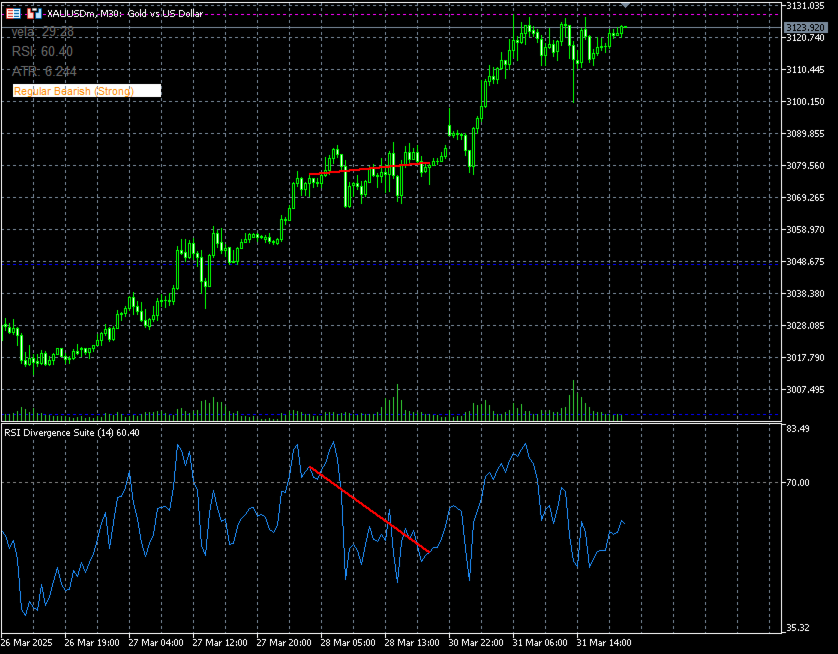
    • Divergence Baissière Régulière : Signal baissier lorsque le prix forme des plus hauts supérieurs mais que le RSI forme des plus hauts inférieurs
    • Divergence Haussière Cachée : Confirmation de tendance haussière (continuation)
    • Divergence Baissière Cachée : Confirmation de tendance baissière (continuation)
  • Filtres de qualité intégrés :
    • Filtre de volume minimum
    • Filtre de volatilité ATR
    • Filtre des niveaux de RSI (surachat/survente)
    • Filtre de distance entre les barres

2. Système de Classification de la Force

  • Catégorisation automatique des signaux :
    • Fort : Divergences avec une différence de RSI supérieure au seuil configurable
    • Normal : Divergences qui répondent aux critères minimaux
  • Visualisation différenciée :
    • Lignes pleines pour les signaux forts
    • Lignes pointillées pour les signaux normaux
    • Couleurs personnalisables pour chaque type de divergence

3. Panneau d'Informations en Temps Réel

  • Panneau personnalisable affichant :
    • Type de la dernière divergence détectée
    • Niveau de force du signal
    • Couleurs adaptées au type de divergence
    • Position et taille ajustables

4. Système Multi-Timeframe de Support/Résistance

  • Analyse simultanée de 9 timeframes :
    • De M1 à Mensuel
    • Activation sélective des timeframes selon les besoins
  • Groupement intelligent des niveaux :
    • Tolérance configurable pour éviter les doublons
    • Visualisation claire avec des couleurs et des styles personnalisables

5. Système d'Alerte Complet

  • Cinq méthodes de notification :

    • Alertes pop-up
    • Notifications par e-mail
    • Notifications push avec historique
    • Alertes sonores personnalisables
    • Panneau visuel sur le graphique
  • Historique des alertes intégré :

    • Stocke les 6 dernières alertes
    • Inclut l'horodatage, le symbole, le timeframe et le type
    • Envoi de l'historique dans les notifications push

6. Étiquettes Informatifs

  • Affichage des valeurs actuelles :
    • Valeur RSI actuelle
    • Valeur ATR actuelle
    • Minuteur de la bougie en cours

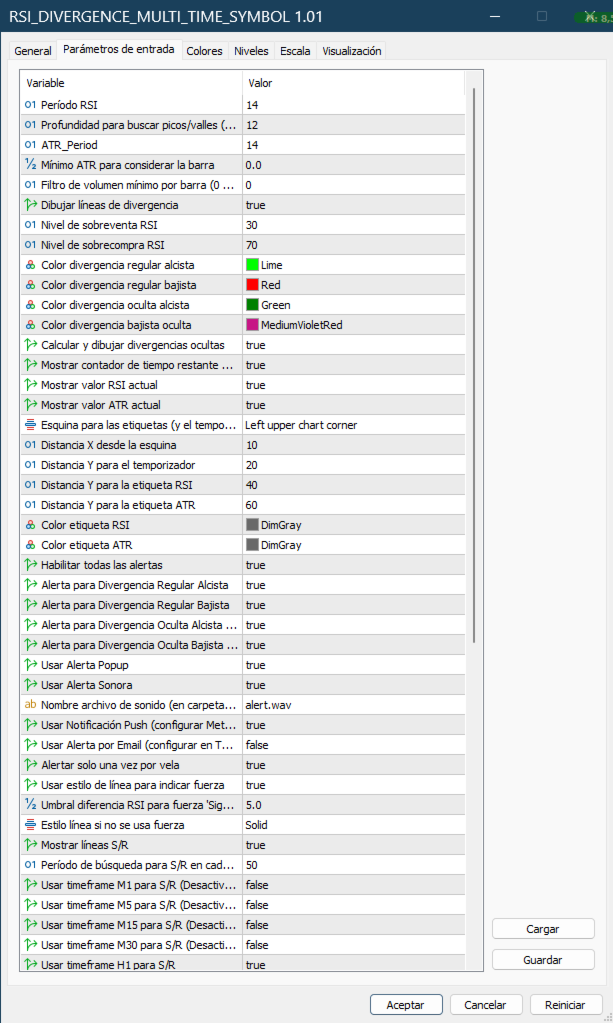
Paramètres Personnalisables

Configuration du RSI

  • RSI_Period : Période pour le calcul du RSI
  • StrengthRsiDiffThreshold : Seuil pour considérer une divergence comme forte

Filtres de Qualité

  • ZigZag_Depth : Profondeur pour détecter les pics et les creux significatifs
  • Volume_Filter : Filtre de volume minimum pour valider les signaux
  • Vol_Min : Valeur ATR minimale pour filtrer les périodes de faible volatilité
  • Filter_UseRsiLevels : Activer le filtre des niveaux de RSI
  • Filter_RsiOverbought/Filter_RsiOversold : Niveaux de surachat/survente
  • Filter_UseBarDistance : Activer le filtre de distance entre les barres
  • Filter_MinBarDistance/Filter_MaxBarDistance : Plage de distance autorisée

Personnalisation Visuelle

  • RegBullColor, RegBearColor : Couleurs pour les divergences régulières
  • HidBullColor, HidBearColor : Couleurs pour les divergences cachées
  • EnableStrengthStyle : Activer les styles de ligne basés sur la force
  • DefaultLineStyle : Style de ligne par défaut
  • PanelBackColor : Couleur de fond du panneau
  • PanelTextColorNormal/PanelTextColorStrong : Couleurs du texte du panneau
  • PanelCorner, PanelXDistance, PanelYDistance : Position du panneau
  • PanelFontSize : Taille de la police du panneau

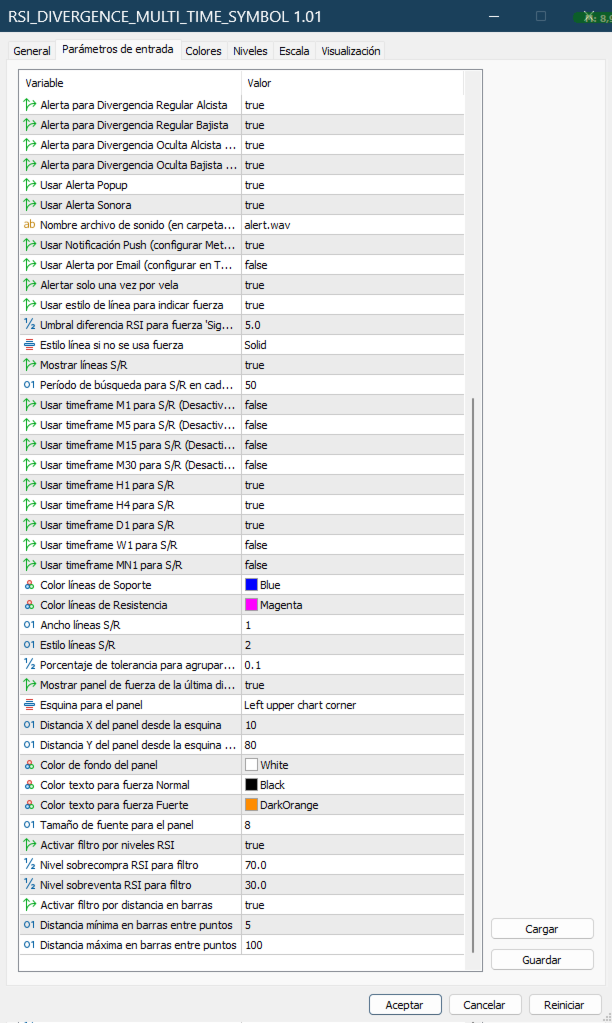
Configuration du Support/Résistance

  • ShowSRLines : Activer/désactiver les lignes S/R
  • SR_Lookback : Nombre de barres à analyser
  • SR_UseM1, SR_UseM5, ... : Sélection des timeframes pour l'analyse
  • SupportColor, ResistanceColor : Couleurs pour les lignes S/R
  • SR_LineStyle, SR_LineWidth : Style et épaisseur des lignes S/R
  • SR_Tolerance_Percent : Tolérance pour regrouper les niveaux proches

Système d'Alerte

  • EnableAlerts : Activer/désactiver le système d'alerte
  • AlertOnRegularBullish, AlertOnRegularBearish, ... : Sélection des types de divergence pour les alertes
  • UsePopupAlert, UseSoundAlert, ... : Méthodes de notification
  • AlertOncePerBar : Limiter à une alerte par barre pour chaque type
  • SoundFileName : Fichier son personnalisé

Avantages Compétitifs

  1. Précision Supérieure : Algorithme avancé avec de multiples filtres pour éliminer les faux signaux
  2. Visualisation Double : Système qui affiche les divergences à la fois sur le graphique des prix et dans la fenêtre RSI
  3. Analyse Multi-Timeframe : Intégration d'informations provenant de multiples unités de temps
  4. Personnalisation Complète : Plus de 50 paramètres ajustables pour s'adapter à tout style de trading
  5. Optimisation des Ressources : Conçu pour des performances optimales même sur des graphiques avec de nombreux instruments
  6. Gestion Intelligente de la Mémoire : Nettoyage automatique des objets graphiques et recalcul sélectif

Applications Pratiques

  • Trading de Reversal : Identification précise des points de retournement potentiels du marché
  • Trading de Continuation : Confirmation des tendances existantes avec des divergences cachées
  • Analyse Multi-Actifs : Compatible avec tous les instruments (Forex, Actions, Indices, Cryptomonnaies)
  • Scalping et Day Trading : Signaux clairs et précis sur les unités de temps courtes
  • Swing Trading : Identification d'opportunités à plus long terme sur les unités de temps plus longues

Conclusion

Le RSI Divergence Suite Pro représente une solution complète pour les traders cherchant à identifier des opportunités de trading à haute probabilité basées sur les divergences. Sa combinaison unique de détection avancée, de classification de la force, d'analyse multi-timeframe et de système d'alerte en fait un outil indispensable pour tout trader technique utilisant MetaTrader 5.


Produits recommandés
Owl Smart Levels MT5
Sergey Ermolov
4 (29)
Version MT4   |  FAQ L' indicateur Owl Smart Levels est un système de trading complet au sein d'un seul indicateur qui comprend des outils d'analyse de marché populaires tels que les fractales avancées de Bill Williams , Valable ZigZag qui construit la structure d'onde correcte du marché et les niveaux de Fibonacci qui marquent les niveaux exacts d'entrée. sur le marché et les endroits où prendre des bénéfices. Description détaillée de la stratégie Mode d'emploi de l'indicateur Conseiller-Assis
Was: $249  Now: $149   Market Profile defines a number of day types that can help the trader to determine market behaviour. A key feature is the Value Area, representing the range of price action where 70% of trading took place. Understanding the Value Area can give traders valuable insight into market direction and establish the higher odds trade. It is an excellent addition to any system you may be using. Inspired by Jim Dalton’s book “Mind Over Markets”, this indicator is designed to suit the
Cumulative delta indicator As most traders believe, the price moves under the pressure of market buying or selling. When someone redeems an offer standing in the cup, the deal is a "buy". If someone pours into the bid standing in the cup - the deal goes with the direction of "sale". The delta is the difference between purchases and sales. A cumulative delta - the difference between the cumulative sum of purchases and sales for a certain period of time. It allows you to see who is currently contr
Statistical Arbitrage Spread Generator for Cointegration [MT5] What is Pair Trading? Pair trading is a market-neutral strategy that looks to exploit the relative price movement between two correlated assets — instead of betting on the direction of the market. The idea? When two assets that usually move together diverge beyond a statistically significant threshold, one is likely mispriced. You sell the expensive one, buy the cheap one , and profit when they converge again. It’s a statistica
FREE
Volume Delta Candle
Muhammad Muzaffar Hussan
Volume Delta Candles: A Comprehensive Tool for In-Depth Trading Analysis Unlock a seamless way to interpret trading experience within each candle. With Volume Delta Candles, there's no need for additional volume indicators—everything you need is built in. This advanced tool utilizes lower timeframes or live market data to present the percentage of buying versus selling volume within each candle as an intuitive color-coded bar. Before diving in, ensure you’re familiar with Volume and Volume Delta
Wapv Price and volume
Eduardo Da Costa Custodio Santos
L'indicateur de prix et de volume WAPV pour MT5 fait partie de l'ensemble d'outils (Wyckoff Academy Wave Market) et (Wyckoff Academy Price and Volume). L'indicateur de prix et de volume WAPV pour MT5 a été créé pour faciliter la visualisation intuitive du mouvement du volume sur le graphique. Avec lui, vous pouvez observer les moments de pic de volume et les moments où le marché n'a aucun intérêt professionnel Identifiez les moments où le marché évolue par inertie et non par mouvement de "smart
Noize Absorption Index - is the manual trading system that measures the difference of pressure between bears forces and bulls forces. Green line - is a noize free index that showing curent situation. Zero value of index shows totally choppy/flat market.Values above zero level shows how powerfull bullish wave is and values below zero measures bearish forces.Up arrow appears on bearish market when it's ready to reverse, dn arrow appears on weak bullish market, as a result of reverse expectation.
To download MT4 version please click here . - This is the exact conversion from TradingView: "Trend Direction Force Index - TDFI [wm]" By "causecelebre". - The screenshot shows similar results from tradingview and Metatrader when tested on ICMarkets on both platforms. - This indicator uses multiple levels of averaging to detect trend strength. - You can optimize filter low and filter high levels to achieve best results. - You have access to buffers to use in EAs. - This is a light-load processin
Volume Profile V6
Andrey Kolesnik
4.5 (2)
The volume profile indicator of the market + a S mart oscillator . It works on almost all instruments - currency pairs , stocks , futures , cryptocurrency , on real volumes and on tick ones . You can set both the automatic definition of the profile range , for example , for a week or a month , etc . , and set the range manually by moving the boundaries ( two vertical lines red and blue ) . It is shown as a histogram . The width of the histogram at this level means , conditionally , the number of
Crash 1000 Scalping Indicator for the Crash 1000 Deriv Synthetic Index. Introduction The Crash 1000 Scalping Indicator is a specialized tool designed for the Crash 1000 index on the Deriv Synthetic market. This indicator is particularly useful for scalping on the M1 timeframe, helping traders to identify precise entry and exit points for buy positions. It is designed to be non-repainting, providing clear signals with audible alerts and push notifications, and is compatible with mobile devices th
Terra Infinity is a flat indicator. This improved version of the CalcFlat indicator has three additional lines that significantly increase its effectiveness. Unlike its predecessor with two static levels, Terra Infinity adds three dynamic lines above the main histogram, which are interpreted as follows: base signal line, minimum signal line, maximum signal line. These lines are formed using the additional parameter Avg, which is the average value of the histogram. Averaging produces a line cl
Le niveau Premium est un indicateur unique avec une précision de plus de 80 % des prédictions correctes ! Cet indicateur a été testé par les meilleurs Trading Specialists depuis plus de deux mois ! L'indicateur de l'auteur que vous ne trouverez nulle part ailleurs ! À partir des captures d'écran, vous pouvez constater par vous-même la précision de cet outil ! 1 est idéal pour le trading d'options binaires avec un délai d'expiration de 1 bougie. 2 fonctionne sur toutes les paires de devises
Unlock key market insights with automated support and resistance lines Tired of plotting support and resistance lines? This is a multi-timeframe indicator that detects and plots supports and resistance lines in the chart with the same precision as a human eye would. As price levels are tested over time and its importance increases, the lines become thicker and darker, making price leves easy to glance and evaluate. [ Installation Guide | Update Guide | Troubleshooting | FAQ | All Products ] Boos
L'indicateur SMC Venom Model BPR est un outil professionnel pour les traders travaillant dans le concept Smart Money (SMC). Il identifie automatiquement deux modèles clés sur le graphique des prix: FVG   (Fair Value Gap) est une combinaison de trois bougies, dans laquelle il y a un écart entre la première et la troisième bougie. Forme une zone entre les niveaux où il n'y a pas de support de volume, ce qui conduit souvent à une correction des prix. BPR   (Balanced Price Range) est une combinaiso
Renko Gold
Ignacio Agustin Mene Franco
Renko Gold! clearly indicates the floors and ceilings where it goes from 4 lines, the line below that marks the floor in green confirming with the thinnest line clarifies the purchase entry, the same is for sale, the top line marks the ceiling and the thinnest red line marks the sale, This indicator works for all temporalities! For Forex and Synthetic Indices markets! It also works for crypto markets! Good profit! World Investor.
L'indicateur construit les cotations actuelles, qui peuvent être comparées aux cotations historiques et, sur cette base, faire une prévision de l'évolution des prix. L'indicateur dispose d'un champ de texte pour une navigation rapide jusqu'à la date souhaitée. Option : Symbole - sélection du symbole que l'indicateur affichera ; SymbolPeriod - sélection de la période à partir de laquelle l'indicateur prendra des données ; IndicatorColor - couleur de l'indicateur ; HorisontalShift - décalage
Atomic Analyst MT5
Issam Kassas
4.32 (19)
Tout d'abord, il convient de souligner que cet indicateur de trading n'est ni repainting, ni redrawing et ne présente aucun délai, ce qui le rend idéal à la fois pour le trading manuel et automatisé. Manuel de l'utilisateur : réglages, entrées et stratégie. L'Analyste Atomique est un indicateur d'action sur les prix PA qui utilise la force et le momentum du prix pour trouver un meilleur avantage sur le marché. Équipé de filtres avancés qui aident à éliminer les bruits et les faux signaux, et à
Double HMA MTF for MT5
Pavel Zamoshnikov
4 (4)
This is an advanced multi-timeframe version of the popular Hull Moving Average (HMA) Features Two lines of the Hull indicator of different timeframes on the same chart. The HMA line of the higher timeframe defines the trend, and the HMA line of the current timeframe defines the short-term price movements. A graphical panel with HMA indicator data from all timeframes at the same time . If the HMA switched its direction on any timeframe, the panel displays a question or exclamation mark with a tex
This indicator allows you to enjoy the two most popular products for analyzing request volumes and market deals at a favorable price: Actual Depth of Market Chart Actual Tick Footprint Volume Chart This product combines the power of both indicators and is provided as a single file. The functionality of Actual COMBO Depth of Market AND Tick Volume Chart is fully identical to the original indicators. You will enjoy the power of these two products combined into the single super-indicator! Below is
Thunder Scalper
Mr Fares Mohammad Alabdali
Indicateur d'objectifs d'achat et de vente       Il se compose de trois lignes : la première couleur verte identifie les cibles d'achat, la deuxième couleur rouge identifie les cibles de vente et la troisième couleur bleue est le prix moyen.       Il y a deux façons d'entrer -       Méthode 1 : Point d'entrée lorsque le prix moyen est cassé avec une longue bougie d'en bas et rester au-dessus de la ligne bleue avec une bougie verte est considéré comme un achat       Lorsque le prix moyen franchit
No Demand No Supply MT5
Trade The Volume Waves Single Member P.C.
No Demand No Supply   This indicator identifies   No Demand –No Supply candles to your chart and plots volume bars colored according to the signal. It can be applied to all timeframes or to a specific one only. It can also be used as regular volume indicator  with exceptional future of WEIGHTED VOLUME. Furthermore is has an alert notification, sound and email when a signals occurs. The indicator does not repaint but the alert will come on two candles back due to the definition of No Demand No Su
Golden Spike Premium
Kwaku Bondzie Ghartey
Golden Spikes Detector Acknowledgement and Dedications:  The name of this indicator was Inspired by an Original; Mr Grant Koopman; a Knowledgeable and experienced Synthetics trader. I dedicate this indicator to Mr Grant.  Overview:   The Golden Spikes Premium is a groundbreaking trading indicator meticulously crafted for the Boom and Crash indices on the Deriv market. Tailored to meet the needs of discerning traders, this powerful tool operates exclusively on the one-minute timeframe, providing
BoxChart MT5
Evgeny Shevtsov
5 (7)
The market is unfair if only because 10% of participants manage 90% of funds. An ordinary trader has slim changes to stand against these "vultures". This problem can be solved. You just need to be among these 10%, learn to predict their intentions and move with them. Volume is the only preemptive factor that faultlessly works on any timeframe and symbol. First, the volume appears and is accumulated, and only then the price moves. The price moves from one volume to another. Areas of volume accumu
Cet indicateur innovant de mesure de la force des devises de INFINITY est une aide indispensable pour les scalpers et les commerçants qui négocient à long terme. Le système d'analyse De la force/faiblesse des devises est connu depuis longtemps et utilisé sur le marché par les principaux traders du monde. Tout commerce d'arbitrage n'est pas complet sans cette analyse. Notre indicateur détermine facilement la force des devises sous-jacentes les unes par rapport aux autres. Il affiche des graphiqu
PZ Trend Trading MT5
PZ TRADING SLU
3.8 (5)
Capture every opportunity: your go-to indicator for profitable trend trading Trend Trading is an indicator designed to profit as much as possible from trends taking place in the market, by timing pullbacks and breakouts. It finds trading opportunities by analyzing what the price is doing during established trends. [ Installation Guide | Update Guide | Troubleshooting | FAQ | All Products ] Trade financial markets with confidence and efficiency Profit from established trends without getting whip
Ultimate Divergence Scanner (Multi Pair And Multi Time Frame) :   ---LIMITED TIME OFFER: NEXT 25 CLIENTS ONLY ---46% OFF REGULAR PRICE AND 2 FREE BONUSES ---SEE BELOW FOR FULL DETAILS It is a widely known market principle that momentum generally precedes price.  Making divergence patterns a clear indication that price and momentum are not in agreement.  Divergence patterns are widely used by institutional traders around the world. As they allow you to manage  your trades within strictly defin
The Penta-O is a 6-point retracement harmonacci pattern which usually precedes big market movements. Penta-O patterns can expand and repaint quite a bit. To make things easier this indicator implements a twist: it waits for a donchian breakout in the right direction before signaling the trade. The end result is an otherwise repainting indicator with a very reliable trading signal. The donchian breakout period is entered as an input. [ Installation Guide | Update Guide | Troubleshooting | FAQ | A
HMA Trend Professional MT5
Pavel Zamoshnikov
4.25 (4)
Improved version of the free HMA Trend indicator (for MetaTrader 4) with statistical analysis. HMA Trend is a trend indicator based on the Hull Moving Average (HMA) with two periods. HMA with a slow period identifies the trend, while HMA with a fast period determines the short-term movements and signals in the trend direction. The main differences from the free version: Ability to predict the probability of a trend reversal using analysis of history data. Plotting statistical charts for analyzi
To get access to MT4 version please click here . - This is the exact conversion from TradingView: "Stochastic Momentum Index" By "UCSgears". - This is a popular version of stochastic oscillator on tradingview. - This is a light-load processing and non-repaint indicator. - Buffers are available for the lines on chart. - You can message in private chat for further changes you need. Thanks for downloading
This indicator obeys the popular maxim that: "THE TREND IS YOUR FRIEND" It paints a Blue line for BUY and also paints a RED line for SELL. (you can change the colors). It gives alarms and alerts of all kinds. can be used for all currency pairs and timeframes. Yes, as easy and simple as that. Even a newbie can use it to make great and reliable trades. MetaTrader 4 Version    
Les acheteurs de ce produit ont également acheté
RelicusRoad Pro MT5
Relicus LLC
4.78 (18)
Maintenant 147 $ (augmentant à 499 $ après quelques mises à jour) - Comptes illimités (PCS ou Mac) Manuel d'utilisation RelicusRoad + Vidéos de formation + Accès au groupe Discord privé + Statut VIP UNE NOUVELLE FAÇON DE REGARDER LE MARCHÉ RelicusRoad est l'indicateur de trading le plus puissant au monde pour le forex, les contrats à terme, les crypto-monnaies, les actions et les indices, offrant aux traders toutes les informations et tous les outils dont ils ont besoin pour rester rentables
MetaForecast M5
Vahidreza Heidar Gholami
5 (3)
MetaForecast prédit et visualise l'avenir de n'importe quel marché en se basant sur les harmoniques des données de prix. Bien que le marché ne soit pas toujours prévisible, s'il y a un motif dans les prix, MetaForecast peut prédire l'avenir aussi précisément que possible. Comparé à d'autres produits similaires, MetaForecast peut générer des résultats plus précis en analysant les tendances du marché. Paramètres d'entrée Past size (Taille passée) Spécifie le nombre de barres que MetaForecast util
FxaccurateLS
Shiv Raj Kumawat
WHY IS OUR FXACCCURATE LS MT5 THE PROFITABLE ? PROTECT YOUR CAPITAL WITH RISK MANAGEMENT Gives entry, stop and target levels from time to time. It finds Trading opportunities by analyzing what the price is doing during established trends. POWERFUL INDICATOR FOR A RELIABLE STRATEGIES We have made these indicators with a lot of years of hard work. It is made at a very advanced level. Established trends provide dozens of trading opportunities, but most trend indicators completely ignore them! The
NOTE: CYCLEMAESTRO is distributed only on this website, there are no other distributors. Demo version is for reference only and is not supported. Full versione is perfectly functional and it is supported. CYCLEMAESTRO , the first and only indicator of Cyclic Analysis, useful for giving signals of TRADING, BUY, SELL, STOP LOSS, ADDING. Created on the logic of   Serghei Istrati   and programmed by   Stefano Frisetti ;   CYCLEMAESTRO   is not an indicator like the others, the challenge was to inter
Vous recherchez un puissant indicateur de trading forex qui peut vous aider à identifier facilement des opportunités de trading rentables ? Ne cherchez pas plus loin que le Beast Super Signal. Cet indicateur basé sur les tendances facile à utiliser surveille en permanence les conditions du marché, en recherchant de nouvelles tendances en développement ou en sautant sur celles existantes. Le Beast Super Signal donne un signal d'achat ou de vente lorsque toutes les stratégies internes s'alignent
[ MT4 Version ]  [ Kill Zones ]  [ SMT Divergences ] How to trade using Order Blocks:  Click here User Interface Performance:  During testing in the strategy tester, the UI may experience lag. Rest assured, this issue is specific to the testing environment and does not affect the indicator's performance in live trading. Elevate your trading strategy with the  Order Blocks ICT Multi TF  indicator, a cutting-edge tool designed to enhance your trading decisions through advanced order block analysis
The Naveen Dynamic Square  MT5  is one of the best known  technical analysis tools  inspired  by WD Gann along with the Gann Fan and Gann Box. It is considered a cornerstone of his trading technique that is based on time and price symmetry. The Naveen Dynamic Square MT5   is a powerful tool in finance for determining support and resistance levels based on a stock's extreme price points. It works by extrapolating probable price levels from a central value, typically an all-time or cyclical high o
Trade smarter, not harder: Empower your trading with Harmonacci Patterns This is arguably the most complete harmonic price formation auto-recognition indicator you can find for the MetaTrader Platform. It detects 19 different patterns, takes fibonacci projections as seriously as you do, displays the Potential Reversal Zone (PRZ) and finds suitable stop-loss and take-profit levels. [ Installation Guide | Update Guide | Troubleshooting | FAQ | All Products ] It detects 19 different harmonic pri
CBT Quantum Maverick Système de Trading Binaire Haute Efficacité CBT Quantum Maverick est un système de trading binaire hautement performant, conçu pour les traders recherchant précision, simplicité et discipline. Aucune personnalisation n'est nécessaire : ce système est optimisé pour des résultats efficaces dès son installation. Avec un peu de pratique, il est facile de maîtriser les signaux. Caractéristiques principales : Précision des signaux : Signaux basés sur la bougie actuelle, ciblant
L'oscillateur de l'indice de précision (Pi-Osc) de Roger Medcalf de Precision Trading Systems La version 2 a été soigneusement recodée pour être ultra-rapide à charger sur votre graphique, et quelques autres améliorations techniques ont été incorporées pour améliorer l'expérience. Le Pi-Osc a été créé pour fournir des signaux de synchronisation de trading précis conçus pour trouver des points d'épuisement extrêmes, les points auxquels les marchés sont contraints d'aller simplement pour élimin
Indicateur unique qui met en œuvre une approche professionnelle et quantitative pour signifier le trading de réversion. Il capitalise sur le fait que le prix dévie et revient à la moyenne de manière prévisible et mesurable, ce qui permet des règles d'entrée et de sortie claires qui surpassent largement les stratégies de trading non quantitatives. [ Installation Guide | Update Guide | Troubleshooting | FAQ | All Products ] Des signaux de trading clairs Étonnamment facile à échanger Couleurs et t
The   Time_Price_SQ9_Degree   indicator is based on the 9 Gann square. Using this indicator, you can identify strong time and price zones. The indicator displays the levels as a degree value. The degrees can be set in the settings. After launching, the MENU button appears. If it is highlighted, it can be moved to any point on the graph, and after double-clicking on it, it stops being highlighted and menu buttons appear. To hide the menu, just double-click on the button, it will become highlight
DESCRIPTION ICSM (Impulse-Correction SCOB Mapper) est l'indicateur qui analyse le mouvement des prix et identifie les impulsions valides, les corrections et les SCOB (Single Candle Order Block). C'est un outil puissant qui peut être utilisé avec tout type d'analyse technique car il est flexible, informatif, facile à utiliser et améliore considérablement la conscience du trader des zones d'intérêt les plus liquides. PARAMÈTRES Général | Visuels Thème de couleur — définit le thème de couleur
[ MT4 Version ]  [ Order Blocks ]  [ Kill Zones ]  [ SMT Divergences ] How to trade using Order Blocks :  Click here User Interface Performance:  During testing in the strategy tester, the UI may experience lag. Rest assured, this issue is specific to the testing environment and does not affect the indicator's performance in live trading. Elevate your trading strategy with the  Order Blocks ICT Multi TF  indicator, a cutting-edge tool designed to enhance your trading decisions through advanced o
Visual Heatmap Book Analyzer
Alexandre Moraes De Souza Lima
Visual Heatmap Book Analyser This indicator monitors the market liquidity and generates colors based on order patterns, quantities, and renewal activities in the book. This allows you to visualize the order flow and identify areas of high and low liquidity and activity. The indicator uses machine learning techniques to analyze the order behavior in the book, enabling it to detect patterns and trends in orders, allowing you to make informed decisions about your trading operations. The color pale
MT4 Version SMT Divergences MT5 SMT Divergences is one of the most innovative indicators in the market. It offers the possibility of analyzing price divergences between 2 pairs. These divergences highlight and help to foresee what banks and institutions are planning to do. SMT divergences also provides you with a kill zones indicator and the possibility of filtering divergences occurring during these kill zones.  This indicator is specially powerful if applied in 2 highly correlated pairs. A pri
Pro Thunder V10 : L’indicateur ultime pour le trading d’options binaires ! Élevez votre trading à un niveau supérieur avec Pro Thunder V10 , l'apogée du trading d'options binaires ! Propulsé par la technologie avancée de réseaux neuronaux IA , cet indicateur révolutionnaire est conçu pour offrir une précision et une fiabilité inégalées. Des signaux en temps réel qui ne se repeignent pas jusqu’à des performances impeccables, même sur des marchés volatils, Pro Thunder V10 est votre allié
Reversal ALGO
Muhammad Abdullah Bhatti
Reversal Algo – Indicateur Technique pour l’Analyse des Renversements de Marché Reversal Algo est un indicateur technique sophistiqué conçu pour aider les traders à identifier les points de retournement potentiels des tendances du marché. En analysant minutieusement les données historiques des prix, il détecte les sommets et creux significatifs qui peuvent signaler un changement imminent de momentum. Cet indicateur fournit des signaux visuels clairs sur vos graphiques, facilitant l’identificatio
Offer 249 down from 350 for the next 1 copies. then back to 350 $ Are you tired of using outdated indicators that leave you guessing where to set your profit targets? Look no further than the AK CAP Opening Range Breakout Indicator. This powerful tool is backed by a US patent and has already helped countless traders pass funded challenges like FTMO. We use it daily on our prop traders and internal funds, and now it's available to you as well. The calculation behind the indicator is incredibly a
IQ FX Gann Levels a precision trading indicator based on W.D. Gann’s square root methods. It plots real-time, non-repainting support and resistance levels to help traders confidently spot intraday and scalping opportunities with high accuracy. William Delbert Gann (W.D. Gann) was an exceptional market analyst, whose trading technique was based on a complex blend of mathematics, geometry, astrology, and ancient mathematics which proved to be extremely accurate. Download the Metatrader 4 Version M
Introduction Excessive Momentum Indicator is the momentum indicator to measure the excessive momentum directly from raw price series. Hence, this is an extended price action and pattern trading. Excessive Momentum Indicator was originally developed by Young Ho Seo. This indicator demonstrates the concept of Equilibrium Fractal Wave and Practical Application at the same time. Excessive Momentum detects the market anomaly. Excessive momentum will give us a lot of clue about potential reversal and
Super Zone indicator
Dmitriy Sotnikov
5 (1)
Super Zone   For several years of observing the principles of the market, Super Zone worked, both then and now, because the indicator  allows you to see the trading range of the  week and even the month that major market participants use. It’s very easy to use, we work on H4 in the weekly range (  in the tester it doesn’t work in the demo mode  ) - we sell from the upper zones, we buy from the lower ones. It marks the zones from the beginning of the week (month) that are  not redrawn  , works on
Introduction! to the Indicator that Connects Trend , Pattern , and Candlestick Trigger  3 Steps in Under 30 Seconds ️ Trade effortlessly — no analysis required, Your smart assistant is ready to simplify your workflow No more chart overload Trade with confidence using smart bias detection Compatible with all currencies, crypto, stocks, metals, indices, and any timeframe Just click and execute — it’s that simple Ideal for busy traders who want speed and clarity. TPTSyncX is a powerfu
TrendMaestro5
Stefano Frisetti
note: this indicator is for METATRADER4, if you want the version for METATRADER5 this is the link:  https://www.mql5.com/it/market/product/108106 TRENDMAESTRO ver 2.4 TRENDMAESTRO recognizes a new TREND in the bud, he never makes mistakes. The certainty of identifying a new TREND is priceless. DESCRIPTION TRENDMAESTRO identifies a new TREND in the bud, this indicator examines the volatility, volumes and momentum to identify the moment in which there is an explosion of one or more of these data a
This indicator is based on the mathematics of the great trader W.D. Ganna. With its help, you can easily find strong levels by analyzing swings to find the optimal entry point. The indicator works on all instruments and all timeframes. The indicator is fully manual and has control buttons. All you need to do is press the NEW button, a segment will appear, which you can place on any movement, swing or even 1 candle that you want to analyze. By placing the segment, press the OK button. A grid (th
PZ Swing Trading MT5
PZ TRADING SLU
5 (5)
Protect against whipsaws: revolutionize your swing trading approach Swing Trading is the first indicator designed to detect swings in the direction of the trend and possible reversal swings. It uses the baseline swing trading approach, widely described in trading literature. The indicator studies several price and time vectors to track the aggregate trend direction and detects situations in which the market is oversold or overbought and ready to correct. [ Installation Guide | Update Guide | Tro
This indicator identifies and displays zones, as it were areas of strength, where the price will unfold. The indicator can work on any chart, any instrument, at any timeframe. The indicator has two modes. The indicator is equipped with a control panel with buttons for convenience and split into two modes. Manual mode: To work with manual mode, you need to press the NEW button, a segment will appear. This segment is stretched over the movement and the LVL button is pressed. The level is displayed
Introduction to X3 Chart Pattern Scanner X3 Cherart Pattern Scanner is the non-repainting and non-lagging indicator detecting X3 chart patterns including Harmonic pattern, Elliott Wave pattern, X3 patterns, and Japanese Candlestick patterns. Historical patterns match with signal patterns. Hence, you can readily develop the solid trading strategy in your chart. More importantly, this superb pattern scanner can detect the optimal pattern of its kind. In addition, you can switch on and off individu
Elliot Waves Analyzer Pro
Viktor Weidenthal
2.67 (3)
Elliot Waves Analyzer Pro calculates Elliot Waves to Help Identify Trend direction and Entry Levels. Mainly for Swing Trading Strategies. Usually one would open a Position in trend direction for Wave 3 or a Correction for Wave C . This Indicator draws Target Levels for the current and next wave. Most important Rules for Elliot Wave Analysis are verified by the Indicator.  The Pro version analyzes Multiple Timeframes and shows the Subwaves and Target-Levels.   For an Overview  " Elliot Waves Anal
TMA Channel is a price channel obtained through a special calculation method based on traditional TMA . The channel has upper, middle, and lower tracks . When the price approaches or exceeds the upper track, it is already in an overbought state, and attention should be paid to the situation of reversal and decline; When the price approaches or falls below the lower track, it is already in an oversold state, and attention should be paid to the situation of reversal and rise . The indicator will
Plus de l'auteur
Stochastic Divergence Pro 1h 4h 1D+ Maîtriser les divergences pour un trading de haute précision Le Stochastic Divergence Pro MT5 est un outil d'analyse avancé conçu pour les traders qui exigent une précision et une clarté dans leur analyse du marché. Cet indicateur expert identifie en temps réel les divergences entre le prix et l'Oscillateur Stochastique, fournissant des signaux cruciaux pour anticiper les changements de tendance sur des périodes intermédiaires et élevées (H1, H4 et supérieures
FREE
Indicateur stochastique avancé avec détection de divergence - Scalping Découvrez notre indicateur stochastique de pointe, soigneusement conçu pour la plateforme MetaTrader 5. Cet outil intègre une fonction sophistiquée de détection des divergences, permettant aux traders d'anticiper les mouvements du marché et d'optimiser leurs stratégies de trading pour maximiser leur rentabilité. Avantages concurrentiels de notre indicateur stochastique : Cet indicateur représente une solution analytique e
Divergence MTF Volume Pro: Your Ultimate Edge in the Market Have you ever felt that the market takes you by surprise? Would you like a tool that anticipates possible turns and provides clearer signals for entering or exiting trades? Introducing Divergence MTF Volume Pro! Imagine seeing when price and volume (the force behind movements) start to contradict each other. This, known as divergence, is one of the most powerful signals indicating a potential trend reversal or strong continuation. Our
Filtrer:
Aucun avis
Répondre à l'avis