Advanced Wave Statistics Scanner
- Utilitaires
- Rong Bin Su
- Version: 1.0
- Activations: 5
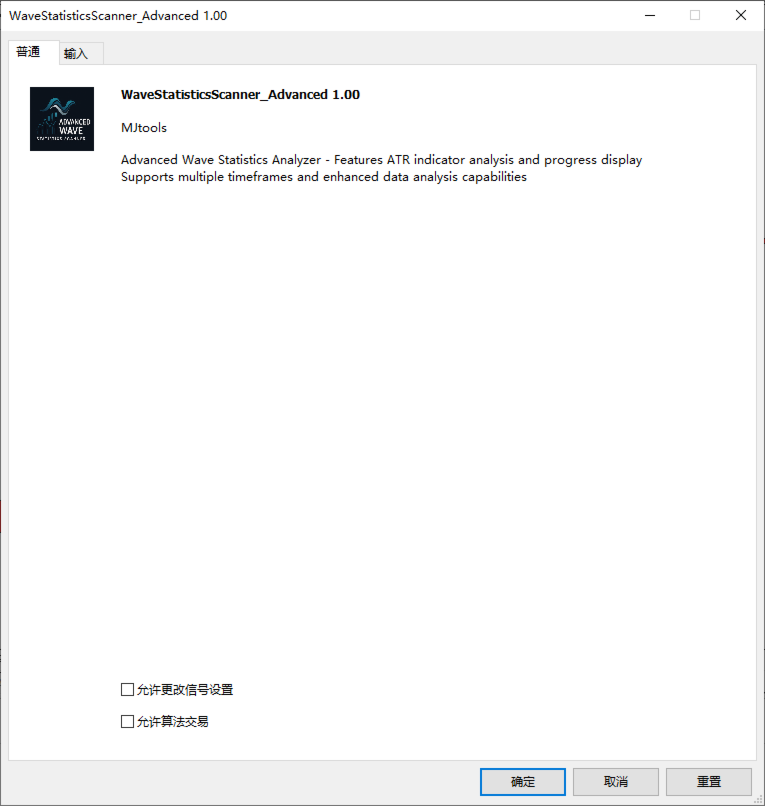
Advanced Wave Statistics Scanner
The Advanced Wave Statistics Scanner is an enhanced MQL5 tool for MetaTrader 5 that combines traditional price volatility analysis with ATR(Average True Range)indicator analysis.This sophisticated tool provides deeper insights into market volatility patterns by comparing standard price wave measurements with ATR-based volatility metrics,enabling traders to identify abnormal market conditions and potential trading opportunities with greater precision.
#Key Features
-Multi-symbol Scanning:Analyze volatility across multiple trading instruments
-Dual Volatility Analysis:Combines high-low range analysis with ATR indicator
-Automatic ATR Thresholds:Self-adjusting volatility thresholds based on market conditions
-Advanced Wave Categorization:Classifies waves by size and ATR relationships
-Visual Progress Display:Real-time progress indicators during analysis
-Enhanced Time Filtering:Precise control over analysis periods and days
-Comprehensive Visualization:Color-coded identification of different volatility types
-Detailed Data Export:Extended CSV output with ATR correlation data
-Anomaly Detection:Identifies unusual volatility events compared to historical norms
#Technical Approach
The tool extends the base wave scanner functionality by incorporating the ATR indicator,which provides a more nuanced view of volatility by considering gaps and previous bar relationships.It calculates automatic thresholds based on historical ATR values,allowing for more context-aware volatility analysis that adapts to different market conditions.
Installation
1.Download the WaveStatisticsScanner_Advanced.ex5 file
2.Open MetaTrader 5 platform
3.Navigate to File→Open Data Folder
4.Place the file in the MQL5/Scripts folder
5.Restart MetaTrader 5 or refresh the Navigator panel
6.The script will appear in the Navigator under"Scripts"
Running the Analysis
1.Open a chart for any symbol you wish to analyze
2.Double-click on the WaveStatisticsScanner_Advanced script in the Navigator panel
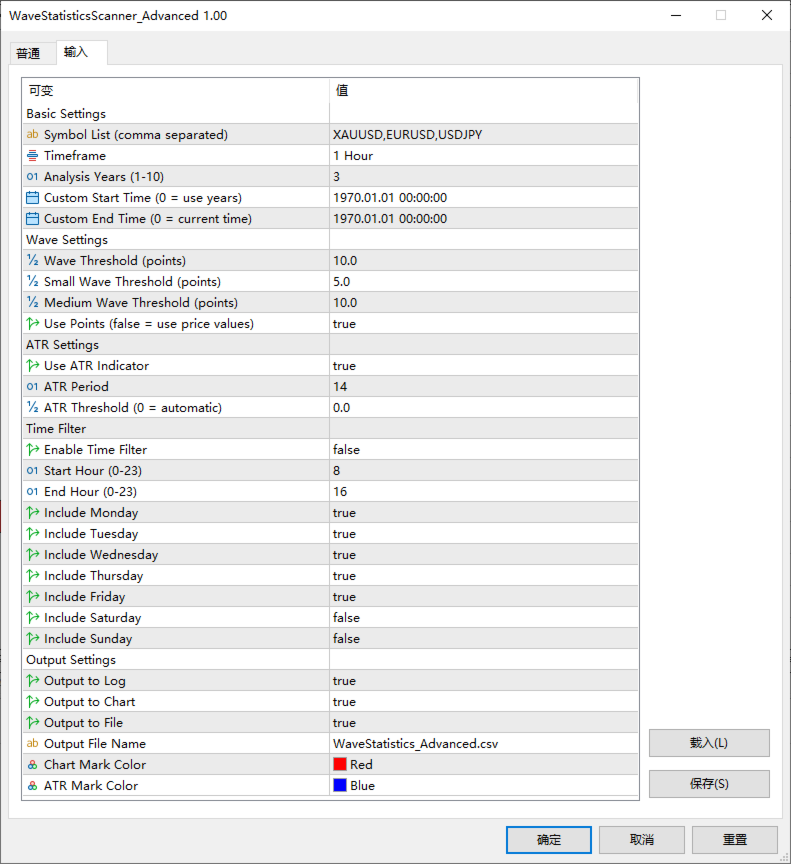
3.Configure the input parameters in the dialog that appears:
-Basic Settings:Define symbols to analyze,timeframe,and time range
-Wave Settings:Set wave thresholds and measurement method
-ATR Settings:Configure ATR period and threshold values(or use automatic)
-Time Filter:Configure specific time periods for analysis(optional)
-Output Settings:Select desired output methods and visualization options
4.Click"OK"to start the analysis
5.A progress bar will appear showing the analysis status
Interpreting Results
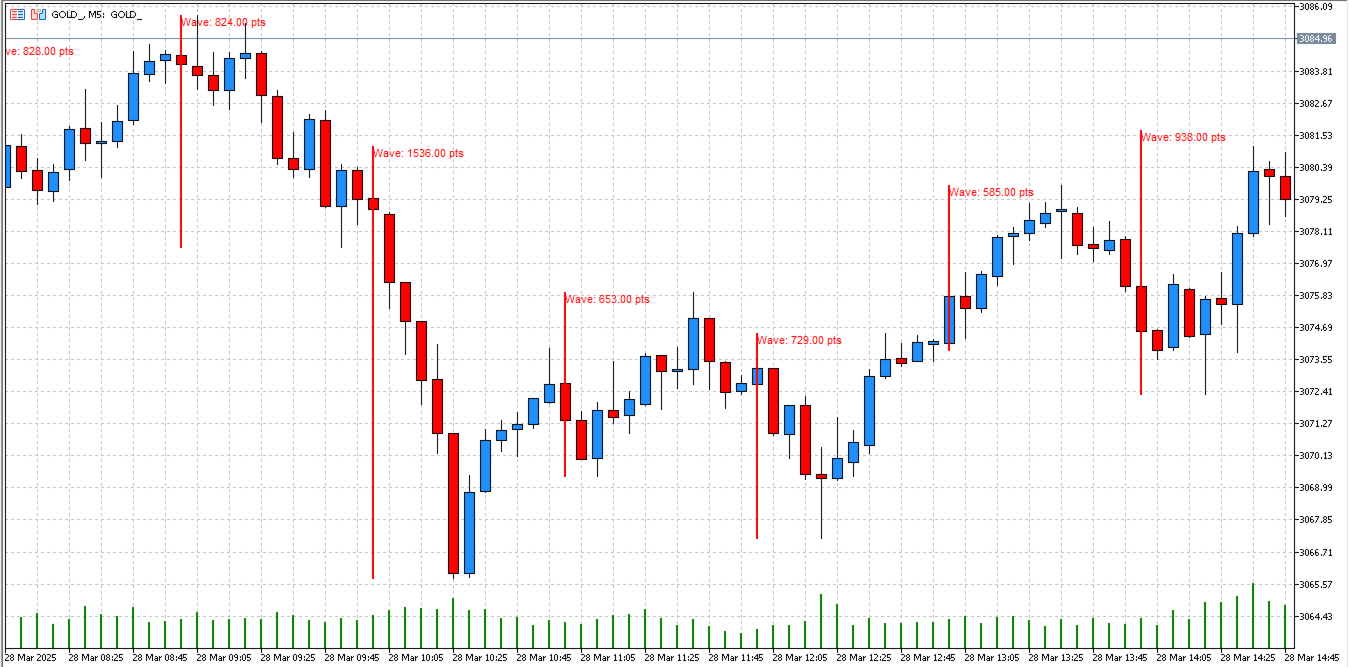
-Chart Visualization:
-Red vertical lines show significant price waves
-Blue vertical lines indicate ATR anomalies
-Labels display the wave size or ATR value
-Dual-colored areas indicate where both high volatility and ATR anomalies occur
-Experts Log:
-Check the"Experts"tab for detailed statistics
-ATR statistics section shows threshold values and frequency
-Summary compares wave-based and ATR-based volatility patterns
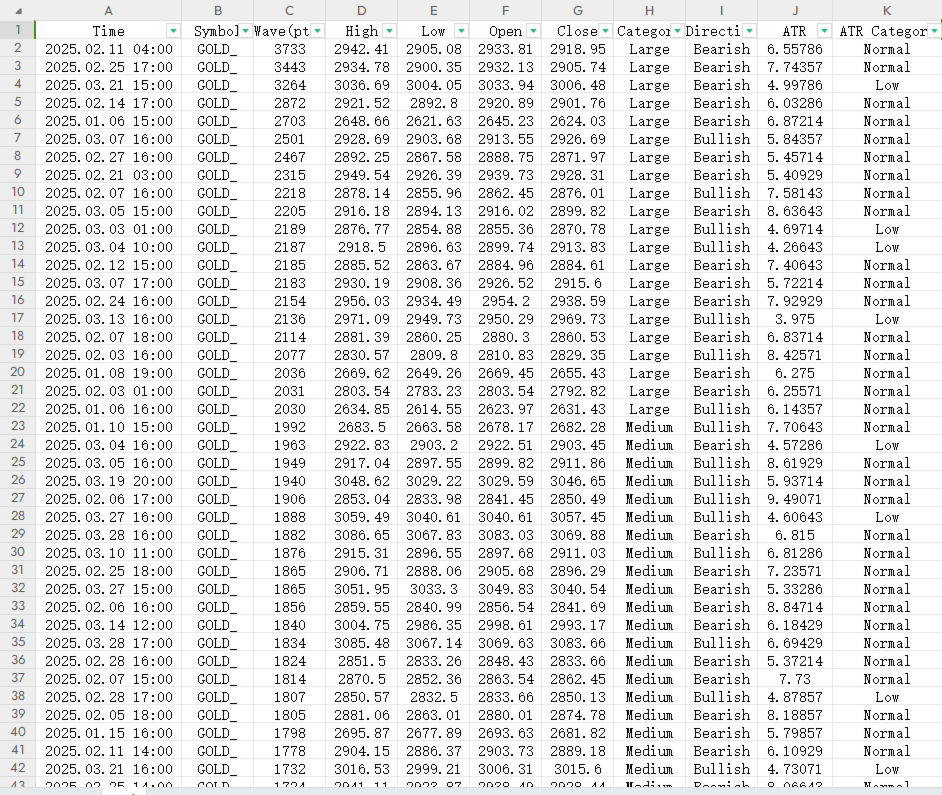
-CSV Export:
-Find the CSV file in the MQL5/Files directory
-Extended data includes ATR values and ATR categories
-Allows for correlation analysis between price waves and ATR
Advanced Usage
-Use automatic ATR thresholds for adaptive volatility analysis across different markets
-Compare ATR anomaly frequency with standard wave frequency to identify divergences
-Apply time filters to analyze how ATR-based volatility differs across trading sessions
-Use the extended categorization system to build more sophisticated trading strategies
-Monitor the relationship between ATR and price waves to anticipate volatility shifts