High Low Resistance Liquidity Run ICT MT4
- Indicateurs
- Eda Kaya
- Version: 1.11
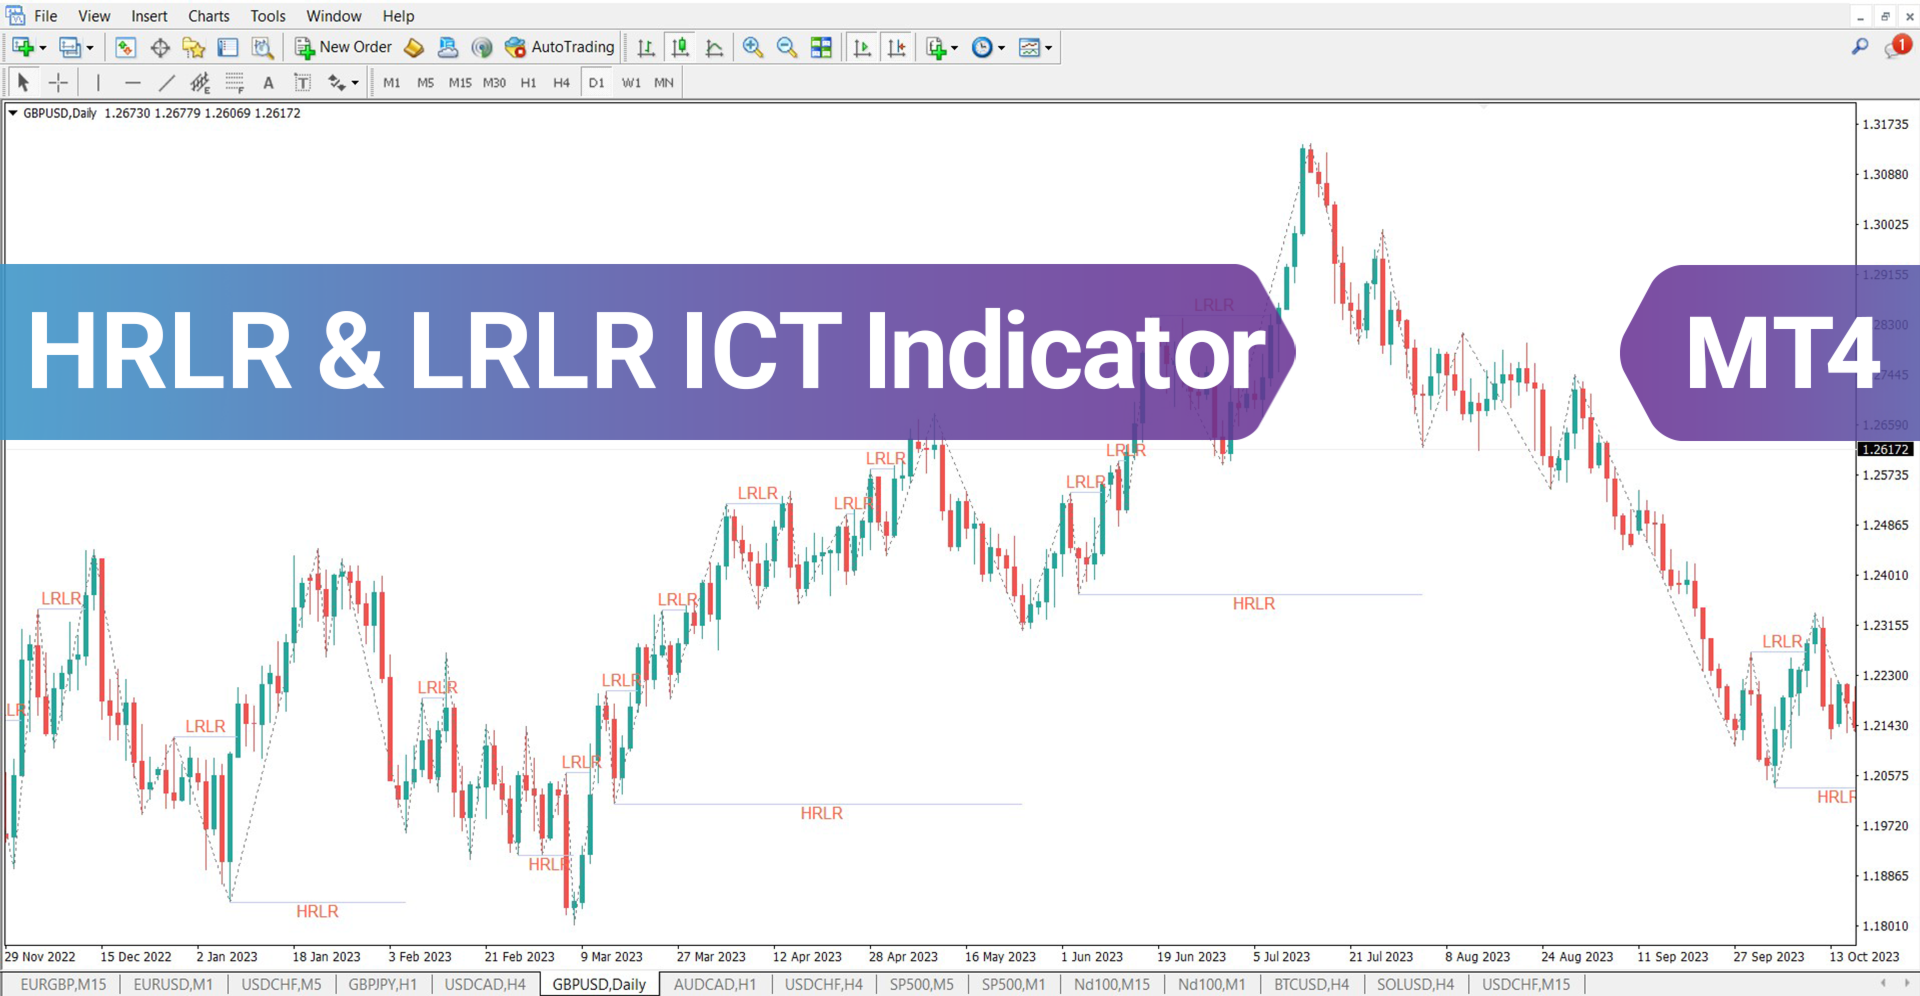
HRLR & LRLR ICT Indicator for MT4
The High Resistance Liquidity Run (HRLR) and Low Resistance Liquidity Run (LRLR) indicators are valuable tools for tracking price activity in liquidity zones, built on the ICT trading methodology.
The HRLR indicator detects liquidity accumulation after the price establishes its lowest low. This phase initiates a sequence of higher lows and higher highs, indicating the start of an upward trend.
Conversely, the LRLR indicator identifies price movements advancing toward liquidity areas with minimal resistance. It marks higher lows forming within the trend structure, leading to fresh highs that confirm LRLR patterns in price action.
HRLR & LRLR Indicator Specifications
The table below presents the key features of this indicator:
| Category | ICT - Support & Resistance - Market Structure |
| Platform | MetaTrader 4 |
| Skill Level | Advanced |
| Indicator Type | Breakout - Reversal - Trend Continuation |
| Timeframe | Multi-timeframe |
| Trading Style | Day Trading |
| Markets | Forex - Crypto - Stocks |
Overview of the Indicator
The HRLR indicator maintains a bullish trend as long as the price consistently forms higher highs and higher lows. If a short-term low is violated, the indicator adjusts to a new low and determines if the trend is still valid.
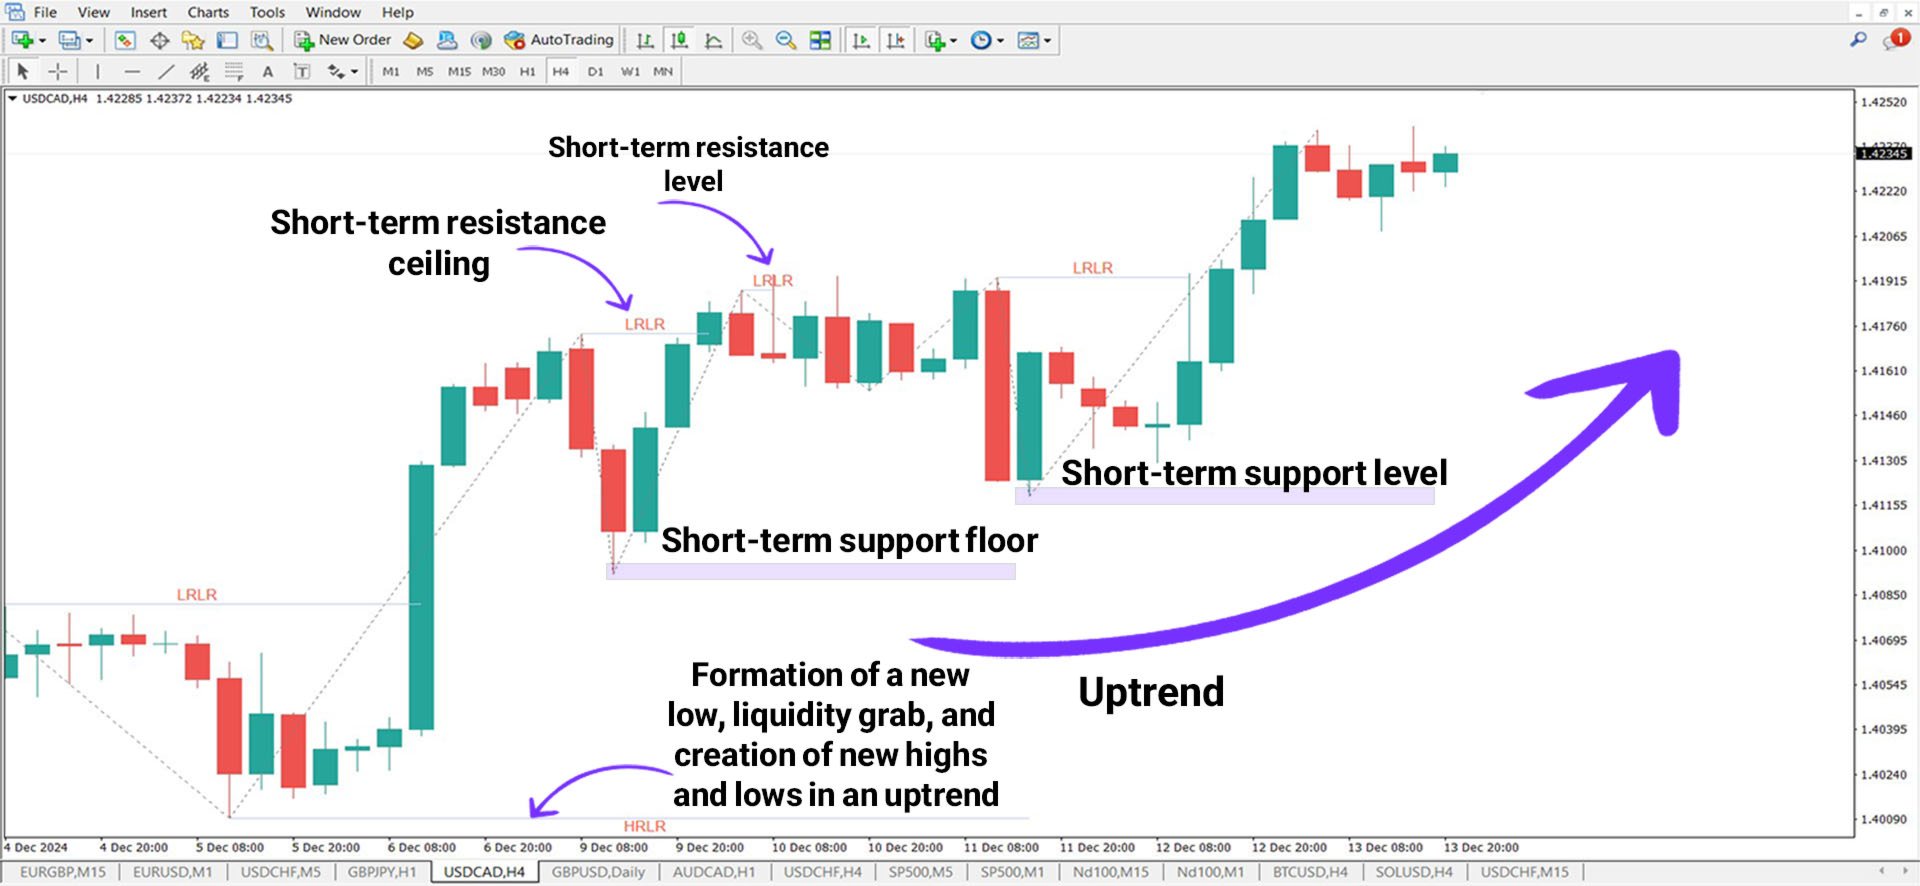
Utilizing the Indicator in an Uptrend
On a 4-hour USD/CAD price chart, HRLR patterns emerge as the price shifts upward, creating fresh lows and highs. This setup provides traders with potential buy opportunities in key zones when additional bullish confirmations, such as strong candles or pin bars, align with the trend.
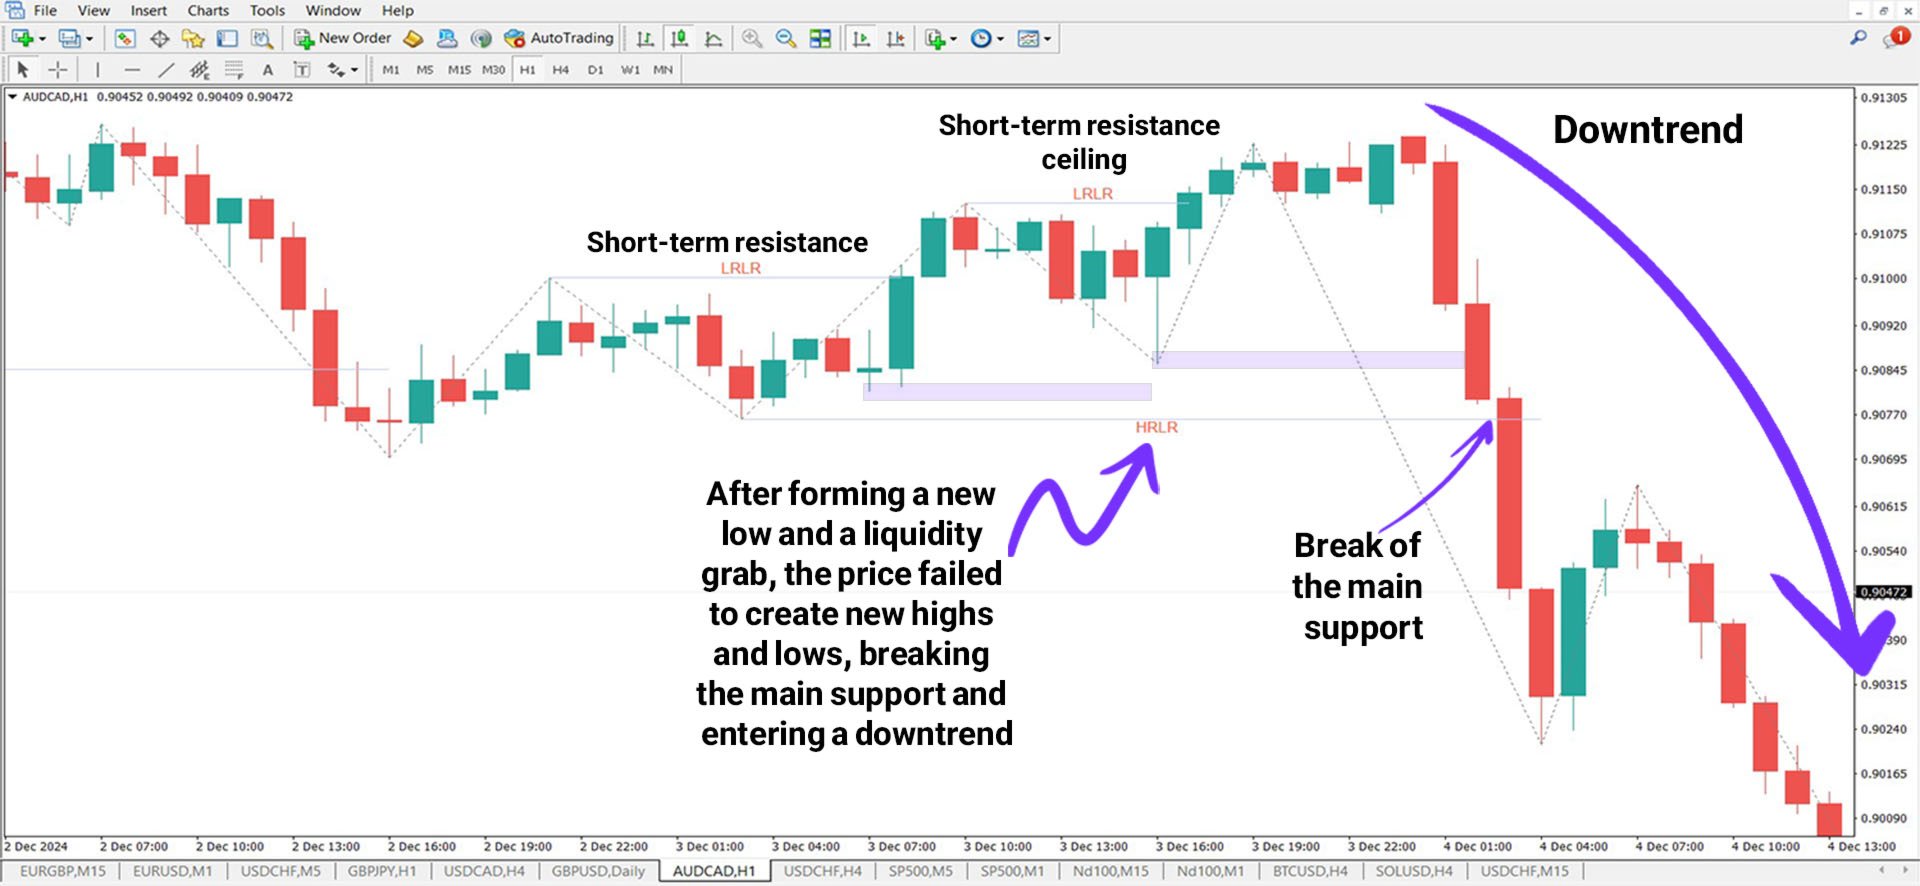
Utilizing the Indicator in a Downtrend
During bearish market conditions, the price might experience temporary retracements after tapping into liquidity. However, if the price fails to establish successive higher highs and higher lows, a sell opportunity arises upon breaking a significant low, reinforcing trend continuation signals.
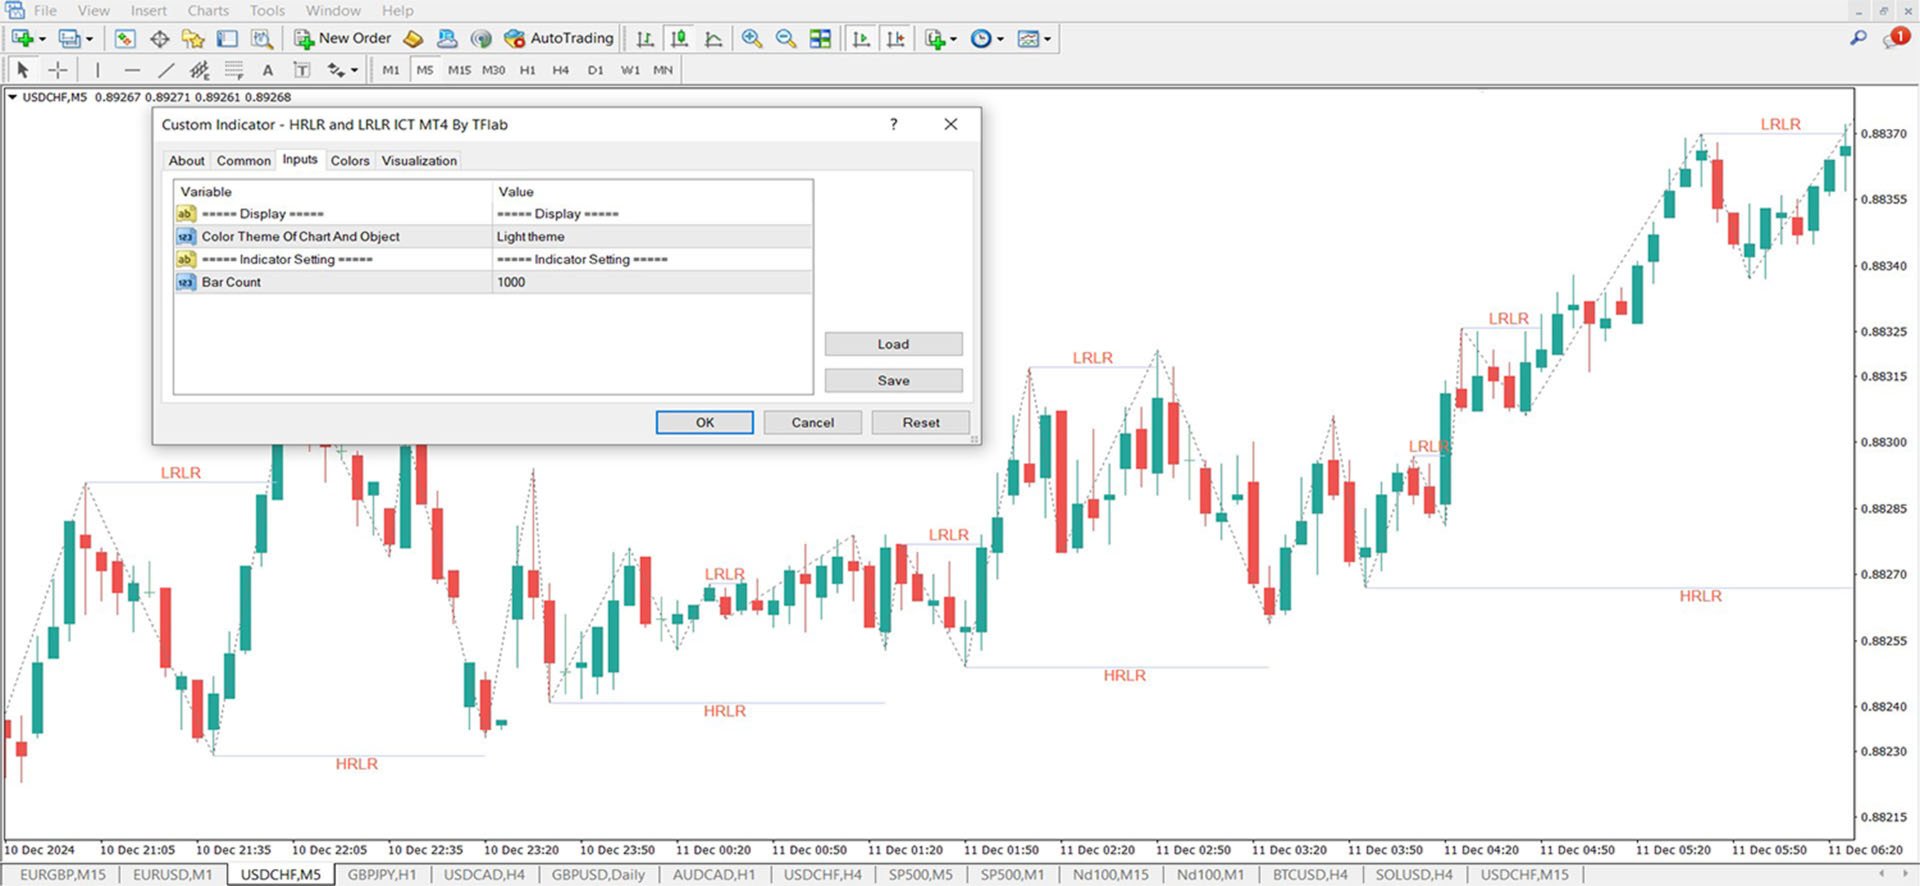
Customizable Settings
The HRLR & LRLR indicator offers adjustable parameters to enhance usability, as shown in the settings below:
Display Options
- Chart Theme & Object Colors: Adjust background colors for enhanced visualization.
Indicator Parameters
- Bar Count: Defines the number of candles considered for detecting reversal signals.
Conclusion
The HRLR & LRLR indicator is a vital tool for identifying key reversal zones and tracking trend continuations. By analyzing price structures, liquidity accumulation, and breakouts, it provides traders with confirmation for entries and exits based on market dynamics.