Multi Time frame Support Resistance
- Indicateurs
- Andri Maulana
- Version: 1.6
- Activations: 5
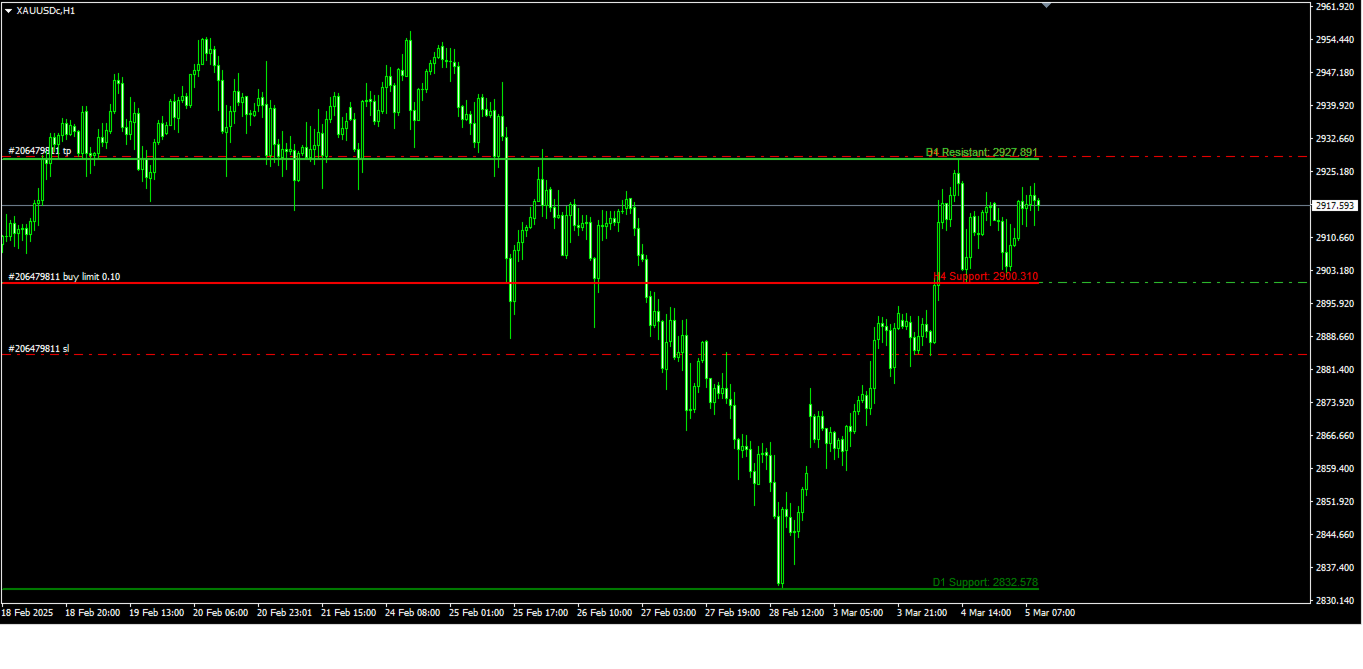
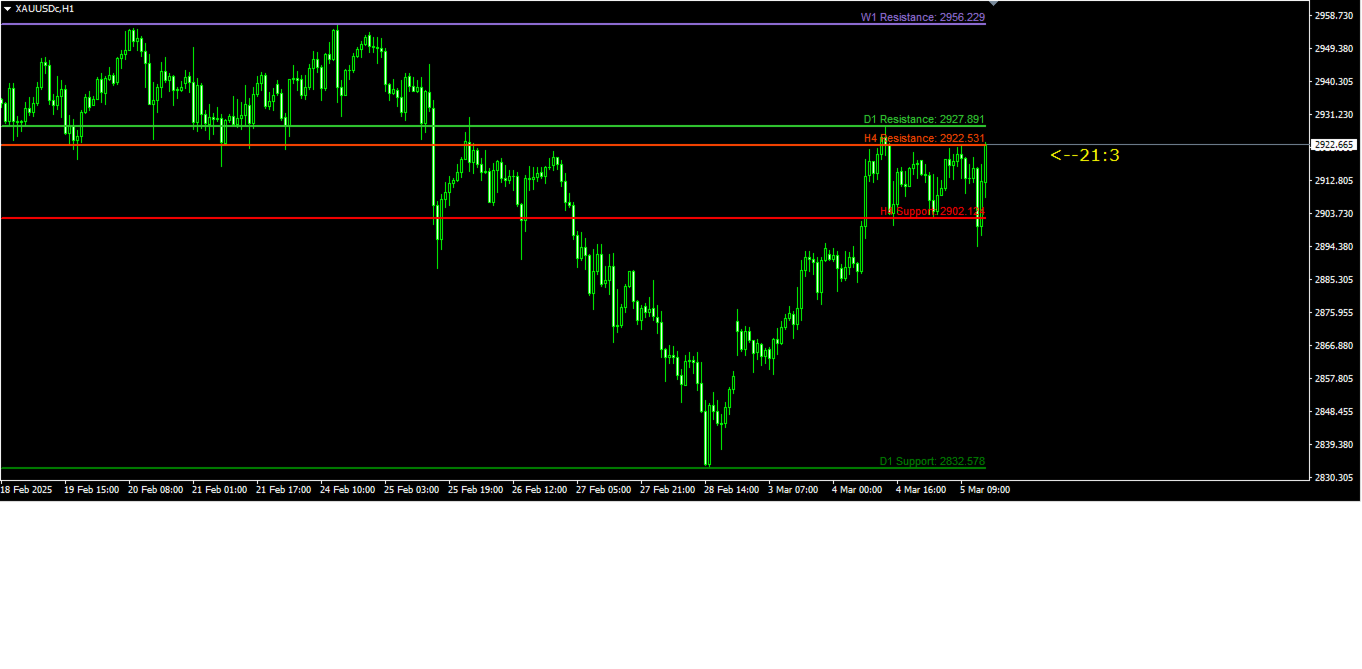
Multi-Timeframe Support & Resistance Indicator for MT4.
Professional Tool for Technical Traders.
Key Advantages
-
Multi-Timeframe Analysis - View critical levels from different timeframes simultaneously
-
Real-Time Alerts - Instant notifications when key levels change
-
Customizable Display - Adjust colors, line styles, and timeframes to match your strategy
-
User-Friendly - Easy setup with clear visual labels for all levels
Core Features
✅ Multi-Chart Integration: Track S/R from up to 4 timeframes at once
✅ Price & Timeframe Labels: Clear text displays showing exact price levels
✅ Adaptive Calculation: Automatically updates levels as markets change
✅ Custom Formatting: Match colors/styles to your chart theme
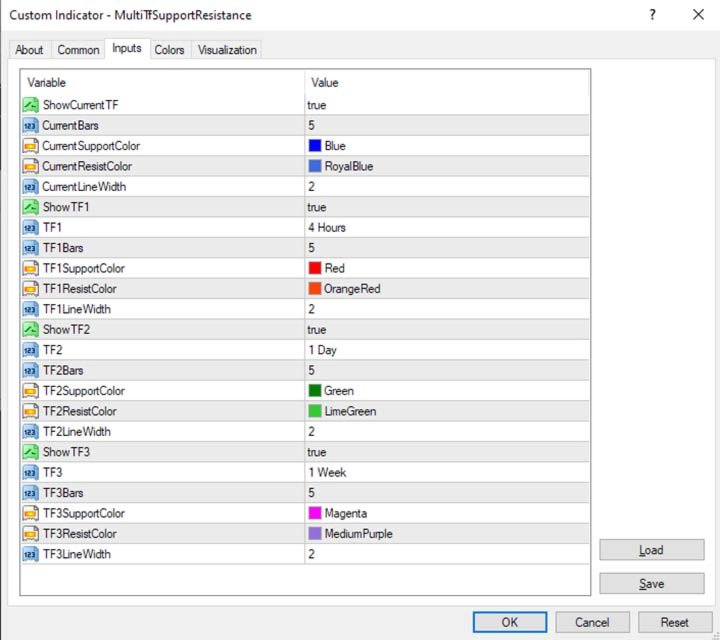
Indicator Configuration
-
SupportColor
-
Function: Color for support lines
-
-
ResistanceColor
-
Function: Color for resistance lines
-
-
LineWidth
-
Function: Thickness of S/R lines (1-5)
Multi-Timeframe Settings
-
ShowCurrentTF
-
Function: Toggle visibility of current chart's timeframe levels
-
-
ShowTF1 , ShowTF2 , ShowTF3
-
Function: Enable/disable additional timeframe levels
-
-
TF1 , TF2 , TF3
-
Options: M1, M5, H1, H4, D1, W1, MN
-
Example: PERIOD_H4 for 4-hour timeframe
-
-
TF1Bars , TF2Bars , TF3Bars
-
Function: Historical bars to analyze for each timeframe
Visual Customization
-
CurrentSupportColor , TF1SupportColor
-
Function: Custom colors for each timeframe's support line
-
-
CurrentResistColor , TF1ResistColor
-
Function: Custom colors for each timeframe's resistance line
-
-
CurrentLineWidth , TF1LineWidth
-
Function: Line thickness per timeframe (1-5)
Why Traders Love It
-
🚨 Never Miss a Breakout: Alerts trigger when prices cross key levels
-
📊 Strategic Clarity: Compare higher/lower timeframe levels at a glance
-
🎨 Personalized Charts: Match colors to your trading style
Ideal for swing traders, day traders, and investors needing clear price structure visibility.