• Aperçu
  • Avis
  • Commentaires

Smart Range Detector

Smart Range Detector – Advanced Market Structure Indicator

Overview

The Smart Range Detector is an advanced trading indicator designed to automatically identify key price ranges where market consolidation, accumulation, or distribution occurs. This tool helps traders spot high-probability breakout zones, liquidity areas, and potential trade setups by detecting significant price ranges that the market respects.

Unlike traditional range indicators, the Smart Range Detector dynamically adjusts based on market volatility, ensuring that traders always have up-to-date information on potential trading zones. Whether you're a day trader, swing trader, or scalper, this indicator provides valuable insights into market structure and trend continuation or reversal signals.

Key Features

Automatic Range Detection – Identifies critical price ranges where the market is accumulating or distributing.
Dynamic Adjustments – Updates in real-time based on price action and market conditions.
Multi-Timeframe Support – Works on multiple timeframes (1M to Daily) for a broader market perspective.
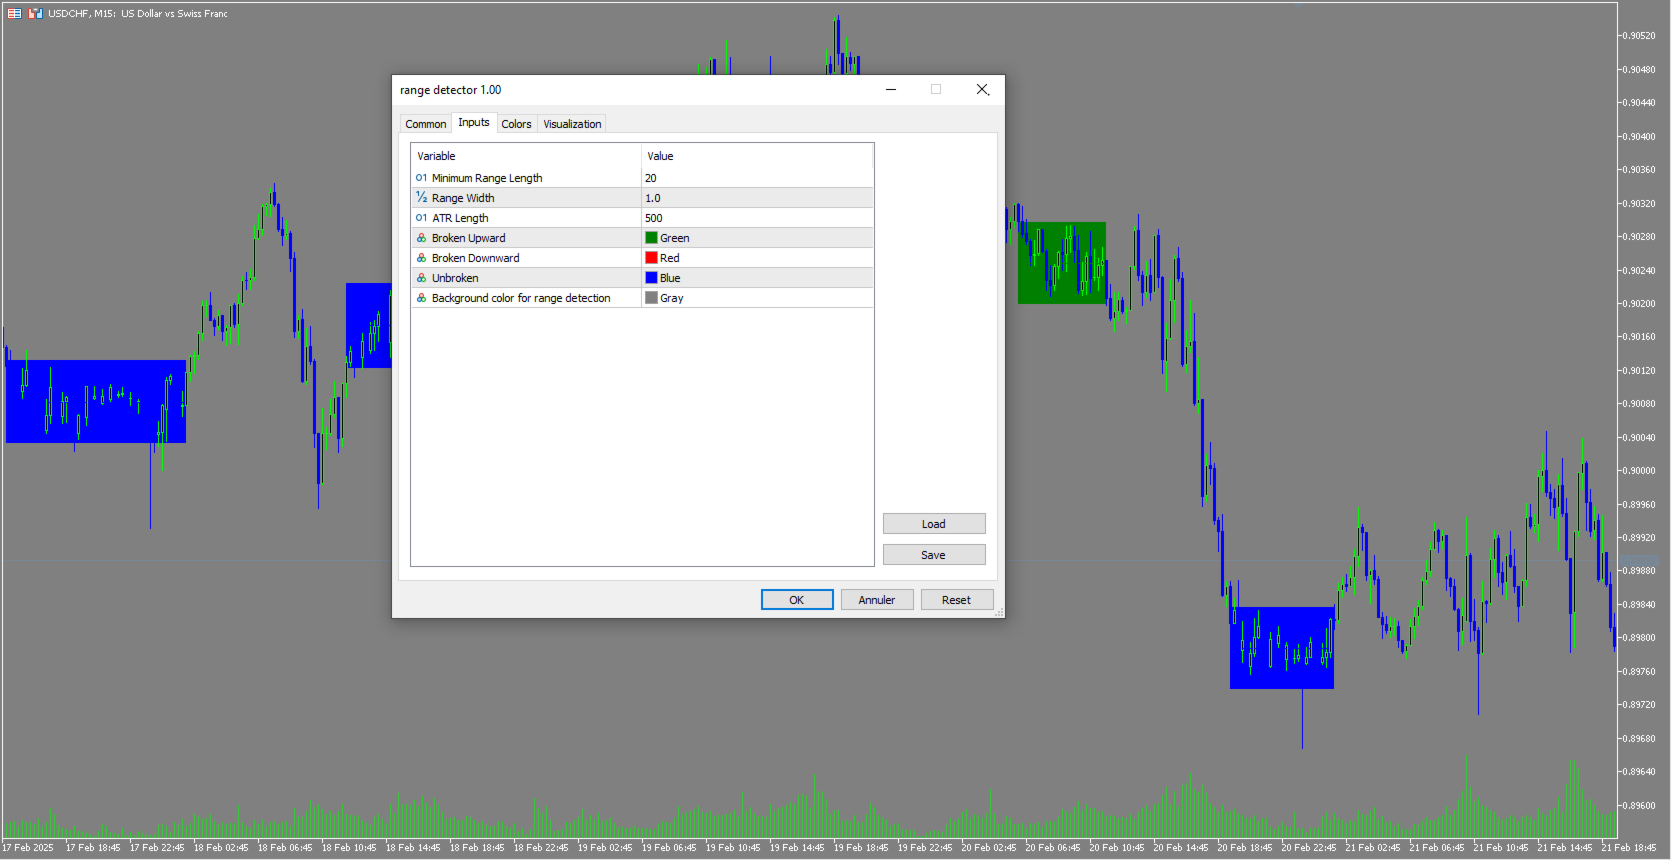
Customizable Parameters – Allows traders to fine-tune the range sensitivity, breakout levels, and alert settings based on their trading strategy.
Works on All Forex Pairs, Indices, and Commodities – Adaptable to different market conditions.

How the Smart Range Detector Works

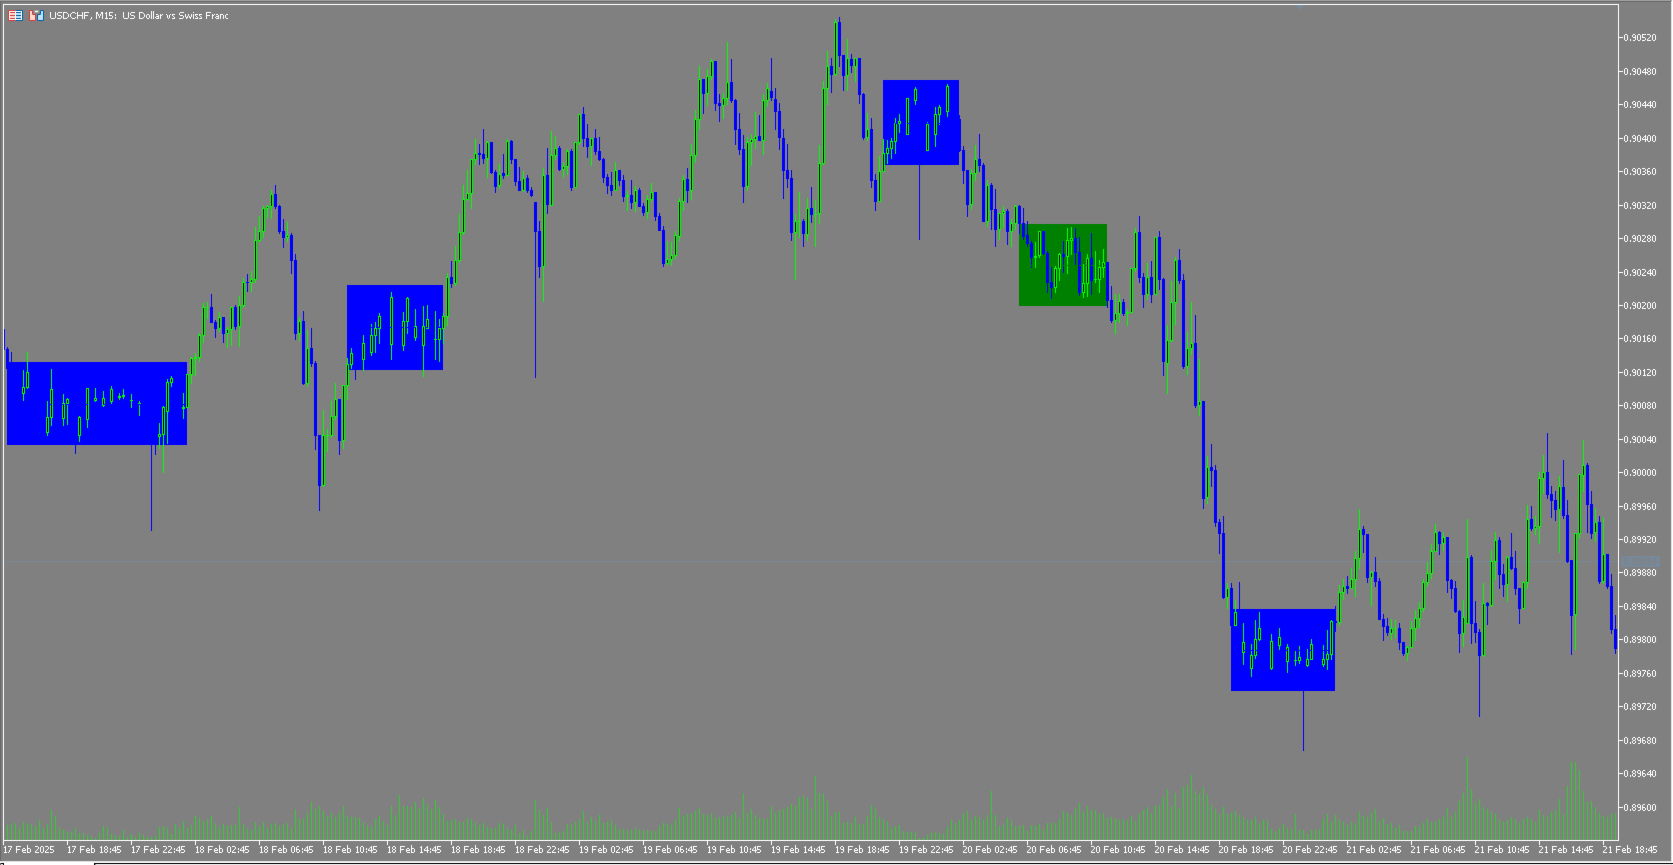
  1. Range Identification

    • The indicator scans historical price data and detects areas where price movement has been limited within a certain range.
    • It marks the upper and lower boundaries of the range, highlighting the key resistance and support zones.
    • It adjusts dynamically based on the latest price action.
  2. Breakout & Retest Confirmation

    • When price moves outside the detected range, the indicator checks if the breakout is strong or weak.
    • A breakout with momentum suggests a continuation trade opportunity, while a weak breakout may indicate a fakeout.
    • If price returns to the broken range and retests it successfully, it offers a high-probability trade setup.
  3. Reversal & Liquidity Traps

    • The indicator highlights areas where liquidity is being grabbed before a major move.
    • It detects potential reversals when price repeatedly rejects a range boundary.

How to Use the Smart Range Detector in Trading

1. Identifying High-Probability Trade Setups

  • Look for tight ranges forming in the market, as these indicate areas of consolidation before a major move.
  • Watch for breakouts and determine whether they have strong momentum or not.
  • Wait for a retest of the broken range to confirm a valid breakout before entering a trade.

2. Trading Breakouts and Fakeouts

  • If the price breaks above the upper boundary of the range with strong volume, consider entering a long position.
  • If the price breaks below the lower boundary, consider a short position.
  • If price quickly returns into the range after a breakout (fakeout), it signals a possible reversal.

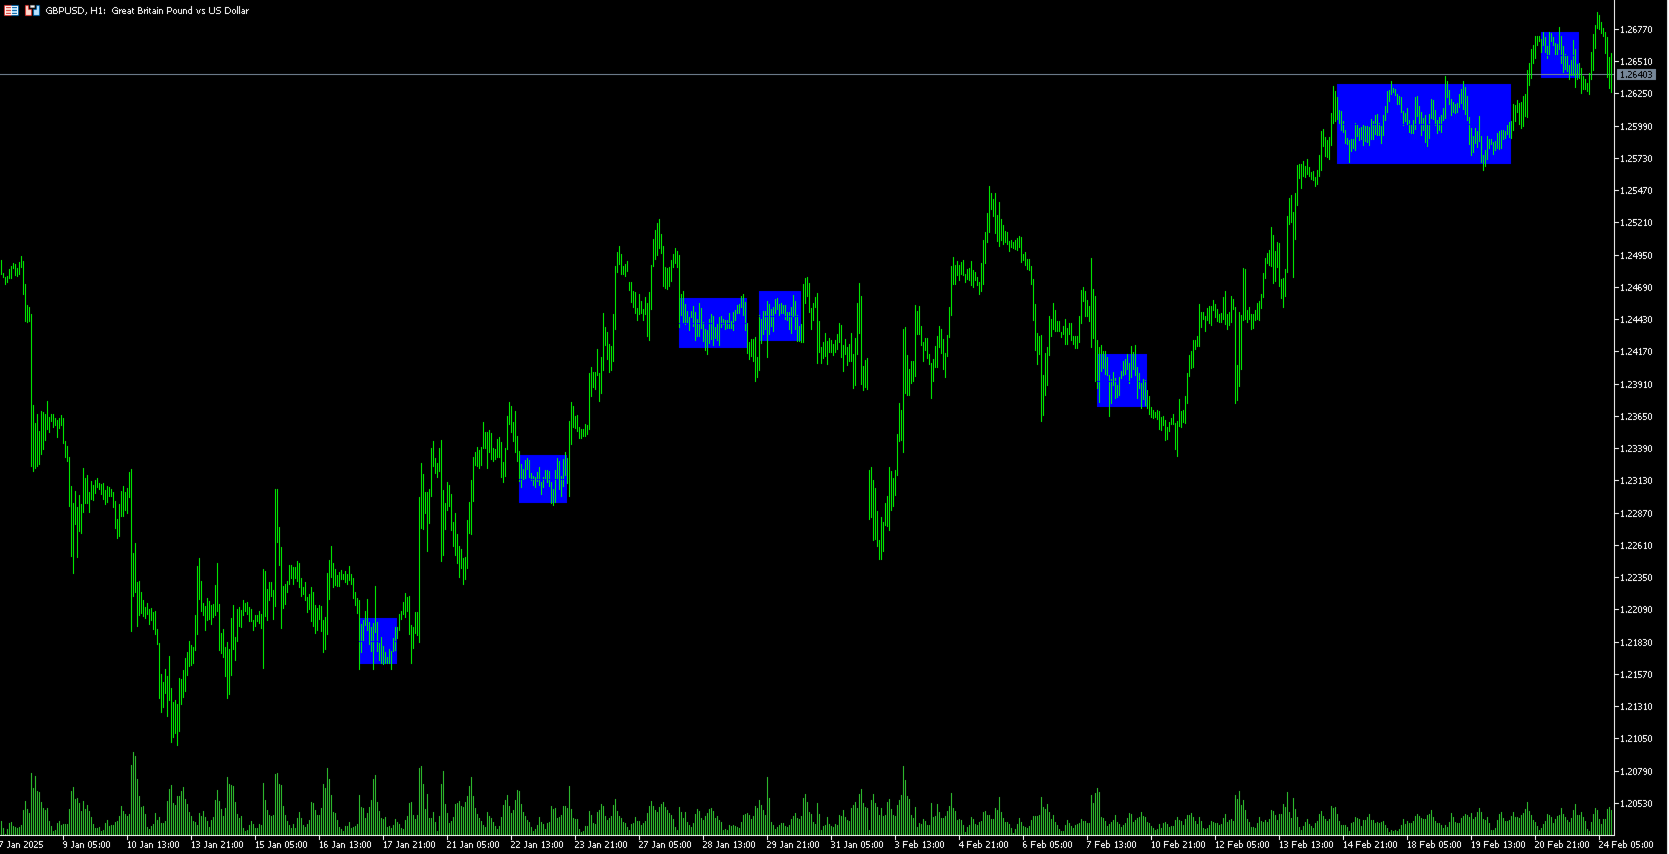
3. Using Multi-Timeframe Confirmation

  • Check the higher timeframe ranges (e.g., 4H or Daily) to see if the smaller range aligns with key support/resistance levels.
  • Use lower timeframes (e.g., 15M or 5M) for precise entry timing when trading breakouts.

4. Stop-Loss & Take-Profit Placement

  • Place stop-loss orders slightly outside the range to protect against fakeouts.
  • Set take-profit levels at the next significant support/resistance zone or based on risk-reward ratios (e.g., 1:2 or 1:3).

5. Enhancing Your Strategy with Smart Range Detector

  • Combine it with trend indicators (like moving averages) for stronger confirmation.
  • Use it alongside Fibonacci retracement to refine entry and exit points.
  • Pair it with volume analysis to detect strong or weak breakouts.

Why Use the Smart Range Detector?

📌 Improves Trade Accuracy – Helps filter out false breakouts and identify strong trend continuations.
📌 Saves Time – Eliminates the need for manually drawing support and resistance zones.
📌 Adapts to Any Market Condition – Works in trending and ranging markets.
📌 Suitable for All Trading Styles – Scalpers, swing traders, and position traders can benefit from its signals.


Produits recommandés
The Central Bank Dealers Range (CBDR) is a key ICT concept, used to project potential highs and lows for the day based on market conditions during a specific time window. The CBDR is utilized to forecast price movements in both bullish and bearish market conditions. By identifying this range, traders can better anticipate the price levels that may form as the day progresses. CBDR and Standard Deviation A key feature of the CBDR is its application of standard deviation , a statistical measure u
FREE
Strike Zone EA MT5
Matteo Schizzerotto
Strike Zone est un Expert Advisor basé sur un modèle de graphique en chandelier OHLC, tous les backtests sont basés sur 10 ans d'activité d'expert. Des paramètres fixes ont été utilisés pour les backtests : 1 paire, un capital de 10 000 $ et une entrée sur le marché de 0,1 lot. après des jours de tests, cet Expert Advisor s'est avéré rentable avec les paires et délais suivants : AUDCAD H4 NAS100 NZDCAD S1 USDCAD S1 Les backtests ne sont pas une garantie de profit futur, toute utilisation de c
FREE
### Introduction de l'indicateur Ultimate Pivot Levels pour MetaTrader 5 **Ultimate_Pivot_Levels** est un outil polyvalent conçu pour améliorer votre expérience de trading en traçant avec précision les niveaux de pivot sur vos graphiques. Il vous permet d'entrer vos valeurs désirées manuellement ou d'utiliser des méthodes de calcul de pivot bien connues pour créer des niveaux de pivot. Il trace les niveaux en arrière-plan et vous permet de personnaliser les niveaux, la taille et les couleurs de
FREE
An updated version is now available free of charge. Ver. 034.33   is available. Basics Currency Pair: EUR-USD 5 Minute Display and set the 5-minute chart of EUR-USD. Adjustments may be necessary depending on the broker. In particular, entry is controlled by " エンベロープミドル偏差"  and the ATR 1H value. About Envelope Middle Deviation " エンベロープミドル偏差" is closer to 1.0, the easier it is to enter the market, but at the same time, the rate of being cut-risk increases. About  ATR EntryLimit   ATR Entry Li
FREE
Investment Castle Trend Lines
Ahmed Alaaeldin Abdulrahman Ahmed Elherzawi
5 (6)
All traders should know the trend before making their decision when placing the buy or sell orders. The first step always starts with  supply and demand ,   rising and falling channels , trend lines, engulfing candles etc. All the above contribute to what is called “Price Action” and that is the best and most reliable way in trading and catching the trend and making profits, without stress. The  Investment Castle Trend Line Indicator  will automatically draw the trend lines on the MT5 for you.
FREE
One of the simplest Pivot Point indicator, easy to operate, and most complete for a single chart in determining    Resistance   and   Support  level lines. In single chart,  it will show R&S Level Line with 5 popular types of Pivot Point, Highest&Lowest of closing price Include the Trend and up to 3 Time Frames. Five   types   (Floor, Woodie, Camarilla, DeMark, & Fibonacci)   of popular   Pivot Points   in determining   Resistance   and   Support   levels. With just using simple button on the
FREE
Nyse Usdxy
Mitchell Dean Ede
5 (1)
Displays a USD DXY chart in a seperate window below the main chart. YOUR BROKER MUST HAVE THESE SYMBOLS FOR THE INDICATOR TO WORK Based on EUR/USD, USD/JPY, GBP/USD, USD/CAD, USD/CHF and USD/SEK All these pairs must be added to Market Watch for the indicator to work correctly As this is calculated using a formula based on the 6 pairs it will only work when the market is open. YOUR BROKER MUST HAVE THESE SYMBOLS FOR THE INDICATOR TO WORK Displays a USD DXY chart in a seperate window below the m
FREE
Présentation de l' Indicateur VXN Code de réduction de 25 % sur Darwinex Zero : DWZ2328770MGM Votre allié ultime pour naviguer dans les eaux volatiles de l'indice Nasdaq-100. Conçu pour les traders exigeant précision et fiabilité, l'Indicateur VXN fournit des informations en temps réel sur le sentiment du marché et les fluctuations potentielles des prix. Avec l'Indicateur VXN, vous pouvez : Prédire la Volatilité : Gagnez un avantage compétitif en anticipant avec précision les mouvements du mar
FREE
Daily Open Line
Attila Radulovic
4 (5)
The indicator draws the daily open line. Parameters GMT shift (minutes) The time zone could be shifted. The value is given in minutes. Draw closest regular bar's open price This parameter could fine-tune the open price line when using GMT shift. Yes - Draw the open line based on the current chart period's closest regular bar No - Draw the open line based on the M1 chart's closest bar.  Let's assume that your shift is 10 minutes, and you are using H1 chart and the first candle in every day is 0
FREE
Simple Weis Wave
Jean Jacques Huve Ribeiro
3.67 (3)
One of the best tools for analyzing volume, Weis Wave was idelized by David Weis, to facilitate the reading of directional flow. For the VSA method disciples it is an evolution of the practices created by Richard Wycoff, facilitating a predictive reading of the market, always seeking an accumulation and distribution of the negotiated contracts. Cumulative wave volume  Range of wave ( removed) Average Wave volume Ref "Tim Ord lectures" ( removed)
FREE
Buy and Sell Power
Marco Engstermann
4 (2)
Simple Indicator that shows the Buy and Sell volume in percent. Settings: Font size for percentage labels Horizontal offset from right edge (pixels) Vertical offset for Signal label from bottom (pixels) Vertical offset for Buy label from bottom (pixels) Vertical offset for Sell label from bottom (pixels) Color for Buy label Color for Sell label Color for Strong Buy signal Color for Buy signal Color for Strong Sell signal Color for Sell signal Color for Neutral signal Default to every tick
FREE
My Candle Patterns
Francisco Gomes Da Silva
5 (1)
Cet indicateur est une version de démonstration de My Candle Complete, qui peut être téléchargée ici : Candle Patterns Creator Avec la version complète, vous pouvez créer vos propres règles de chandeliers et modifier les motifs de chandeliers traditionnels pour les rendre plus précis selon votre stratégie. L'indicateur comprend plusieurs exemples de règles de chandeliers, mais je vais ici en présenter seulement quelques-unes : Pattern Rule Candle Green C > O Candle Red C < O Doji C = O Hammer (C
FREE
Weis Wave Double Side Alert
Eduardo Da Costa Custodio Santos
L'indicateur latéral Weis Wave Bouble pour MT5 fait partie de la boîte à outils (Wyckoff Academy Wave Market) L'indicateur latéral Weis Wave Bouble pour MT5 a été créé sur la base de la Weis Wave déjà établie créée par David Weis. L'indicateur Weis Wave Double Side lit le marché par vagues comme R. Wyckoff l'a fait en 1900. Il aide à identifier l'effort x le résultat, la cause et l'effet, et l'offre et la demande Son différentiel est qu'il peut être utilisé en dessous de l'axe zéro et dispose d'
Market Trend Levels Detector The Market Trend Levels Detector is an MQL5 indicator designed to help traders visualize dynamic market trends and potential reversal points. It operates by calculating two exponential moving averages (EMAs)—a fast EMA and a slow EMA—to assess the current trend direction. Key features include: Dynamic Trend Fill: The area between the fast and slow EMAs is filled with different colors depending on the market regime. When the fast EMA is above the slow EMA (suggesting
FREE
NakaTrend
Ricardo De Andrade Nakano
2 (1)
"Découvrez NakaTrend : Votre détecteur de tendances ultime pour MetaTrader 5 ! Êtes-vous prêt à révolutionner votre expérience de trading ? Faites la connaissance de NakaTrend, votre indicateur fiable pour identifier avec précision et facilité les changements de tendance. Avec NakaTrend, ne manquez plus jamais une opportunité de tirer parti des fluctuations du marché. Lorsqu'une tendance haussière se dessine, NakaTrend le signale avec un symbole de dollar vert et vous encourage à passer un or
FREE
The utility draws pivot levels for the selected timefram in classic method. Pivot = (high + close + low) / 3 R1 = ( 2 * Pivot) - low S1 = ( 2 * Pivot) - high R2 = Pivot + ( high - low ) R3 = high + ( 2 * (Pivot - low)) S2 = Pivot - (high - low) S3 = low - ( 2 * (high - Pivot)) you can change the timeframe, colors and fontsize. also you can change the text for the levels. Have fun and give feedback...
FREE
SMC Structure Markup
Seyed Mohammad Hosseini Hejazi
5 (6)
Overview The Smart Money Structure Markup Indicator for MetaTrader 5 is a powerful tool designed to help traders identify key market structures based on popular Smart Money Concepts (SMC) strategies. This indicator detects micro-market structures, providing insights into price movements and potential trend changes. It highlights important elements such as valid Break of Structure (BOS), Change of Character (CHoCH), and Inducement (IDM), helping traders to make informed decisions. Key Features Ma
FREE
Decision Point
Zoltan Nemet
5 (1)
With this indicator user can determine not just pivot like turning points. User able to spot trading ranges boundaries and support-resistance levels.  In a strong trend the reverse signals also gives us excellent entry points. Recommended user settings: In the Attis volume: look back period : 1 or (3) MA_Lenght 99. ( of course one can play with the settings and get tailored signals... as you need)
FREE
RSI Chart Levels
Nikolay Mitrofanov
5 (5)
The indicator draws levels based on the overbought and oversold values ​​of the RSI indicator. The maximum values ​​are taken into account, which are equal to or exceeded certain limits. That is, for example, when the price has gone into the overbought zone, the highest price is selected from all prices in this zone for this period of time, and as soon as the indicator value returns to a value below the overbought value, the level is fixed and the calculation of new values ​​begins. The same
FREE
Dark Bands MT5
Marco Solito
4.89 (211)
Dark Bands   is an Indicator for intraday trading. This Indicator is based on Counter Trend  strategy but use also Volatility. We can enter in good price with this Indicator, in order to follow the inversions on the current instrument. Key benefits Easily visible take profit/stop loss lines Reliable bands lines with futuristic colors, and  Intuitive directional arrows Useful statistics , which indicate the win rate of the signals Plus Package  available, leave a feedback to receive it for fr
FREE
The   OHLC indicator   shows the current and historical values of High, Low, Open, Close and Mid for a specific time period. It can plot the current values or the values from the previous session. The indicator's range can be calculated from a daily, weekly, monthly, or user-specified session. Levels High  of the current or previous session. Low  of the current or previous session. Open  of current or previous session. Close  of the current or previous session. Midpoint  of the current or prev
FREE
This indicator uses a different approach from the previous version to get it's trendlines. This method is derived from Orchard Forex, and the process of making the indicator is demonstrated in there video   https://www.youtube.com/watch?v=mEaiurw56wY&t=1425s . The basic idea behind this indicator is it draws a   tangent line   on the highest levels and lowest levels of the bars used for calculation, while ensuring that the lines don't intersect with the bars in review (alittle confusing? I know
FREE
Pivot MT5
Dmitrij Isaenko
The indicator draws daily support and resistance lines on the chart, as well as the Pivot level (reversal level). Adapted to work in MT5 The standard timeframe for calculating support and resistance levels is D1. You can choose other timeframes according to your strategy (for example, for M1-M15, the optimal timeframe for calculations is H1) The function for calculating support and resistance levels has been updated; in this calculation option, fibonacci levels are taken into account, respec
FREE
White Weis Volume Ticks
Ricardo Almeida Branco
5 (4)
White Weis Volume This indicator shows the sum of the volume in each wave, bulish or bearish, as idealized by David Weis , but it brings an important addition , which is the marking of the bar with the highest volume of the wave (White Bar)! In coding the indicator, it was sought to optimize the code to require minimal processing during use and not to overload mt5. The indicator can be used for pre-trading analysis and study, where the trader analyzes possible points of support and resistance
Overview The Period Breakout Indicator is a versatile tool designed for traders seeking to identify breakout opportunities based on customizable time periods. This indicator automatically determines the highest and lowest prices within a user-defined period, allowing you to tailor it precisely to your trading strategy. Key Features Customizable Time Periods:   Define the start and end times based on your preferred trading hours or any specific period. The indicator will then calculate the highes
FREE
Angle Dashboard for MT5
Taras Slobodyanik
5 (1)
This is a multicurrency and multitimeframe indicator that calculates the angle between two points. Points for measuring the angle can be taken from the ZigZag (the last two points), or from the Moving Average (between two given bars), or it can be the closing prices of bars. Angle measurement is possible in degrees or in radians. You can select the scale for the calculation. For a better understanding of the indicator, you can study the free Angle High Low indicator. In the parameters you can
This indicators automatically draws the   support and resistances   levels (key levels) for you once you've dropped it on a chart. It reduces the hustle of drawing and redrawing these levels every time you analyse prices on a chart. With it, all you have to do is drop it on a chart, adjust the settings to your liking and let the indicator do the rest. But wait, it gets better; the indicator is absolutely free! For more information:  https://youtu.be/rTxbPOBu3nY For more free stuff visit:  https:
FREE
Important Lines
Terence Gronowski
4.86 (21)
This indicator displays Pivot-Lines, preday high and low, preday close and the minimum and maximum of the previous hour. You just have to put this single indicator to the chart to have all these important lines, no need to setup many single indicators. Why certain lines are important Preday high and low : These are watched by traders who trade in a daily chart. Very often, if price climbs over or falls under a preday low/high there is an acceleration in buying/selling. It is a breakout out of a
FREE
Le Localisateur de Niveaux de Support et de Résistance : Le Localisateur de Niveaux de Support et de Résistance est un outil avancé conçu pour améliorer l'analyse technique dans le trading. Doté de niveaux dynamiques de support et de résistance, il s'adapte en temps réel à mesure que de nouveaux points clés se dévoilent sur le graphique, offrant ainsi une analyse dynamique et réactive. Sa capacité unique à plusieurs échelles de temps permet aux utilisateurs d'afficher des niveaux de support et
FREE
Support Resistance Indicator The "Support Resistance" indicator is a versatile tool designed to help traders identify key support and resistance levels based on an underlying algorithm. These levels indicate price points where an asset historically experiences buying (support) or selling (resistance) pressure. The indicator allows traders to visualize these levels on their charts, making it easier to make informed decisions. All Products   |   Contact PARAMETERS: Timeframe : Users can select the
FREE
Les acheteurs de ce produit ont également acheté
Trend Screener Pro MT5
STE S.S.COMPANY
4.85 (82)
Indicateur de tendance, solution unique révolutionnaire pour le trading et le filtrage des tendances avec toutes les fonctionnalités de tendance importantes intégrées dans un seul outil ! Il s'agit d'un indicateur multi-période et multi-devises 100 % non repeint qui peut être utilisé sur tous les symboles/instruments : forex, matières premières, crypto-monnaies, indices et actions. Trend Screener est un indicateur de suivi de tendance efficace qui fournit des signaux de tendance fléchés avec des
Algo Pumping
Ihor Otkydach
5 (10)
PUMPING STATION – Votre stratégie personnelle «tout compris» Nous vous présentons PUMPING STATION – un indicateur Forex révolutionnaire qui transformera votre façon de trader en une expérience à la fois efficace et passionnante. Ce n’est pas seulement un assistant, mais un véritable système de trading complet, doté d’algorithmes puissants pour vous aider à trader de manière plus stable. En achetant ce produit, vous recevez GRATUITEMENT : Fichiers de configuration exclusifs : pour un réglage auto
Golden Trend Indicator MT5
Noha Mohamed Fathy Younes Badr
4.89 (18)
Golden Trend indicator  is The best indicator for predicting trend movement this indicator never lags and never repaints and never back paints    and give  arrow buy and sell    before the candle appear  and it will help you and  will make your trading decisions clearer its work on all currencies and  gold and crypto and all time frame This unique  indicator uses very secret algorithms to catch the  trends, so you can trade using this indicator and see the trend clear on charts  manual guide and
Divergence Bomber
Ihor Otkydach
5 (1)
Chaque acheteur de cet indicateur reçoit également gratuitement : L’outil exclusif « Bomber Utility », qui accompagne automatiquement chaque opération de trading, fixe les niveaux de Stop Loss et de Take Profit, et clôture les positions selon les règles de la stratégie Des fichiers de configuration (set files) pour adapter l’indicateur à différents actifs Des set files pour configurer le Bomber Utility selon différents modes : « Risque Minimum », « Risque Équilibré » et « Stratégie d’Attente » U
Support And Resistance Screener est dans un indicateur de niveau pour MetaTrader qui fournit plusieurs outils à l'intérieur d'un indicateur. Les outils disponibles sont : 1. Filtre de structure de marché. 2. Zone de repli haussier. 3. Zone de recul baissier. 4. Points pivots quotidiens 5. points pivots hebdomadaires 6. Points pivots mensuels 7. Support et résistance forts basés sur le modèle harmonique et le volume. 8. Zones au niveau de la banque. OFFRE D'UNE DURÉE LIMITÉE : L'indicateur de sup
TPSpro RFI Levels MT5
Roman Podpora
4.55 (20)
Zones de retournement / Volumes de pointe / Zones actives d'un acteur majeur =       SYSTÈME TS TPSPRO INSTRUCTIONS RUS       /       INSTRUCTIONS       FR       /           Version MT4        Chaque acheteur de cet indicateur reçoit en plus GRATUITEMENT : 6 mois d'accès aux signaux de trading du service RFI SIGNALS - points d'entrée prêts à l'emploi selon l'algorithme TPSproSYSTEM. Supports de formation avec mises à jour régulières - plongez-vous dans la stratégie et développez votre niveau p
RelicusRoad Pro MT5
Relicus LLC
4.78 (18)
Maintenant 147 $ (augmentant à 499 $ après quelques mises à jour) - Comptes illimités (PCS ou Mac) Manuel d'utilisation RelicusRoad + Vidéos de formation + Accès au groupe Discord privé + Statut VIP UNE NOUVELLE FAÇON DE REGARDER LE MARCHÉ RelicusRoad est l'indicateur de trading le plus puissant au monde pour le forex, les contrats à terme, les crypto-monnaies, les actions et les indices, offrant aux traders toutes les informations et tous les outils dont ils ont besoin pour rester rentables
FX Volume MT5
Daniel Stein
4.82 (17)
FX Volume : Découvrez le Sentiment du Marché tel que perçu par un Courtier Présentation Rapide Vous souhaitez faire passer votre approche de trading au niveau supérieur ? FX Volume vous fournit, en temps réel, des informations sur la manière dont les traders particuliers et les courtiers sont positionnés—bien avant la publication de rapports retardés comme le COT. Que vous visiez des gains réguliers ou recherchiez simplement un avantage plus solide sur les marchés, FX Volume vous aide à repére
MetaForecast M5
Vahidreza Heidar Gholami
5 (3)
MetaForecast prédit et visualise l'avenir de n'importe quel marché en se basant sur les harmoniques des données de prix. Bien que le marché ne soit pas toujours prévisible, s'il y a un motif dans les prix, MetaForecast peut prédire l'avenir aussi précisément que possible. Comparé à d'autres produits similaires, MetaForecast peut générer des résultats plus précis en analysant les tendances du marché. Paramètres d'entrée Past size (Taille passée) Spécifie le nombre de barres que MetaForecast util
Gold Stuff mt5
Vasiliy Strukov
4.93 (178)
Gold Stuff mt5 est un indicateur de tendance conçu spécifiquement pour l'or et peut également être utilisé sur n'importe quel instrument financier. L'indicateur ne se redessine pas et ne traîne pas. Délai recommandé H1. Contactez-moi immédiatement après l'achat pour obtenir les réglages et un bonus personnel !   Vous pouvez obtenir une copie gratuite de notre indicateur Strong Support et Trend Scanner, veuillez envoyer un message privé. moi!   RÉGLAGES Dessiner la flèche - on off. dessiner d
FX Power MT5 NG
Daniel Stein
5 (15)
FX Power : Analysez la force des devises pour des décisions de trading plus intelligentes Aperçu FX Power est l'outil essentiel pour comprendre la force réelle des principales devises et de l'or, quelles que soient les conditions du marché. En identifiant les devises fortes à acheter et les faibles à vendre, FX Power simplifie vos décisions de trading et révèle des opportunités à forte probabilité. Que vous suiviez les tendances ou anticipiez les retournements à l'aide de valeurs extrêmes de D
Ce tableau de bord affiche les derniers   modèles harmoniques   disponibles pour les symboles sélectionnés, ce qui vous permettra de gagner du temps et d'être plus efficace /   version MT4 . Indicateur gratuit:   Basic Harmonic Pattern Colonnes de l'indicateur Symbol :   les symboles sélectionnés apparaissent Trend   :   haussière ou baissière Pattern :   type de motif (gartley, papillon, chauve-souris, crabe, requin, cypher ou ABCD) Entry:   prix d'entrée SL:   prix du stop loss TP1:   1er
Quantum TrendPulse
Bogdan Ion Puscasu
5 (13)
Présentation de   Quantum TrendPulse   , l'outil de trading ultime qui combine la puissance de   SuperTrend   ,   RSI   et   Stochastic   dans un seul indicateur complet pour maximiser votre potentiel de trading. Conçu pour les traders qui recherchent précision et efficacité, cet indicateur vous aide à identifier les tendances du marché, les changements de dynamique et les points d'entrée et de sortie optimaux en toute confiance. Caractéristiques principales : Intégration SuperTrend :   suivez f
Matrix Arrow Indicator MT5
Juvenille Emperor Limited
5 (13)
Matrix Arrow Indicator MT5   est une tendance unique 10 en 1 suivant un indicateur multi-période   100% non repeint   qui peut être utilisé sur tous les symboles/instruments:   forex ,   matières premières ,   crypto-monnaies ,   indices ,  actions .  Matrix Arrow Indicator MT5  déterminera la tendance actuelle à ses débuts, en rassemblant des informations et des données à partir d'un maximum de 10 indicateurs standard, qui sont: Indice de mouvement directionnel moyen (ADX) Indice de canal de m
TPSproTREND PrO MT5
Roman Podpora
4.72 (18)
VERSION MT4        —        ИНСТРУКЦИЯ RUS           —        INSTRUCTIONS  ENG Fonctions principales : Signaux d'entrée précis SANS RENDU ! Si un signal apparaît, il reste d’actualité ! Il s'agit d'une différence importante par rapport aux indicateurs de redessinage, qui peuvent fournir un signal puis le modifier, ce qui peut entraîner une perte de fonds en dépôt. Vous pouvez désormais entrer sur le marché avec plus de probabilité et de précision. Il existe également une fonction de coloration
MONEYTRON – ТВОЙ ЛИЧНЫЙ СИГНАЛ НА УСПЕХ! XAUUSD | AUDUSD | USDJPY | BTCUSD Поддержка таймфреймов: M5, M15, M30, H1 Почему трейдеры выбирают Moneytron? 82% успешных сделок — это не просто цифры, это результат продуманной логики, точного алгоритма и настоящей силы анализа. Автоматические сигналы на вход — не нужно гадать: когда покупать, когда продавать. 3 уровня Take Profit — ты сам выбираешь свой уровень прибыли: безопасный, уверенный или максимум. Четкий Stop Loss — контролируешь риск
Grabber System MT5
Ihor Otkydach
5 (5)
Je vous présente un excellent indicateur technique : Grabber, qui fonctionne comme une stratégie de trading "tout-en-un", prête à l'emploi. En un seul code sont intégrés des outils puissants d'analyse technique du marché, des signaux de trading (flèches), des fonctions d'alerte et des notifications push. Chaque acheteur de cet indicateur reçoit également gratuitement : L'utilitaire Grabber : pour la gestion automatique des ordres ouverts Un guide vidéo étape par étape : pour apprendre à installe
Atomic Analyst MT5
Issam Kassas
4.32 (19)
Tout d'abord, il convient de souligner que cet indicateur de trading n'est ni repainting, ni redrawing et ne présente aucun délai, ce qui le rend idéal à la fois pour le trading manuel et automatisé. Manuel de l'utilisateur : réglages, entrées et stratégie. L'Analyste Atomique est un indicateur d'action sur les prix PA qui utilise la force et le momentum du prix pour trouver un meilleur avantage sur le marché. Équipé de filtres avancés qui aident à éliminer les bruits et les faux signaux, et à
Tout d'abord, il convient de souligner que cet outil de trading est un indicateur non repeint, non redessiné et non retardé, ce qui le rend idéal pour le trading professionnel. Cours en ligne, manuel utilisateur et démonstration. L'indicateur Smart Price Action Concepts est un outil très puissant à la fois pour les nouveaux et les traders expérimentés. Il regroupe plus de 20 indicateurs utiles en un seul, combinant des idées de trading avancées telles que l'analyse du trader Inner Circle et le
MTF Supply Demand Zones MT5
Georgios Kalomoiropoulos
5 (1)
Nouvelle génération de zones d'approvisionnement et de demande automatisées. Algorithme nouveau et innovant qui fonctionne sur n'importe quel graphique. Toutes les zones sont créées dynamiquement en fonction de l'action des prix du marché. DEUX TYPES D'ALERTES --> 1) QUAND LE PRIX ATTEINT UNE ZONE 2) QUAND UNE NOUVELLE ZONE SE FORME Vous n'obtenez pas un indicateur inutile de plus. Vous obtenez une stratégie de trading complète avec des résultats prouvés.     Nouvelles fonctionnalités:   
FxaccurateLS
Shiv Raj Kumawat
WHY IS OUR FXACCCURATE LS MT5 THE PROFITABLE ? PROTECT YOUR CAPITAL WITH RISK MANAGEMENT Gives entry, stop and target levels from time to time. It finds Trading opportunities by analyzing what the price is doing during established trends. POWERFUL INDICATOR FOR A RELIABLE STRATEGIES We have made these indicators with a lot of years of hard work. It is made at a very advanced level. Established trends provide dozens of trading opportunities, but most trend indicators completely ignore them! The
Top indicator for MT5   providing accurate signals to enter a trade without repainting! It can be applied to any financial assets:   forex, cryptocurrencies, metals, stocks, indices .  Watch  the video  (6:22) with an example of processing only one signal that paid off the indicator! MT4 version is here It will provide pretty accurate trading signals and tell you when it's best to open a trade and close it. Most traders improve their trading results during the first trading week with the help of
NOTE: CYCLEMAESTRO is distributed only on this website, there are no other distributors. Demo version is for reference only and is not supported. Full versione is perfectly functional and it is supported. CYCLEMAESTRO , the first and only indicator of Cyclic Analysis, useful for giving signals of TRADING, BUY, SELL, STOP LOSS, ADDING. Created on the logic of   Serghei Istrati   and programmed by   Stefano Frisetti ;   CYCLEMAESTRO   is not an indicator like the others, the challenge was to inter
ATrend
Zaha Feiz
4.77 (13)
ATREND ATREND : Comment ça fonctionne et comment l'utiliser Comment ça fonctionne L'indicateur "ATREND" pour la plateforme MT5 est conçu pour fournir aux traders des signaux d'achat et de vente robustes en utilisant une combinaison de méthodologies d'analyse technique. Cet indicateur s'appuie principalement sur la plage vraie moyenne (ATR) pour mesurer la volatilité, ainsi que sur des algorithmes de détection de tendance pour identifier les mouvements potentiels du marché. Laissez un message ap
FourAverageMT5
Mikhail Sergeev
5 (2)
FourAverage est un nouveau mot dans la détection de tendance. Avec le développement des technologies de l'information et un grand nombre d'acteurs, les marchés financiers sont de moins en moins analysables par des indicateurs obsolètes. Les outils d'analyse techniques classiques, tels que la moyenne Mobile ou la Stochastique, dans leur forme pure, ne sont pas capables de déterminer la direction ou l'inversion d'une tendance. Un indicateur peut-il indiquer la bonne direction du prix futur, sans c
FX Levels MT5
Daniel Stein
5 (4)
FX Levels : Des zones de Support et Résistance d’une Précision Exceptionnelle pour Tous les Marchés Présentation Rapide Vous recherchez un moyen fiable pour déterminer des niveaux de support et résistance dans n’importe quel marché—paires de devises, indices, actions ou matières premières ? FX Levels associe la méthode traditionnelle « Lighthouse » à une approche dynamique de pointe, offrant une précision quasi universelle. Grâce à notre expérience réelle avec des brokers et à des mises à jour
Présentation       Quantum Breakout PRO   , l'indicateur révolutionnaire MQL5 qui transforme la façon dont vous négociez les zones d'évasion ! Développé par une équipe de traders expérimentés avec une expérience commerciale de plus de 13 ans,       Évasion quantique PRO       est conçu pour propulser votre parcours commercial vers de nouveaux sommets grâce à sa stratégie de zone de discussion innovante et dynamique. Quantum Breakout Indicator vous donnera des flèches de signalisation sur les z
Vous recherchez un puissant indicateur de trading forex qui peut vous aider à identifier facilement des opportunités de trading rentables ? Ne cherchez pas plus loin que le Beast Super Signal. Cet indicateur basé sur les tendances facile à utiliser surveille en permanence les conditions du marché, en recherchant de nouvelles tendances en développement ou en sautant sur celles existantes. Le Beast Super Signal donne un signal d'achat ou de vente lorsque toutes les stratégies internes s'alignent
Trend Hunter MT5
Andrey Tatarinov
5 (2)
Trend Hunter est un indicateur de tendance pour travailler sur les marchés du Forex, des cryptomonnaies et des CFD. Une particularité de l'indicateur est qu'il suit la tendance avec confiance, sans changer le signal lorsque le prix dépasse légèrement la ligne de tendance. L'indicateur n'est pas redessiné; un signal d'entrée sur le marché apparaît après la fermeture de la barre. Lorsque vous suivez une tendance, l'indicateur affiche des points d'entrée supplémentaires dans la direction de la te
Auto Order Block with break of structure based on ICT and Smart Money Concepts (SMC) Futures Break of Structure ( BoS )             Order block ( OB )            Higher time frame Order block / Point of Interest ( POI )    shown on current chart           Fair value Gap ( FVG ) / Imbalance   -  MTF      ( Multi Time Frame )    HH/LL/HL/LH  -  MTF      ( Multi Time Frame )  Choch  MTF      ( Multi Time Frame )  Volume Imbalance     ,  MTF          vIMB Gap’s Power of 3 Equal High / Low’s  
Plus de l'auteur
Why Use the WaveTrend Indicator? Here’s why WaveTrend stands out as a must-have tool for traders: Precision Timing for Entries and Exits By highlighting overbought and oversold zones, WaveTrend helps you enter trades at undervalued levels and exit at overvalued peaks, optimizing your risk-to-reward ratio. Clear Trend Confirmation Crossovers provide straightforward signals to confirm whether a trend is starting or ending, reducing uncertainty and boosting decision-making confidence. Early Reve
FREE
Market Trend Levels Detector The Market Trend Levels Detector is an MQL5 indicator designed to help traders visualize dynamic market trends and potential reversal points. It operates by calculating two exponential moving averages (EMAs)—a fast EMA and a slow EMA—to assess the current trend direction. Key features include: Dynamic Trend Fill: The area between the fast and slow EMAs is filled with different colors depending on the market regime. When the fast EMA is above the slow EMA (suggesting
FREE
Swing High/Low & Candle Patterns Indicator is a pivot‐based technical tool that helps traders identify potential turning points in the market (swing highs and swing lows) and automatically detects common candlestick reversal patterns. Below is a detailed overview of how it works and what you can expect: 1. Pivot Detection (Swing Highs and Swing Lows) Core Logic : The indicator uses a user‐defined lookback period ( InpLength ) to determine whether a bar qualifies as a local maximum (pivot high) o
FREE
ADX and DI Indicator
Mohamed Elyes Hantous
ADX and DI Indicator: Your Key to Smarter Trading The ADX and DI Indicator is a must-have tool for traders who want to master trend analysis and make confident, data-driven decisions. Whether you’re trading stocks, forex, commodities, or cryptocurrencies, this indicator delivers clear insights into both the strength and direction of market trends—helping you seize opportunities and avoid costly missteps. Why Choose the ADX and DI Indicator? In fast-paced markets, timing is everything. The ADX a
FREE
Cm Williams Vix
Mohamed Elyes Hantous
CM_Williams_Vix_Fix Indicator Description The CM_Williams_Vix_Fix is a sophisticated, volatility-based technical indicator designed to help traders identify potential market reversals by analyzing the relationship between current price lows and the highest closing prices over a specified period. Drawing inspiration from the Volatility Index (VIX)—often referred to as the "fear index"—and possibly incorporating concepts from trader Larry Williams, this indicator provides a unique perspective on
FREE
Quantum Ladder SPX500
Mohamed Elyes Hantous
Next-Gen E-mini SPX500 DCA Trading Bot: Your Ultimate Wealth Growth Machine Unleash the Power of AI-Driven Trading Introducing the E-mini SPX500 DCA AI Trader , a cutting-edge, fully automated trading algorithm designed to turn small capital into substantial wealth with unmatched risk management and precision. Optimized for the 4-hour timeframe , this bot strategically capitalizes on every market fluctuation, compounding gains while minimizing risk. With a proven track record of growing $1,000
Market Structure Pro
Mohamed Elyes Hantous
Break & Retest Indicator – Precision Market Structure Tool The Break and Retest Indicator is a powerful trading tool designed to help traders spot high-probability break-and-retest setups based purely on support and resistance levels . This indicator automatically identifies when price breaks a significant level and then retests it, providing clear bullish or bearish signals . Key Features: Automated Break & Retest Detection The indicator scans price action in real time to identify valid breakou
Filtrer:
Aucun avis
Répondre à l'avis