Swing Failure Pattern SFP with Fake Break MT4
- Indicateurs
- Eda Kaya
- Version: 1.11
Swing Failure Pattern (SFP) with Fake Break Indicator MT4
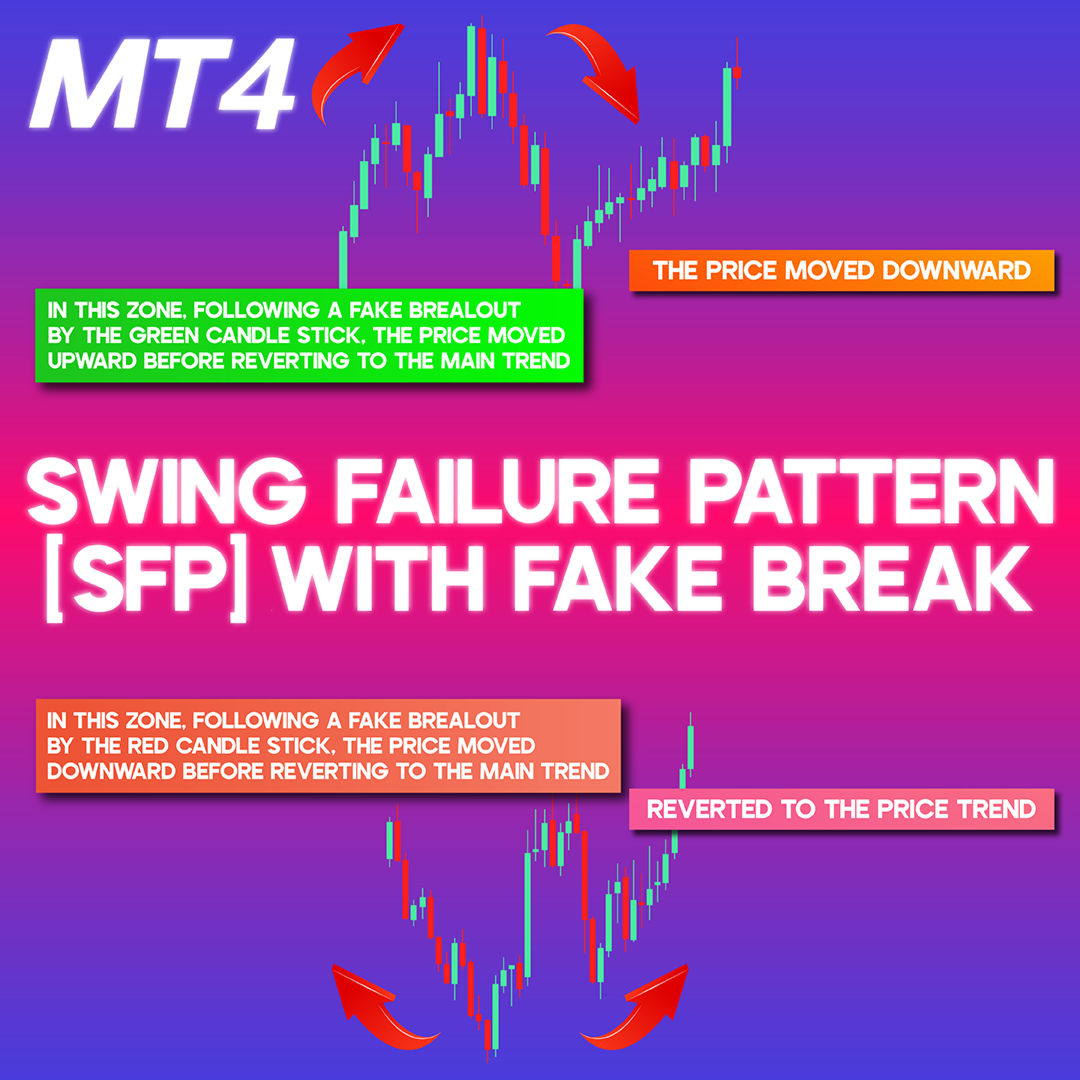
The Swing Failure Pattern (SFP) occurs when the price briefly surpasses a previous high or low but fails to sustain the breakout, triggering liquidity zones and stop-loss orders. Essentially, the price movement beyond the designated level is deceptive (False Breakout Zone) and quickly reverses in the opposite direction. In this indicator, high price levels are displayed in green, while low price levels appear in red.
«Indicator Installation & User Guide»
MT4 Indicator Installation | Swing Failure Pattern SFP with Fake Break MT5 | ALL Products By TradingFinderLab | Best MT4 Indicator: Refined Order Block Indicator for MT4 | Best MT4 Utility: Trade Assistant Expert TF MT4 | TP & SL Tool: Risk Reward Ratio Calculator RRR MT4 | Money Management: Easy Trade Manager MT4
Indicator Specifications
| Category | ICT - Liquidity - Smart Money |
| Platform | MetaTrader 4 |
| Skill Level | Intermediate |
| Indicator Type | Continuation - Reversal |
| Time Frame | Multi Time Frame |
| Trading Style | Intraday Trading |
| Market | Cryptocurrency - Forex - Stocks - Commodities |
Overview of the Indicator
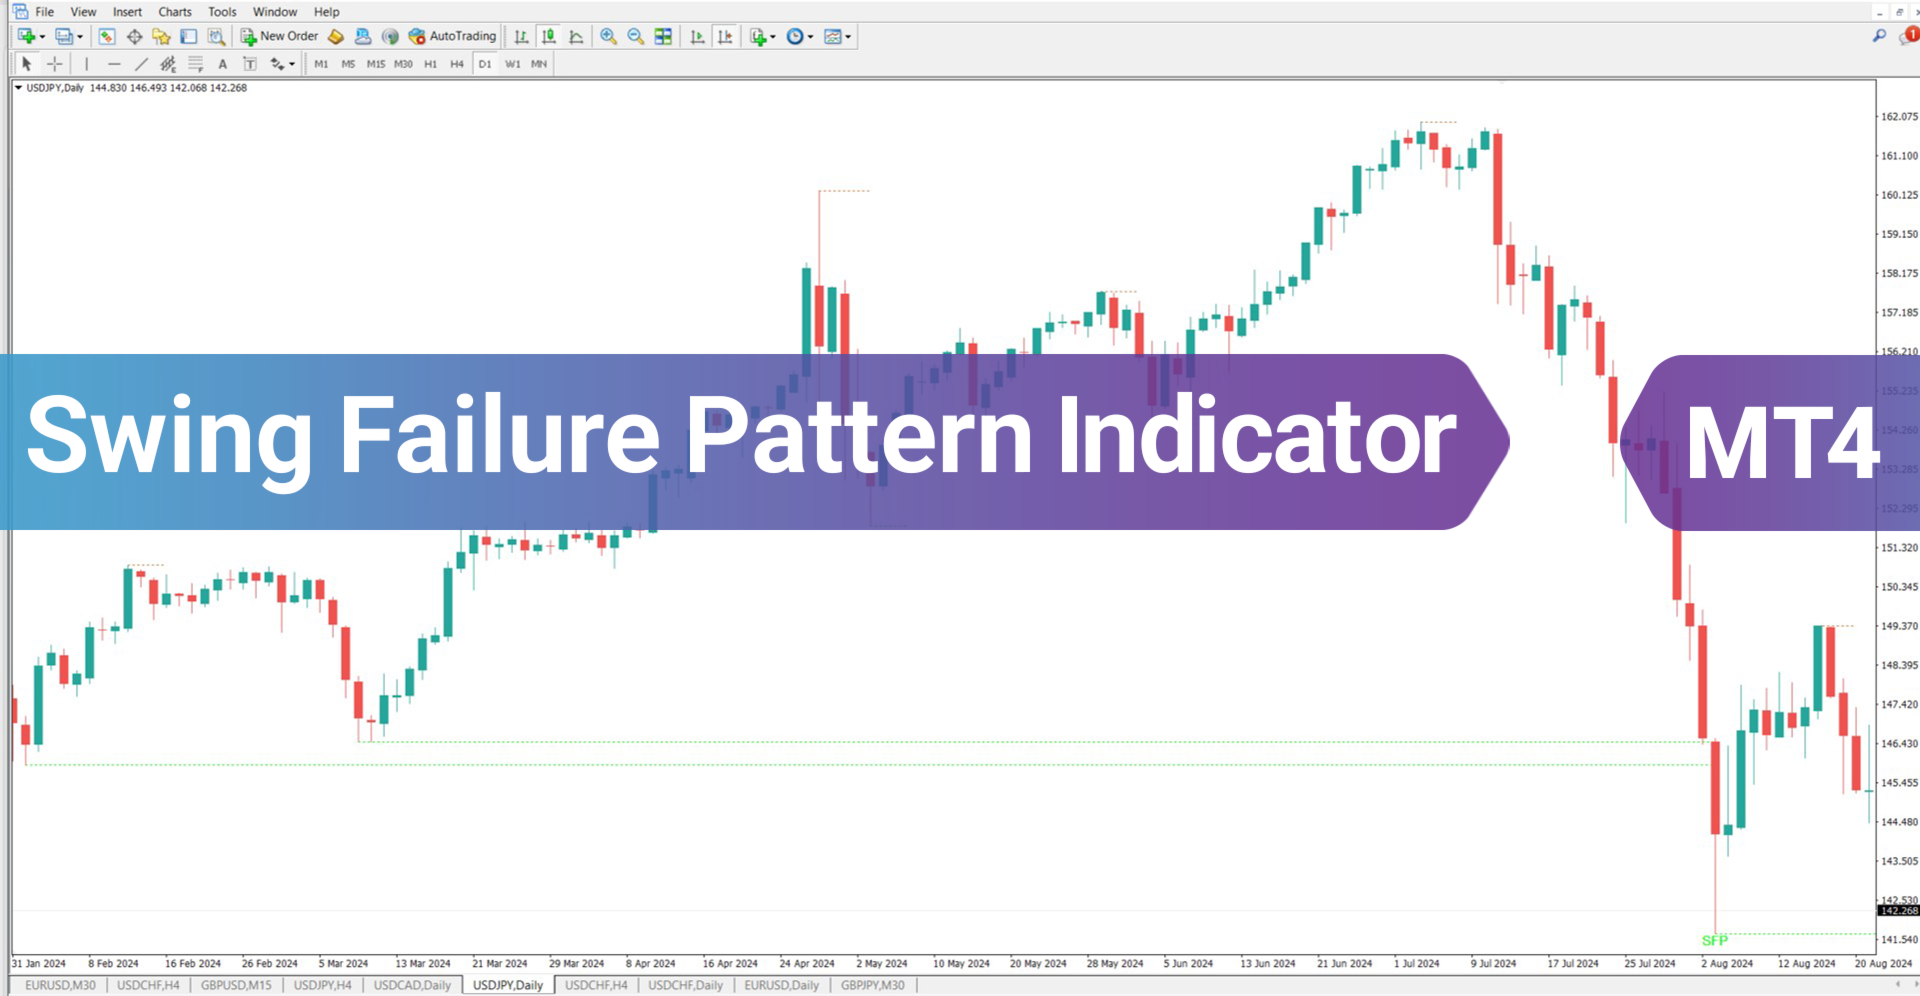
The SFP indicator detects liquidity accumulation zones where stop-loss orders are triggered, leading to a reversal in price direction. This tool automatically spots these areas on the chart, assisting traders in recognizing key market turning points.
Traders following ICT (Inner Circle Trader), Smart Money Concepts, and liquidity-driven strategies can utilize this indicator to enhance their ability to identify potential reversal areas.
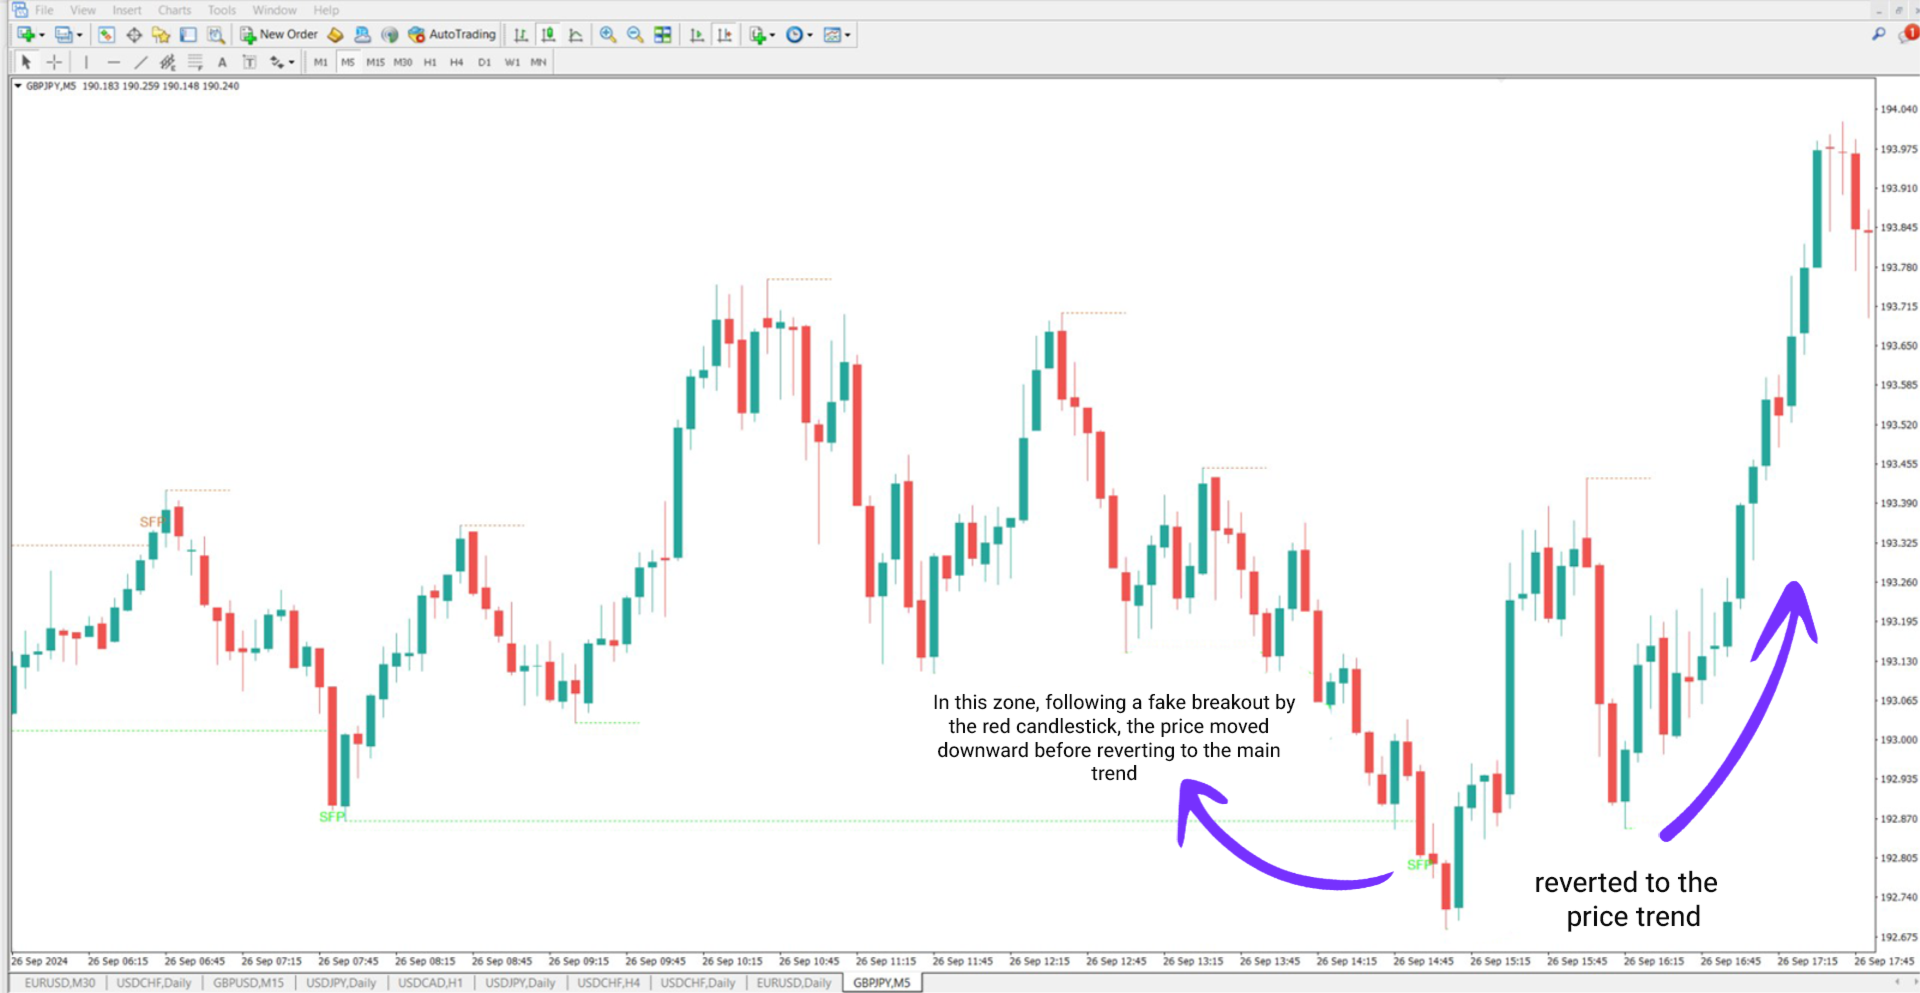
SFP Indicator in an Uptrend
In the GBP/JPY 5-minute chart below, an SFP pattern forms, leading to a temporary downward movement as stop-loss orders are triggered. Once liquidity is collected, the price resumes its upward trajectory.
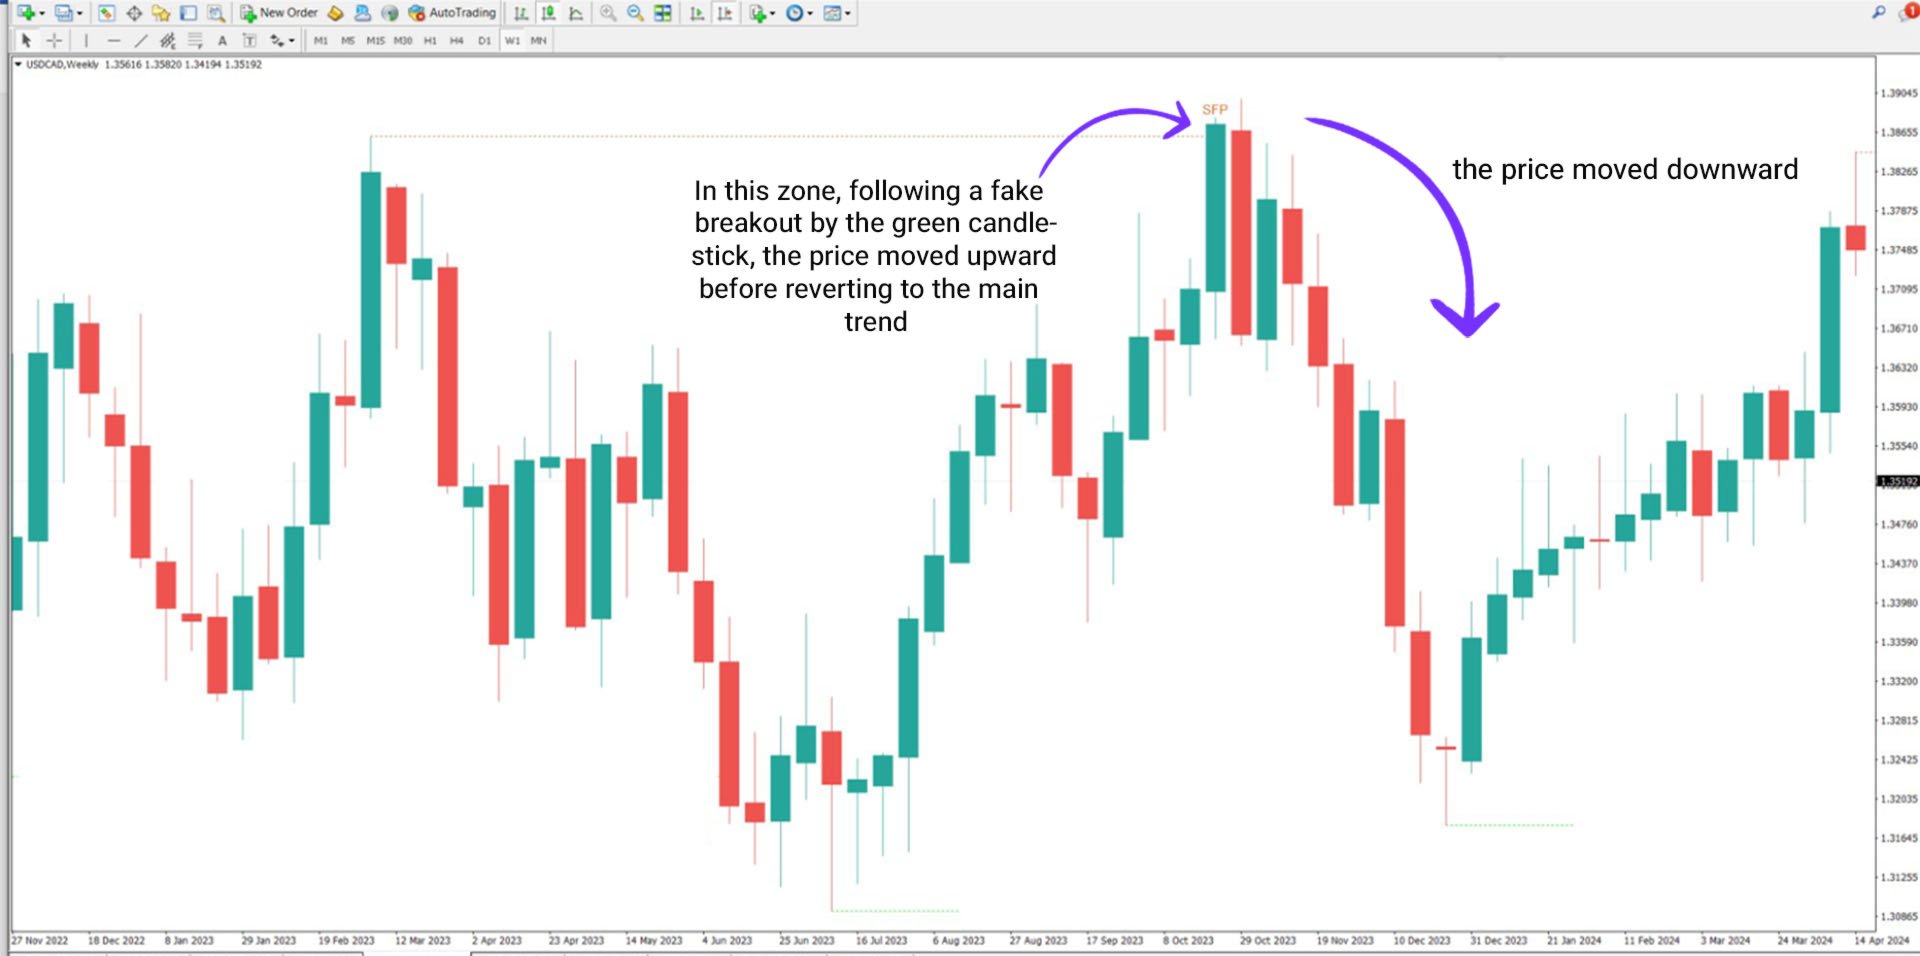
SFP Indicator in a Downtrend
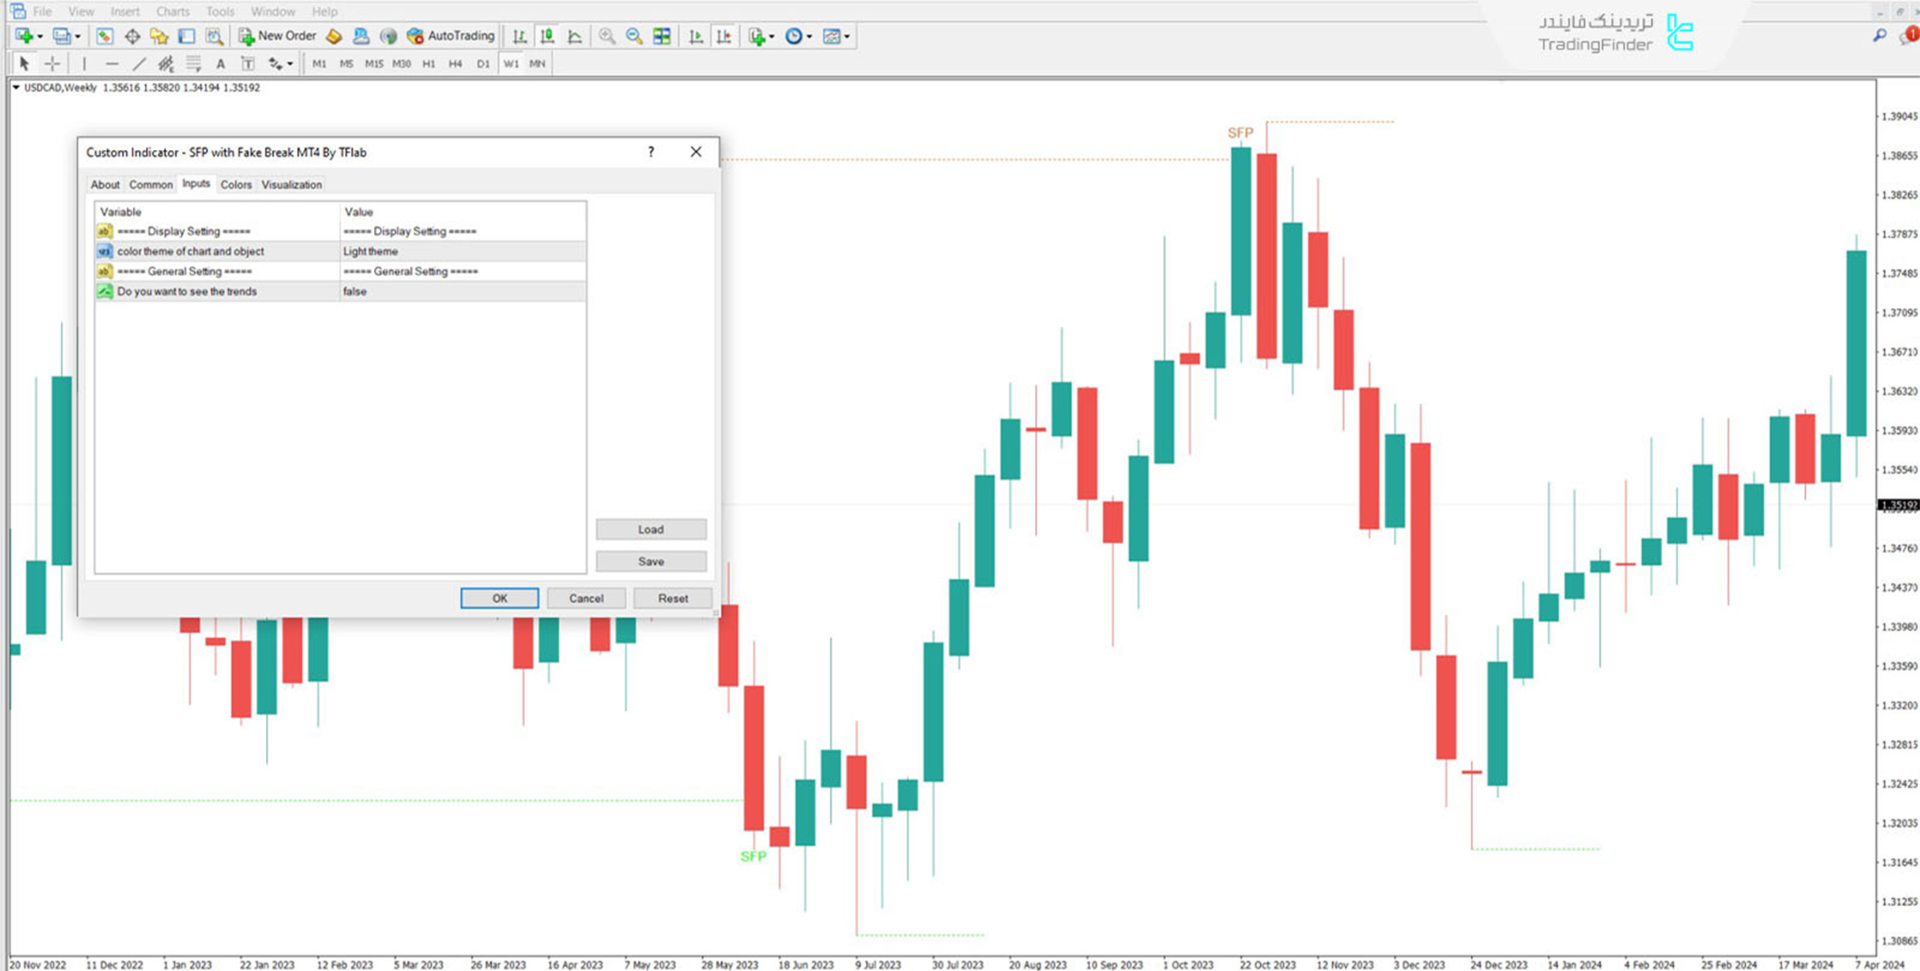
The USD/CAD weekly chart illustrates a scenario where, after reaching a significant peak, an SFP pattern emerges. This false breakout gathers liquidity, facilitating the continuation of the downward trend.
Indicator Settings
- Chart & object color scheme: Adjusts the background and display elements.
- Trend visibility option: Enables or disables trend direction on the chart.
Conclusion
The Swing Failure Pattern (SFP) indicator is a powerful tool for identifying market reversals, helping traders refine their entry and exit strategies. By recognizing false breakouts and analyzing liquidity movements, this indicator enhances decision-making for traders utilizing ICT, Smart Money, and liquidity-based strategies.