• Aperçu
  • Avis
  • Commentaires
  • Nouveautés

SAR Vision MTF

SAR Vision MTF - Multitimeframe Parabolic SAR Indicator for MT5 est un indicateur Parabolic SAR multitimeframe avancé qui vous permet d'afficher les valeurs Parabolic SAR d'horizons temporels supérieurs directement sur le graphique actuel. Cet outil offre aux traders une vision plus claire des tendances à long terme, ce qui aide à une entrée et une sortie de trade plus précises.

🔹 Caractéristiques principales :
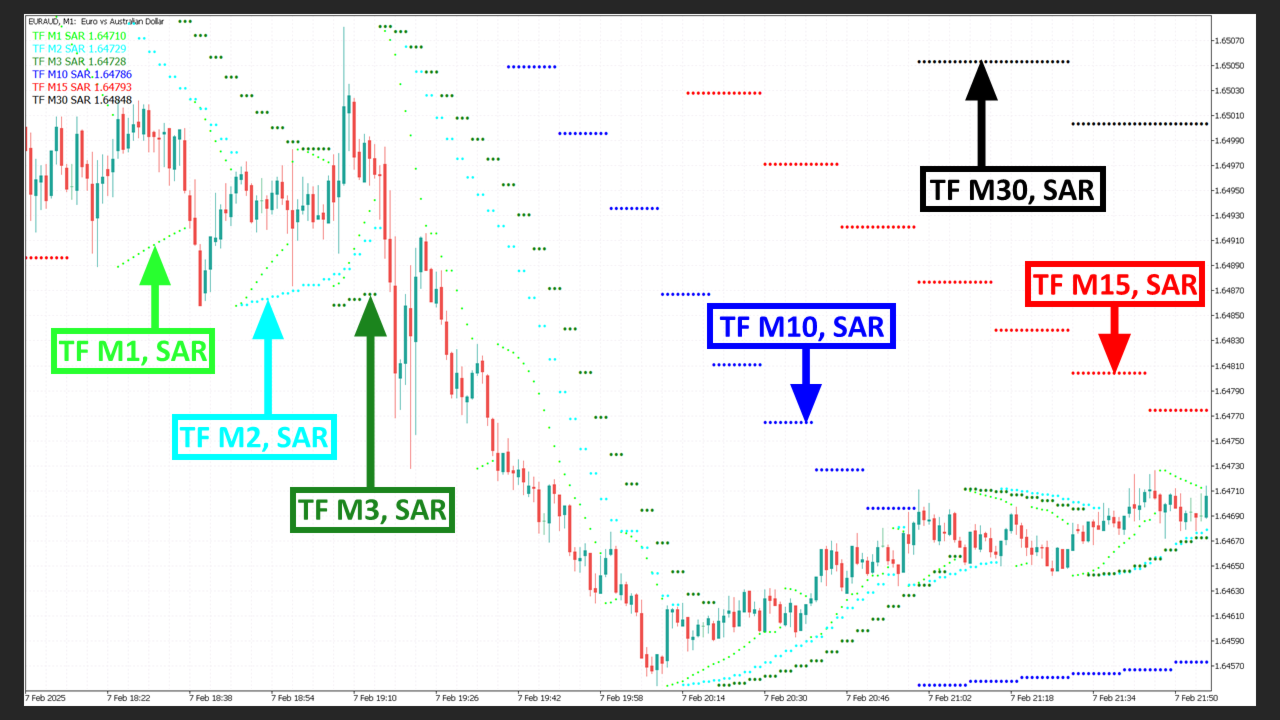
✅ Analyse multitimeframe - suivre les lectures Parabolic SAR des TF supérieurs (M5, M15, H1, H4, etc.) sur les TF inférieurs pour obtenir un contexte de marché plus large.
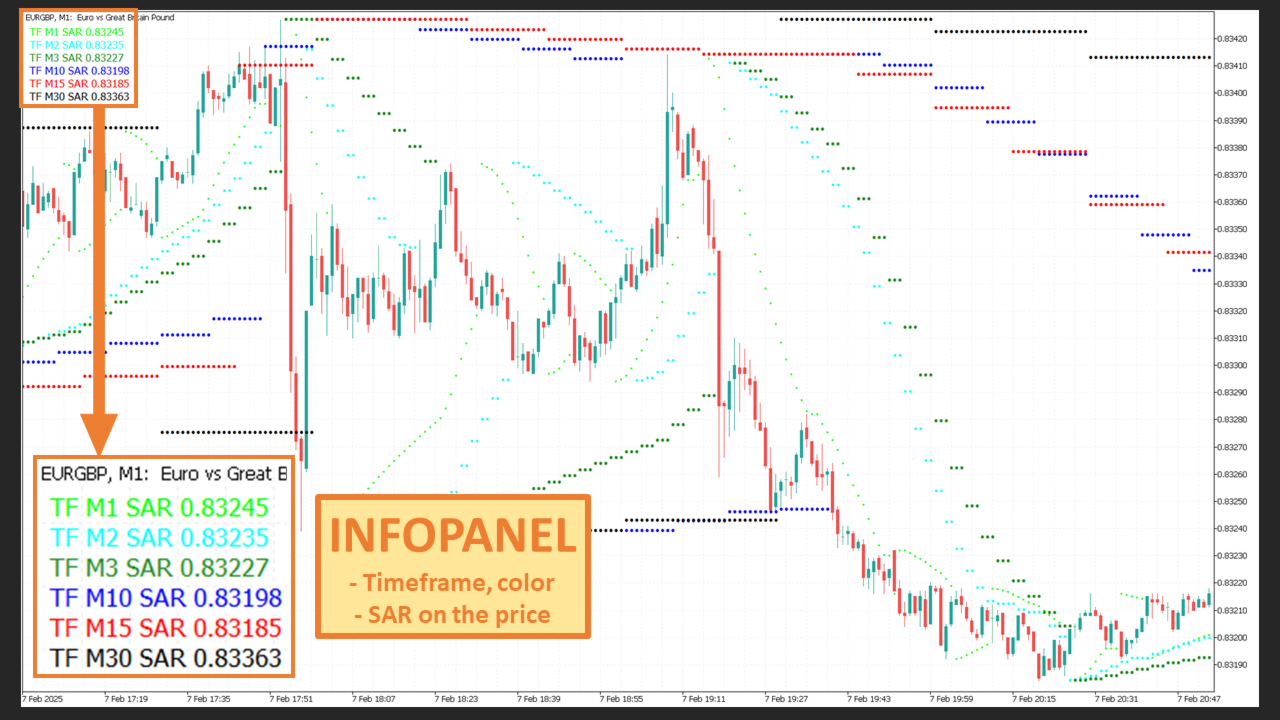
✅ Clarté visuelle - l'affichage des points SAR en différentes couleurs par TF facilite l'identification de la tendance.
✅ Des décisions de trading plus précises - en combinant les valeurs SAR de différentes TF, vous pouvez mieux identifier les tendances et éviter les faux signaux.
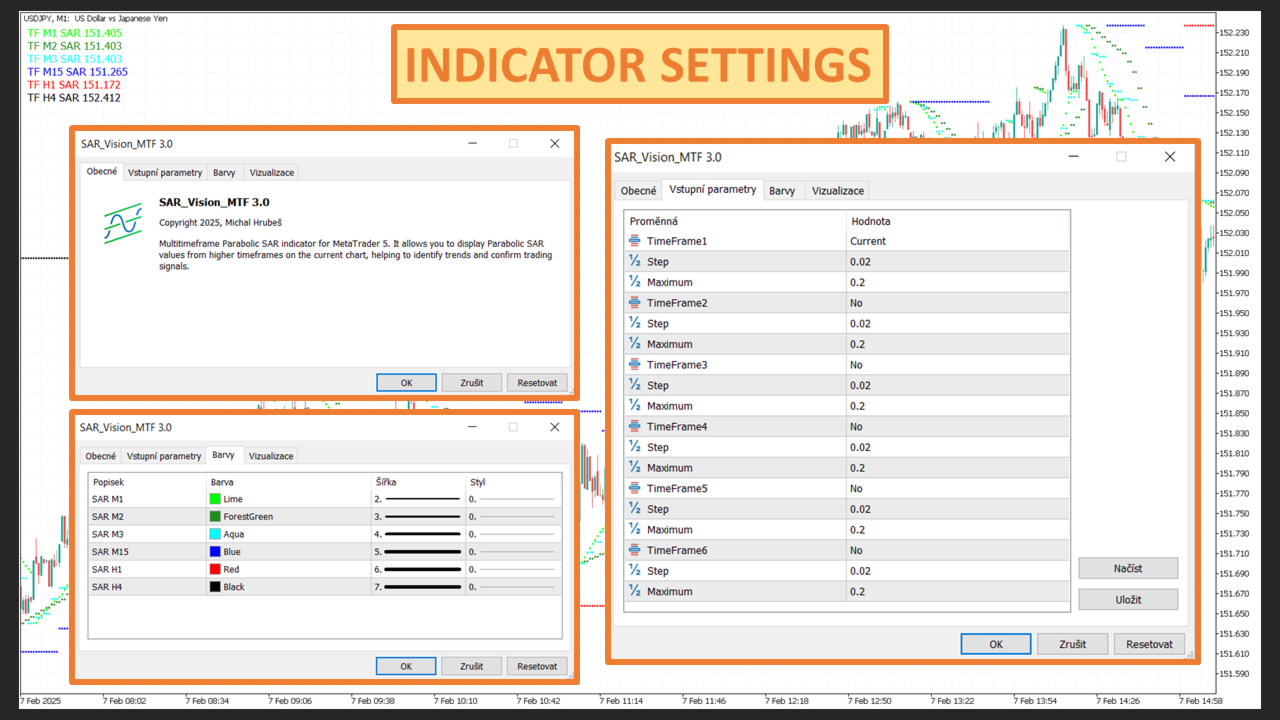
✅ Entièrement personnalisable - ajustez les couleurs, la taille des points et la TF selon vos préférences.
✅ Performance optimisée - fonctionne en douceur sur tous les types de graphiques sans charge inutile sur la plateforme.

🔹 Comment SAR Vision MTF vous aide-t-il ?
📈 Confirmation de tendance - Si le SAR sur un cadre temporel supérieur confirme le signal sur un cadre temporel inférieur, la probabilité d'un trade réussi augmente.
📉 Détecter les points de retournement - Identifier les retournements potentiels du marché avant qu'ils ne soient visibles sur un cadre temporel inférieur.
📊 Prise en charge de tous les styles de trading - Convient au scalping, au trading intrajournalier et au swing trading.

SAR Vision MTF est un outil inestimable pour tout trader qui souhaite améliorer sa stratégie grâce à l'analyse multitimeframe. 🚀


Produits recommandés
This z-score indicator shows the correct z-score of an asset, as it uses the normalized price data for calculation, which is the only correct way. Z-score is only applicable for normal distributed data, therefore not the actual price is considered, but the normalised returns, which were assumed to follow a normal distribution. Returns are mean reverting and assumed to follow a normal distribution, therefore z-score calculation of returns is more reliable than z-score on price, as price is NOT m
White Weis Volume Ticks
Ricardo Almeida Branco
5 (4)
White Weis Volume This indicator shows the sum of the volume in each wave, bulish or bearish, as idealized by David Weis , but it brings an important addition , which is the marking of the bar with the highest volume of the wave (White Bar)! In coding the indicator, it was sought to optimize the code to require minimal processing during use and not to overload mt5. The indicator can be used for pre-trading analysis and study, where the trader analyzes possible points of support and resistance
Máquina Trader Tendência Count on our trend tracker to carry out your operations on the Mini Index and the Mini Dollar!!! Operational Green is BUY and Pink is SELL!!! Enter the operation after closing the first color block!!! Developed and Tested on the 5 or 15 minute Chart for Mini Index and Mini Dollar!!! Can be used on any chart!!! Editable colors and period!!!
This is Gekko's Cutomized Cutomized Average Directional Index (ADX), a customized version of the famous ADX indicator. Use the regular ADX and take advantage two entry signals calculations and different ways of being alerted whenever there is potential entry or exit point. Inputs Period: Period for the ADX calculation; PlotSignalType: How will the indicator calculate entry (swing) signals: 1- ShowSwingsOnTrendLevel : Show Signals for Trend Confirmation Swings; 2- ShowSwingsOnTrendLevelDirection
Value Chart Candlesticks
Flavio Javier Jarabeck
4.73 (11)
The idea of a Value Chart indicator was presented in the very good book I read back in 2020 , " Dynamic Trading Indicators: Winning with Value Charts and Price Action Profile ", from the authors Mark Helweg and David Stendahl. The idea is simple and the result is pure genius: Present candlestick Price analysis in a detrended way! HOW TO READ THIS INDICATOR Look for Overbought and Oversold levels. Of course, you will need to test the settings a lot to find the "correct" one for your approach. It
FREE
Adjustable Consecutive Fractals  looks for 2 or more fractals in one direction and sends out a on screen alert, sound alert and push notification, for strong reversal points . Adjustable Consecutive Fractals, shows the fractals on chart along with a color changing text for buy and sell signals when one or more fractals appear on one side of price. Adjustable Consecutive Fractals is based Bill Williams Fractals . The standard Bill Williams fractals are set at a non adjustable 5 bars, BUT withe th
Simple Vwap with the daily, weekly and monthly VWAP is the abbreviation for   volume-weighted average price , which is a technical analysis tool that shows the ratio of an asset's price to its total trade volume. It provides traders and investors with a measure of the average price at which a stock is traded over a given period of time. How it's used Identify entry and exit points:   Traders can use VWAP to determine when to buy or sell an asset.   Understand price trends :  Traders can use V
FREE
Weis Wave Double Side
Eduardo Da Costa Custodio Santos
L'indicateur latéral Weis Wave Bouble pour MT5 fait partie de la boîte à outils (Wyckoff Academy Wave Market) L'indicateur latéral Weis Wave Bouble pour MT5 a été créé sur la base de la Weis Wave déjà établie créée par David Weis. L'indicateur Weis Wave Double Side lit le marché par vagues comme cela a été fait par R. Wyckoff en 1900. Il aide à identifier l'effort x le résultat, la cause et l'effet, et l'offre et la demande Son différentiel est qu'il peut être utilisé en dessous de l'axe zéro, a
Wapv Price and volume
Eduardo Da Costa Custodio Santos
L'indicateur de prix et de volume WAPV pour MT5 fait partie de l'ensemble d'outils (Wyckoff Academy Wave Market) et (Wyckoff Academy Price and Volume). L'indicateur de prix et de volume WAPV pour MT5 a été créé pour faciliter la visualisation intuitive du mouvement du volume sur le graphique. Avec lui, vous pouvez observer les moments de pic de volume et les moments où le marché n'a aucun intérêt professionnel Identifiez les moments où le marché évolue par inertie et non par mouvement de "smart
This indicator sums up the difference between the sells aggression and the buys aggression that occurred in each Candle, graphically plotting the waves of accumulation of the aggression volumes.   Through these waves an exponential average is calculated that indicates the direction of the business flow. Note: This indicator DOES NOT WORK for Brokers and/or Markets WITHOUT the type of aggression (BUY or SELL).   Be sure to try our Professional version with configurable features and alerts:  Agre
FREE
L'indicateur vous permet de déterminer la direction actuelle des prix et la volatilité du marché. Cette version du Traders Dynamic Index a supprimé le redessinage des données historiques, la vitesse de calcul de l'algorithme optimisée, plus de paramètres externes pour des ajustements plus précis, et ses fonctionnalités étendues : ajout de la sélection de l'oscillateur initial et des méthodes de lissage des moyennes . Paramètres: Mode Osc - estimation sélection de l'oscillateur Period Osc - la pé
Intraday Vwap Orion
Joao Paulo Botelho Silva
Theory VWAP is a volume-weighted moving average, bringing greater relevance to prices. The VWAP base calculation follows the classic formula described in Investopedia ( https://www.investopedia.com/terms/v/vwap.asp ). VWAP = sum(typical price[i]*volume[i]) / sum(volume[i]) Functionalities Orion Intraday VWAP innovates by allowing the user to choose between the conventional Daily, Weekly and Monthly periods, also having the option of calculating the Intraday indicator, as used in other platform
Was: $249  Now: $149   Market Profile defines a number of day types that can help the trader to determine market behaviour. A key feature is the Value Area, representing the range of price action where 70% of trading took place. Understanding the Value Area can give traders valuable insight into market direction and establish the higher odds trade. It is an excellent addition to any system you may be using. Inspired by Jim Dalton’s book “Mind Over Markets”, this indicator is designed to suit the
VWAP Bands
Rafael Caetano Pinto
This indicator uses VWAP and projects this VWAP into up to 3 levels, shifted by a percentage of the chart's symbol. How to configure: Choose the symbol and desired graphic time Set the start time of the symbol (in bovespa, WIN and WDO start at 9 o'clock). This time is used as the cutoff reference for VWAP. Check which VWAP period fits the chart better: Ideally, a period when VWAP is not too distant from the chart Set percentage levels: Ideally, you should set levels based on history, so that le
Do you use volume in your reading of the market? Certainly many traders use it, and do not imagine operating without it. The Color Histogram Volume Set indicator allows the user to choose the value that he considers interesting to monitor. When you pass this you will have visual confirmation and if you want you will also have the audible alert that is given by the indicator. Of course, there are other ways to try to find a high volume, such as assessing whether the volume is above av
The indicator highlights the points that a professional trader sees in ordinary indicators. VisualVol visually displays different volatility indicators on a single scale and a common align. Highlights the excess of volume indicators in color. At the same time, Tick and Real Volume, Actual range, ATR, candle size and return (open-close difference) can be displayed. Thanks to VisualVol, you will see the market periods and the right time for different trading operations. This version is intended f
FREE
Volume Waves
Paulo Henrique Faquineli Garcia
One of the best tools for analyzing volume, Weis Wave was devised by David Weis to facilitate reading the directional flow. For the disciples of the Wyckoff method, this means an evolution, facilitating a predictive reading of the market, always looking for Accumulation and Distribution zones for traded assets. For better understanding, in this indicator we try to cover every reading of EFFORT (traded volume) versus RESULT (price change). Thus, you can apply the indicator on the chart twice to
RAD CRITICAL LEVES RAD indicator tracks “Relevant Volume” in real time, identifying accumulation and distribution processes, projecting them in the chart as SUPPORT or RESISTANCE zones. Natural   support   and resistance levels are generated by Volume Accumulation and Distribution processes. As these processes evolve, levels at which the relevant volume in the market place is positioned, become difficult areas to cross upwards or downwards. By using this information, traders can identify very s
Best SAR MT5
Ashkan Hazegh Nikrou
4.33 (3)
La description :  nous sommes heureux de vous présenter notre nouvel indicateur gratuit basé sur l'un des indicateurs professionnels et populaires du marché des changes (PSAR). Cet indicateur est une nouvelle modification de l'indicateur SAR parabolique original. Dans l'indicateur pro SAR, vous pouvez voir un croisement entre les points et le graphique des prix. le croisement n'est pas un signal mais parle du potentiel de fin de mouvement, vous pouvez commencer à acheter par un nouveau point b
FREE
VWAP Trend
Driller Capital Management UG
Bienvenue chers traders, Nous proposons à la vente un indicateur Volume Weighted Average Price (VWAP) . L'indicateur est programmé pour être facilement utilisable. Il vous suffit de le glisser sur le graphique, et l'algorithme s'occupe du reste. En fonction de la période de temps sélectionnée, les lignes de prix moyens pondérés par le volume sont calculées automatiquement. Contrairement à d'autres indicateurs VWAP, notre indicateur permet également de calculer pour des intervalles de temps plus
This Indicator adding power to traditional zigzag indicator. With High-Low numbers in vision it will be easier to estimate change of trend by knowing the depth of each wave. Information including points, pips, percentage%, and #bars can be displayed based on configuration. All information is real-time update. This indicator is especially useful in sideway market to buy low sell high.
Profile Map MT5
Dmitriy Sapegin
5 (5)
Market Profile helps the trader to identify the behavior if major market players and define zones of their interest. The key feature is the clear graphical display of the range of price action, in which 70% of the trades were performed. Understanding of the location of volume accumulation areas can help traders increase the probability of success. The tool can be used as an independent system as well as in combination with other indicators and trading systems. this indicator is designed to suit
Start Vwap Custom Midas
Ricardo Almeida Branco
5 (3)
Attention: New update - 4 major practicality improvements! 1) Alarm 2) Midas text value 3) Click panel 4) Can be connected to an EA to operate in semi-automatic mode Attention - This indicator does not work perfectly in backtest due to MT5 peculiarities (Reading hotkeys or panel clicks) . My suggestion is that you test Automatic Vwap Midas which has automatic operation to analyze the calculation and then buy Start if you think the indicator will match your operating.     This indicator is use
Blahtech VWAP MT5
Blahtech Limited
5 (1)
Was: $69  Now: $49   Blahtech VWAP - Volume Weighted Average Price (VWAP) is the ratio of price to total volume. It provides an average price over a specified time interval.  Links [  Install  |  Update  |  Documentation   ] Feature Highlights Configurable VWAP Line Sessions, intervals, anchored or continuous Previous day settlement line Standard Deviation bands Alerts at bar close or real time Automatic Broker or Tick volumes Significantly reduced CPU usage Input Parameters Expert Advisor Mo
To download MT4 version please click here . - This is the exact conversion from TradingView: "Trend Direction Force Index - TDFI [wm]" By "causecelebre". - The screenshot shows similar results from tradingview and Metatrader when tested on ICMarkets on both platforms. - This indicator uses multiple levels of averaging to detect trend strength. - You can optimize filter low and filter high levels to achieve best results. - You have access to buffers to use in EAs. - This is a light-load processin
Market Marker MT5
Evgeny Shevtsov
3.8 (5)
The indicator displays peak levels of activity formed by the maximum volume, tracks the correlation of the candles on all timeframes (from the highest to the lowest one). Each volume level is a kind of key trading activity. The most important cluster is inside a month, week, day, hour, etc. Indicator operation features A volume level receives Demand status if the nearest volume level located to the left and above has been broken upwards. A volume level receives Supply status if the nearest volu
VWAP Indicator
LUC JACOBUS A VERHEECKE
4.13 (23)
Volume Weighted Average Price (VWAP) The volume weighted average price (VWAP) is a  trading   benchmark  used by traders that gives the average price a security has traded at throughout the day, based on both volume and price. It is important because it provides traders with insight into both the trend and value of a security. This indicator VWAP V2 is free and is the manual version of the extended Easy VWAP indicator (30 Euro), where the date and time properties are automatically entered. With
FREE
Follow The Line MT5
Oliver Gideon Amofa Appiah
4.55 (31)
This indicator obeys the popular maxim that: "THE TREND IS YOUR FRIEND" It paints a GREEN line for BUY and also paints a RED line for SELL. (you can change the colors). It gives alarms and alerts of all kinds. IT DOES NOT REPAINT and can be used for all currency pairs and timeframes. Yes, as easy and simple as that. Even a newbie can use it to make great and reliable trades. NB: For best results, get my other premium indicators for more powerful and reliable signals. Get them here: https://www.m
FREE
Weis Waves
Flavio Javier Jarabeck
2.83 (18)
The original author is David Weis, an expert in the Wyckoff Method. The Weis Wave is a modern adaptation of the 1930's Wyckoff Method, another expert in Tape Reading techniques and Chart Analysis. Weis Waves takes market volume and stacks it into waves according to price conditions giving the trader valuable insights about the market conditions. If you want to learn more about this subject you can find tons of videos in YouTube. Just look for "The Wickoff Method", "Weis Wave" and "Volume Spread
FREE
Weis Wave Double Side Alert
Eduardo Da Costa Custodio Santos
L'indicateur latéral Weis Wave Bouble pour MT5 fait partie de la boîte à outils (Wyckoff Academy Wave Market) L'indicateur latéral Weis Wave Bouble pour MT5 a été créé sur la base de la Weis Wave déjà établie créée par David Weis. L'indicateur Weis Wave Double Side lit le marché par vagues comme R. Wyckoff l'a fait en 1900. Il aide à identifier l'effort x le résultat, la cause et l'effet, et l'offre et la demande Son différentiel est qu'il peut être utilisé en dessous de l'axe zéro et dispose d'
Les acheteurs de ce produit ont également acheté
Trend Screener Pro MT5
STE S.S.COMPANY
4.89 (72)
Indicateur de tendance, solution unique révolutionnaire pour le trading et le filtrage des tendances avec toutes les fonctionnalités de tendance importantes intégrées dans un seul outil ! Il s'agit d'un indicateur multi-période et multi-devises 100 % non repeint qui peut être utilisé sur tous les symboles/instruments : forex, matières premières, crypto-monnaies, indices et actions. Trend Screener est un indicateur de suivi de tendance efficace qui fournit des signaux de tendance fléchés avec des
FX Volume MT5
Daniel Stein
4.72 (18)
FX Volume : Découvrez le Sentiment du Marché tel que perçu par un Courtier Présentation Rapide Vous souhaitez faire passer votre approche de trading au niveau supérieur ? FX Volume vous fournit, en temps réel, des informations sur la manière dont les traders particuliers et les courtiers sont positionnés—bien avant la publication de rapports retardés comme le COT. Que vous visiez des gains réguliers ou recherchiez simplement un avantage plus solide sur les marchés, FX Volume vous aide à repére
Golden Trend Indicator MT5
Noha Mohamed Fathy Younes Badr
4.86 (14)
Golden Trend indicator  is The best indicator for predicting trend movement this indicator never lags and never repaints and never back paints    and give  arrow buy and sell    before the candle appear  and it will help you and  will make your trading decisions clearer its work on all currencies and  gold and crypto and all time frame This unique  indicator uses very secret algorithms to catch the  trends, so you can trade using this indicator and see the trend clear on charts  manual guide and
FX Power MT5 NG
Daniel Stein
5 (10)
FX Power : Analysez la force des devises pour des décisions de trading plus intelligentes Aperçu FX Power est l'outil essentiel pour comprendre la force réelle des principales devises et de l'or, quelles que soient les conditions du marché. En identifiant les devises fortes à acheter et les faibles à vendre, FX Power simplifie vos décisions de trading et révèle des opportunités à forte probabilité. Que vous suiviez les tendances ou anticipiez les retournements à l'aide de valeurs extrêmes de D
IX Power MT5
Daniel Stein
4.83 (6)
IX Power : Découvrez des insights de marché pour les indices, matières premières, cryptomonnaies et forex Vue d’ensemble IX Power est un outil polyvalent conçu pour analyser la force des indices, matières premières, cryptomonnaies et symboles forex. Tandis que FX Power offre une précision maximale pour les paires de devises en utilisant toutes les données disponibles, IX Power se concentre exclusivement sur les données du symbole sous-jacent. Cela fait de IX Power un excellent choix pour les m
FX Levels MT5
Daniel Stein
5 (2)
FX Levels : Des zones de Support et Résistance d’une Précision Exceptionnelle pour Tous les Marchés Présentation Rapide Vous recherchez un moyen fiable pour déterminer des niveaux de support et résistance dans n’importe quel marché—paires de devises, indices, actions ou matières premières ? FX Levels associe la méthode traditionnelle « Lighthouse » à une approche dynamique de pointe, offrant une précision quasi universelle. Grâce à notre expérience réelle avec des brokers et à des mises à jour
TPSpro RFI Levels MT5
Roman Podpora
4.53 (19)
INSTRUCTIONS       RUS   -   ANGLAIS       Il   est recommandé de l'utiliser avec un indicateur       -       TPSpro   TENDANCE PRO -   Version MT4         Bonus: 6 months of  "RFI SIGNALS"  subscription with your purchase! Un élément clé du trading est constitué par les zones ou les niveaux à partir desquels les décisions d'achat ou de vente d'un instrument de trading sont prises. Malgré les tentatives des principaux acteurs de dissimuler leur présence sur le marché, ils laissent inévitable
TPSproTREND PrO MT5
Roman Podpora
4.47 (17)
TPSpro TREND PRO  - is a trend indicator that automatically analyzes the market and provides information about the trend and each of its changes, as well as giving signals for entering trades without redrawing! The indicator uses each candle, analyzing them separately. referring to different impulses - up or down impulse. Exact entry points into transactions for currencies, crypto, metals, stocks, indices!  ИНСТРУКЦИЯ RUS         INSTRUCTIONS  ENG       R ecommended to use with an indicator   -
Quantum TrendPulse
Bogdan Ion Puscasu
5 (12)
Présentation de   Quantum TrendPulse   , l'outil de trading ultime qui combine la puissance de   SuperTrend   ,   RSI   et   Stochastic   dans un seul indicateur complet pour maximiser votre potentiel de trading. Conçu pour les traders qui recherchent précision et efficacité, cet indicateur vous aide à identifier les tendances du marché, les changements de dynamique et les points d'entrée et de sortie optimaux en toute confiance. Caractéristiques principales : Intégration SuperTrend :   suivez f
Support And Resistance Screener est dans un indicateur de niveau pour MetaTrader qui fournit plusieurs outils à l'intérieur d'un indicateur. Les outils disponibles sont : 1. Filtre de structure de marché. 2. Zone de repli haussier. 3. Zone de recul baissier. 4. Points pivots quotidiens 5. points pivots hebdomadaires 6. Points pivots mensuels 7. Support et résistance forts basés sur le modèle harmonique et le volume. 8. Zones au niveau de la banque. OFFRE D'UNE DURÉE LIMITÉE : L'indicateur de sup
RelicusRoad Pro MT5
Relicus LLC
4.78 (18)
Maintenant 147 $ (augmentant à 499 $ après quelques mises à jour) - Comptes illimités (PCS ou Mac) Manuel d'utilisation RelicusRoad + Vidéos de formation + Accès au groupe Discord privé + Statut VIP UNE NOUVELLE FAÇON DE REGARDER LE MARCHÉ RelicusRoad est l'indicateur de trading le plus puissant au monde pour le forex, les contrats à terme, les crypto-monnaies, les actions et les indices, offrant aux traders toutes les informations et tous les outils dont ils ont besoin pour rester rentables
Gold Stuff mt5
Vasiliy Strukov
4.92 (173)
Gold Stuff mt5 est un indicateur de tendance conçu spécifiquement pour l'or et peut également être utilisé sur n'importe quel instrument financier. L'indicateur ne se redessine pas et ne traîne pas. Délai recommandé H1. Contactez-moi immédiatement après l'achat pour obtenir les réglages et un bonus personnel !   Vous pouvez obtenir une copie gratuite de notre indicateur Strong Support et Trend Scanner, veuillez envoyer un message privé. moi!   RÉGLAGES Dessiner la flèche - on off. dessiner d
Bill Williams Advanced
Siarhei Vashchylka
5 (10)
Bill Williams Advanced is designed for automatic chart analysis using Bill Williams' "Profitunity" system. The indicator analyzes four timeframes at once. Manual (Be sure to read before purchasing) Advantages 1. Automatically analyzes the chart using the "Profitunity" system of Bill Williams. The found signals are placed in a table in the corner of the screen. 2. Equipped with a trend filter based on the Alligator indicator. Most of the system signals are recommended to be used only according t
Ce tableau de bord affiche les derniers   modèles harmoniques   disponibles pour les symboles sélectionnés, ce qui vous permettra de gagner du temps et d'être plus efficace /   version MT4 . Indicateur gratuit:   Basic Harmonic Pattern Colonnes de l'indicateur Symbol :   les symboles sélectionnés apparaissent Trend   :   haussière ou baissière Pattern :   type de motif (gartley, papillon, chauve-souris, crabe, requin, cypher ou ABCD) Entry:   prix d'entrée SL:   prix du stop loss TP1:   1er
Matrix Arrow Indicator MT5
Juvenille Emperor Limited
5 (13)
Matrix Arrow Indicator MT5   est une tendance unique 10 en 1 suivant un indicateur multi-période   100% non repeint   qui peut être utilisé sur tous les symboles/instruments:   forex ,   matières premières ,   crypto-monnaies ,   indices ,  actions .  Matrix Arrow Indicator MT5  déterminera la tendance actuelle à ses débuts, en rassemblant des informations et des données à partir d'un maximum de 10 indicateurs standard, qui sont: Indice de mouvement directionnel moyen (ADX) Indice de canal de m
Tout d'abord, il convient de souligner que cet outil de trading est un indicateur non repeint, non redessiné et non retardé, ce qui le rend idéal pour le trading professionnel. Cours en ligne, manuel utilisateur et démonstration. L'indicateur Smart Price Action Concepts est un outil très puissant à la fois pour les nouveaux et les traders expérimentés. Il regroupe plus de 20 indicateurs utiles en un seul, combinant des idées de trading avancées telles que l'analyse du trader Inner Circle et le
FX Dynamic : Suivez la volatilité et les tendances grâce à une analyse ATR personnalisable Vue d’ensemble FX Dynamic est un outil performant s’appuyant sur les calculs de l’Average True Range (ATR) pour fournir aux traders des informations incomparables sur la volatilité quotidienne et intrajournalière. En définissant des seuils de volatilité clairs — par exemple 80 %, 100 % et 130 % — vous pouvez rapidement repérer des opportunités de profit ou recevoir des avertissements lorsque le marché dé
Présentation       Quantum Breakout PRO   , l'indicateur révolutionnaire MQL5 qui transforme la façon dont vous négociez les zones d'évasion ! Développé par une équipe de traders expérimentés avec une expérience commerciale de plus de 13 ans,       Évasion quantique PRO       est conçu pour propulser votre parcours commercial vers de nouveaux sommets grâce à sa stratégie de zone de discussion innovante et dynamique. Quantum Breakout Indicator vous donnera des flèches de signalisation sur les z
Top indicator for MT5   providing accurate signals to enter a trade without repainting! It can be applied to any financial assets:   forex, cryptocurrencies, metals, stocks, indices .  Watch  the video  (6:22) with an example of processing only one signal that paid off the indicator! MT4 version is here It will provide pretty accurate trading signals and tell you when it's best to open a trade and close it. Most traders improve their trading results during the first trading week with the help of
Tout d'abord, il convient de souligner que ce système de trading est un indicateur non repeint, non redessiné et non retardé, ce qui le rend idéal pour le trading manuel et automatisé. Cours en ligne, manuel et téléchargement de préréglages. Le "Système de Trading Smart Trend MT5" est une solution de trading complète conçue pour les traders débutants et expérimentés. Il combine plus de 10 indicateurs premium et propose plus de 7 stratégies de trading robustes, ce qui en fait un choix polyvalent
Easy Breakout MT5
Mohamed Hassan
5 (3)
After your purchase, feel free to contact me for more details on how to receive a bonus indicator called VFI, which pairs perfectly with Easy Breakout for enhanced confluence!     Easy Breakout MT5   is a powerful price action trading system built on one of the most popular and widely trusted strategies among traders: the   Breakout strategy ! This indicator delivers crystal-clear Buy and Sell signals based on breakouts from key support and resistance zones. Unlike typical breakout indicators
Gartley Hunter Multi
Siarhei Vashchylka
5 (10)
Gartley Hunter Multi - An indicator for searching for harmonic patterns simultaneously on dozens of trading instruments and on all possible timeframes. Manual (Be sure to read before purchasing) | Version for MT4 Advantages 1. Patterns: Gartley, Butterfly, Shark, Crab. Bat, Alternate Bat, Deep Crab, Cypher 2. Simultaneous search for patterns on dozens of trading instruments and on all possible timeframes 3. Search for patterns of all possible sizes. From the smallest to the largest 4. All fou
Trend Line Map Pro MT5
STE S.S.COMPANY
4.09 (11)
Trend Line Map indicator is an addons for   Trend Screener Indicator . It's working as a scanner for all signals generated by Trend screener ( Trend Line Signals ) . It's a Trend Line Scanner based on Trend Screener Indicator.  If you don't have Trend Screener Pro Indicator,   the Trend Line Map Pro will not work.     LIMITED TIME OFFER : Trend Line Map Indicator is available for only 50 $ and lifetime. ( Original price 125$ ) By accessing to our MQL5 Blog,  you can find all our premium indicat
Trade smarter, not harder: Empower your trading with Harmonacci Patterns Special Offer: Purchase now to receive free bonuses worth $165! (Read more for details) This is arguably the most complete harmonic price formation auto-recognition indicator you can find for the MetaTrader Platform. It detects 19 different patterns, takes fibonacci projections as seriously as you do, displays the Potential Reversal Zone (PRZ) and finds suitable stop-loss and take-profit levels. [ Installation Guide | Upd
Ce tableau de bord découvre et affiche les zones   d'offre   et de   demande   sur le graphique, à la fois en mode scalping et à long terme, en fonction de votre stratégie de trading pour les symboles sélectionnés. En outre, le mode scanner du tableau de bord vous permet de vérifier tous les symboles souhaités en un coup d'œil et de ne manquer aucune position appropriée /   Version MT4 Indicateur gratuit:   Basic Supply Demand Caractéristiques Permet de visualiser les opportunités de tradin
QM Pattern Scanner MT5
Reza Aghajanpour
5 (3)
Contact me  to send you instruction and add you in group. QM (Quasimodo) Pattern is based on Read The Market(RTM) concepts. The purpose of this model is to face the big players of the market (financial institutions and banks), As you know in financial markets, big traders try to fool small traders, but RTM prevent traders from getting trapped. This style is formed in terms of price candles and presented according to market supply and demand areas and no price oscillator is used in it. RTM conc
Volumatic VIDyA MT5
Duc Hoan Nguyen
5 (1)
Special offer : ALL TOOLS , just $35 each! New tools   will be   $30   for the   first week   or the   first 3 purchases !  Trading Tools Channel on MQL5 : Join my MQL5 channel to update the latest news from me Volumatic VIDYA (Variable Index Dynamic Average) est un indicateur avancé conçu pour suivre les tendances et analyser la pression d'achat et de vente à chaque phase d'une tendance. En utilisant la Moyenne Dynamique à Indice Variable (Variable Index Dynamic Average) comme technique centra
Auto Order Block with break of structure based on ICT and Smart Money Concepts (SMC) Futures Break of Structure ( BoS )             Order block ( OB )            Higher time frame Order block / Point of Interest ( POI )    shown on current chart           Fair value Gap ( FVG ) / Imbalance   -  MTF      ( Multi Time Frame )    HH/LL/HL/LH  -  MTF      ( Multi Time Frame )  Choch  MTF      ( Multi Time Frame )  Volume Imbalance     ,  MTF          vIMB Gap’s Power of 3 Equal High / Low’s  
Dark Absolute Trend   is an Indicator for intraday trading. This Indicator is based on   Trend Following  strategy but use also candlestick patterns and Volatility. We can enter in good price with this Indicator, in order to follow the main trend on the current instrument. It is advised to use low spread ECN brokers. This Indicator does   Not repaint   and   N ot lag . Recommended timeframes are M5, M15 and H1. Recommended working pairs: All. I nstallation and  Update Guide   -  Troubleshooting
CONTACT US  after purchase to get the Indicator Manual. Try Now—Limited 50% Discount for First 10 Buyers! Download the  Metatrader 4 Version Due to regulatory restrictions, our service is unavailable in certain countries such as India, Pakistan, and Bangladesh. William Delbert Gann (W.D. Gann) was an exceptional market analyst, whose trading technique was based on a complex blend of mathematics, geometry, astrology, and ancient mathematics which proved to be extremely accurate. A Note from t
Plus de l'auteur
L' Indicateur Volume Bar POC   est un outil innovant qui offre une visualisation précise des niveaux de prix clés (Point of Control, POC) basée sur le volume des ticks. Cet indicateur analyse chaque point de prix dans les bougies individuelles et affiche les niveaux les plus significatifs, qui peuvent être utilisés comme zones fortes de support et de résistance. Idéal pour les stratégies de trading intraday et à long terme. Comment fonctionne l’Indicateur Volume Bar POC ? L’indicateur utilise un
Nash Professional – Système de Trading Automatisé Avancé pour le Forex Un AOS hautement sophistiqué , optimisé pour 28 paires de devises principales et croisées : EUR/USD, GBP/USD, USD/JPY, USD/CHF, AUD/USD, NZD/USD, USD/CAD, EUR/GBP, EUR/JPY, EUR/CHF, EUR/AUD, EUR/NZD, EUR/CAD, GBP/JPY, GBP/CHF, GBP/AUD, GBP/NZD, GBP/CAD, AUD/JPY, AUD/CHF, AUD/NZD, AUD/CAD, NZD/JPY, NZD/CHF, NZD/CAD, CAD/JPY, CAD/CHF. Comprend un manuel détaillé , expliquant toutes les variables, fonctionnalités et par
L' Indicateur Volume Bar POC est un outil innovant qui offre une visualisation précise des niveaux de prix clés (Point of Control, POC) basée sur le volume des ticks. Cet indicateur analyse chaque point de prix dans les bougies individuelles et affiche les niveaux les plus significatifs, qui peuvent être utilisés comme zones fortes de support et de résistance. Idéal pour les stratégies de trading intraday et à long terme. Comment fonctionne l’Indicateur Volume Bar POC ? L’indicateur utilise un p
Prop Trade Assistant – Panel de Trading Professionnel pour MT4 Prop Trade Assistant est un panel de trading avancé conçu pour la plateforme MetaTrader 4 , offrant une gestion efficace des transactions manuelles . Cet outil calcule automatiquement les gains et les pertes , permet de définir une perte et un gain quotidiens maximum , et lorsque ces limites sont atteintes, il ferme automatiquement toutes les positions sur le compte . Il propose une exécution rapide des ordres , y compris le déplacem
Filtrer:
Aucun avis
Répondre à l'avis
Version 3.0 2025.02.08
-Added three new timeframes, making a total of six timeframes
-Added the option to disable individual timeframes as needed
Version 2.0 2025.02.05
I added the option to display SAR from up to 6 timeframes.