IFR Stochastic MT5
- Indicateurs
- Danrlei Hornke
- Version: 1.0
The Stochastic RSI (StochRSI) is a technical indicator that combines the characteristics of the Relative Strength Index (RSI) with the Stochastic Oscillator, resulting in a more sensitive tool that generates a higher number of trading signals. Developed by Tushar Chande and Stanley Kroll, the indicator was designed to overcome a perceived limitation of the traditional RSI: the low frequency of overbought and oversold levels activation (commonly 80 and 20), especially in less volatile assets.
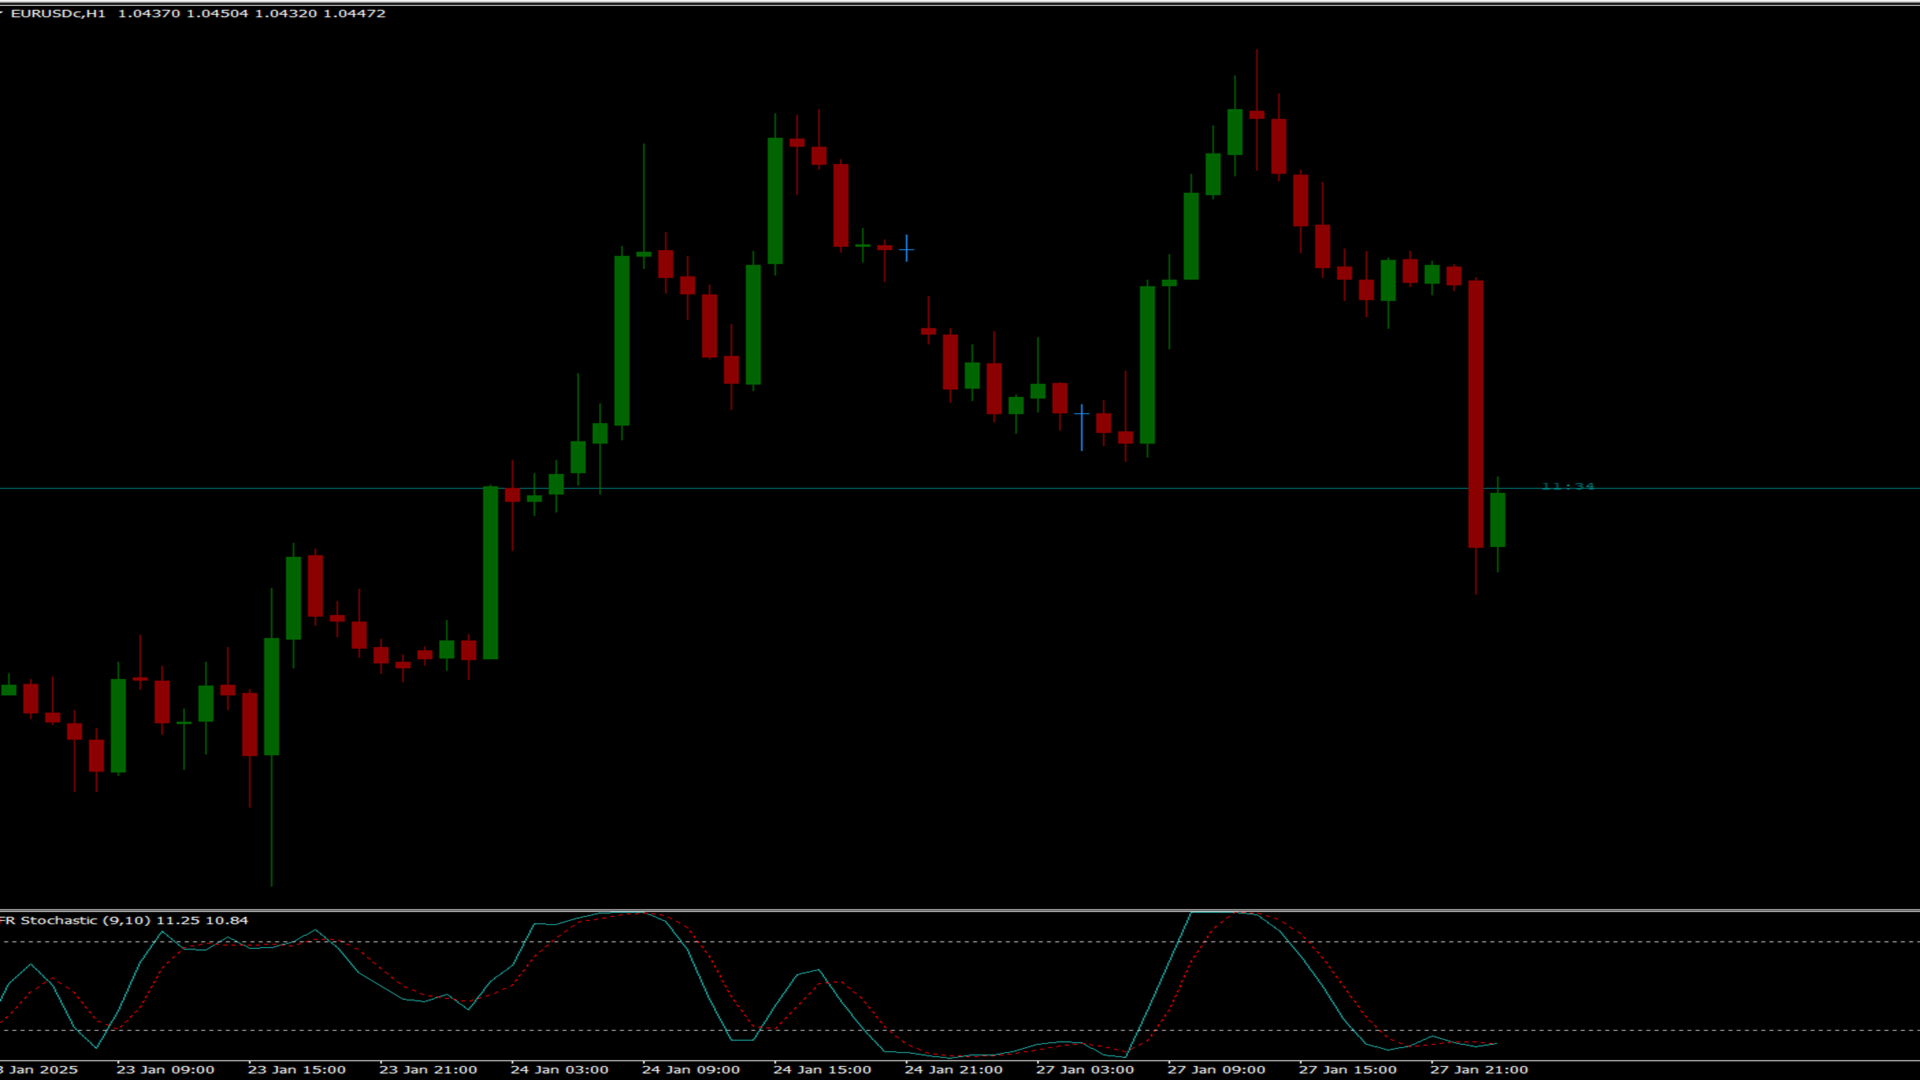
How It Works
The Stochastic RSI measures the value of the RSI in relation to the range defined by the highest and lowest values the RSI reached within a specific period. The result is an oscillator that varies between 0 and 1, providing greater responsiveness to price changes and generating more entry and exit opportunities in the market.
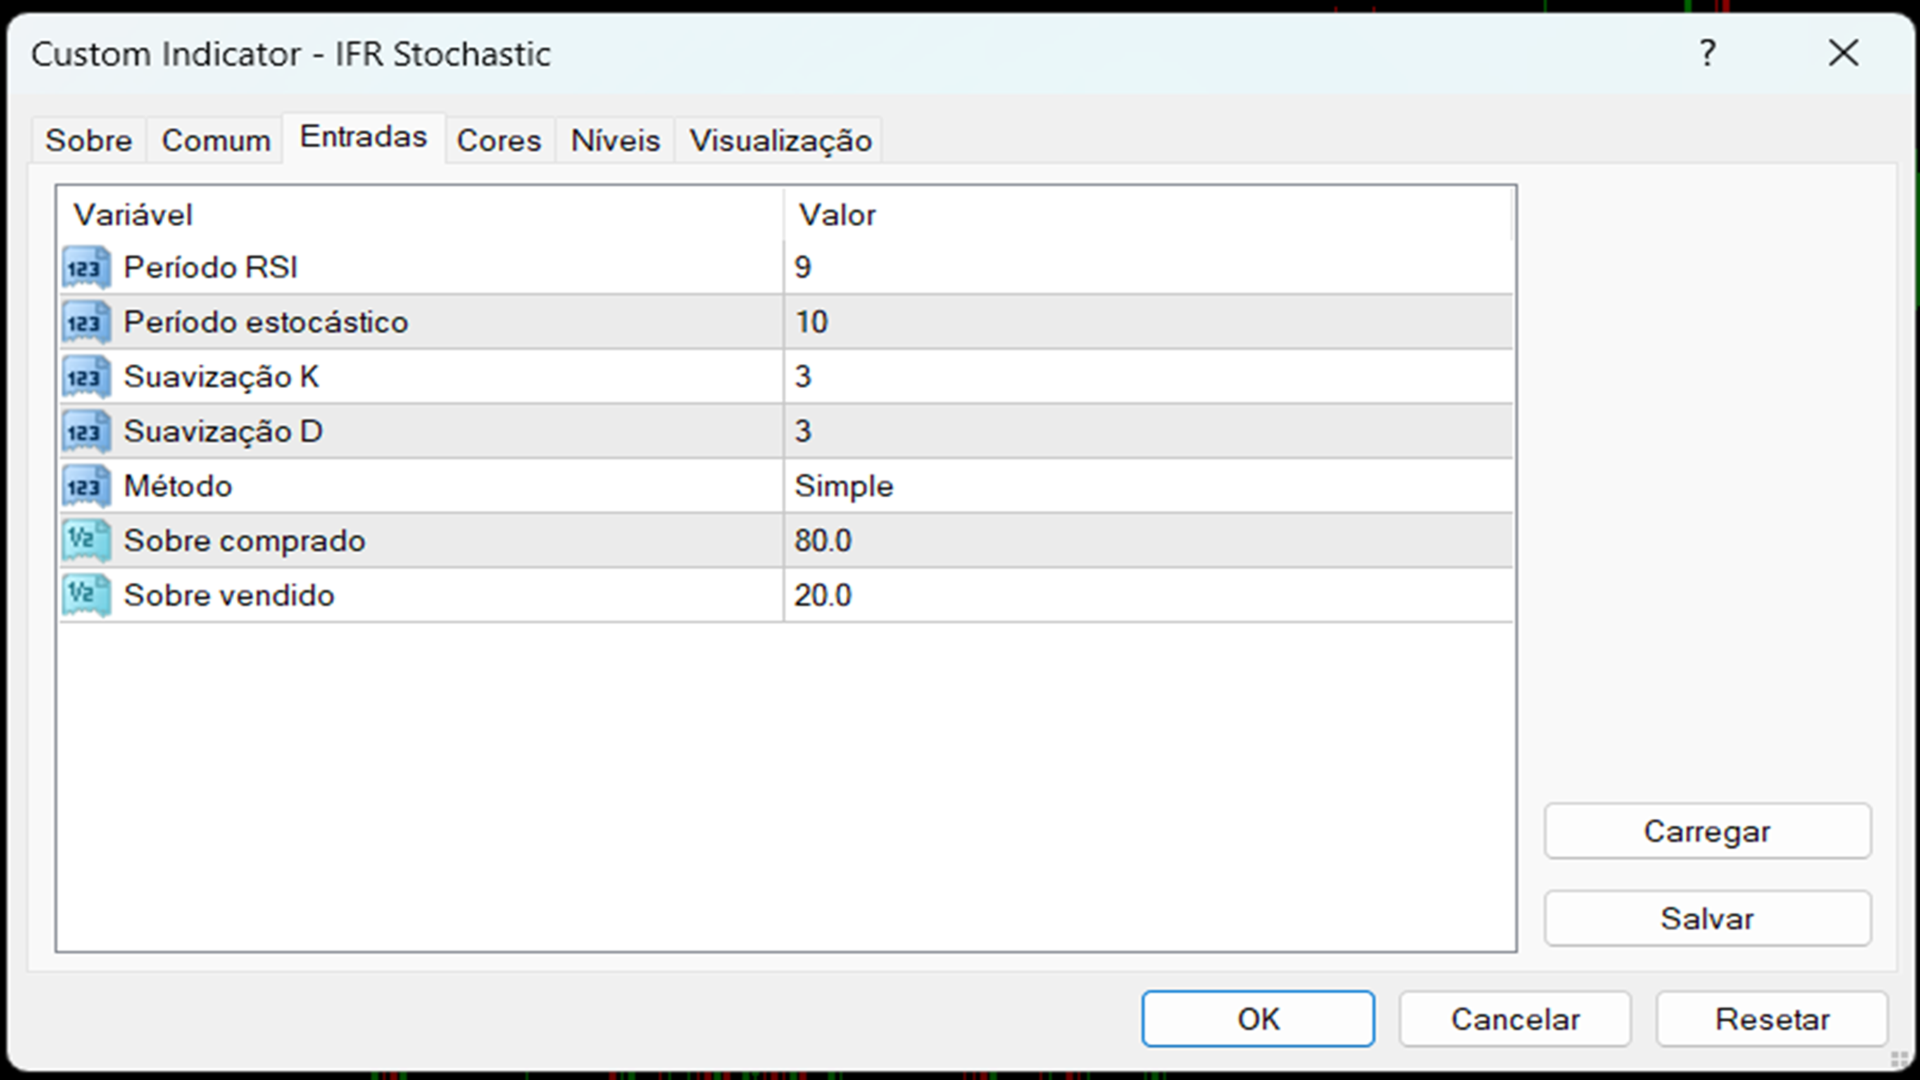
Interpretation
Sell Signal:
- Occurs when the indicator exceeds the 0.8 level (overbought zone), indicating bearish vulnerability.
- A downward cross of the 0.8 level generates the sell signal.
Buy Signal:
- Occurs when the indicator drops below the 0.2 level (oversold zone), indicating bullish vulnerability.
- An upward cross of the 0.2 level generates the buy signal.
These signals are often represented graphically with green lines (for buy) and red lines (for sell), making their visual identification easier.
Advantages
- Increased signal frequency compared to the traditional RSI, making it more useful in markets that require higher sensitivity.
- Simplicity of application, with clear rules for identifying entry and exit points.
In summary, the indicator is a valuable tool for traders seeking to identify more trading opportunities within similar time frames, without compromising the reliability of the signals provided.
L'utilisateur n'a laissé aucun commentaire sur la note