VWAP FanMaster
- Indicateurs
- Thalles Nascimento De Carvalho
- Version: 1.5
- Mise à jour: 30 janvier 2025
📈 VWAP FanMaster : Maîtrisez la stratégie de pullback avec précision !
VWAP FanMaster est l'indicateur ultime pour les traders à la recherche de points d'entrée précis et de pullbacks efficaces. 🎯 Il combine la puissance de VWAP (Prix Moyen Pondéré par le Volume) et des lignes Fibonacci Fan, offrant une carte claire des zones d'intérêt du marché.
Caractéristiques principales
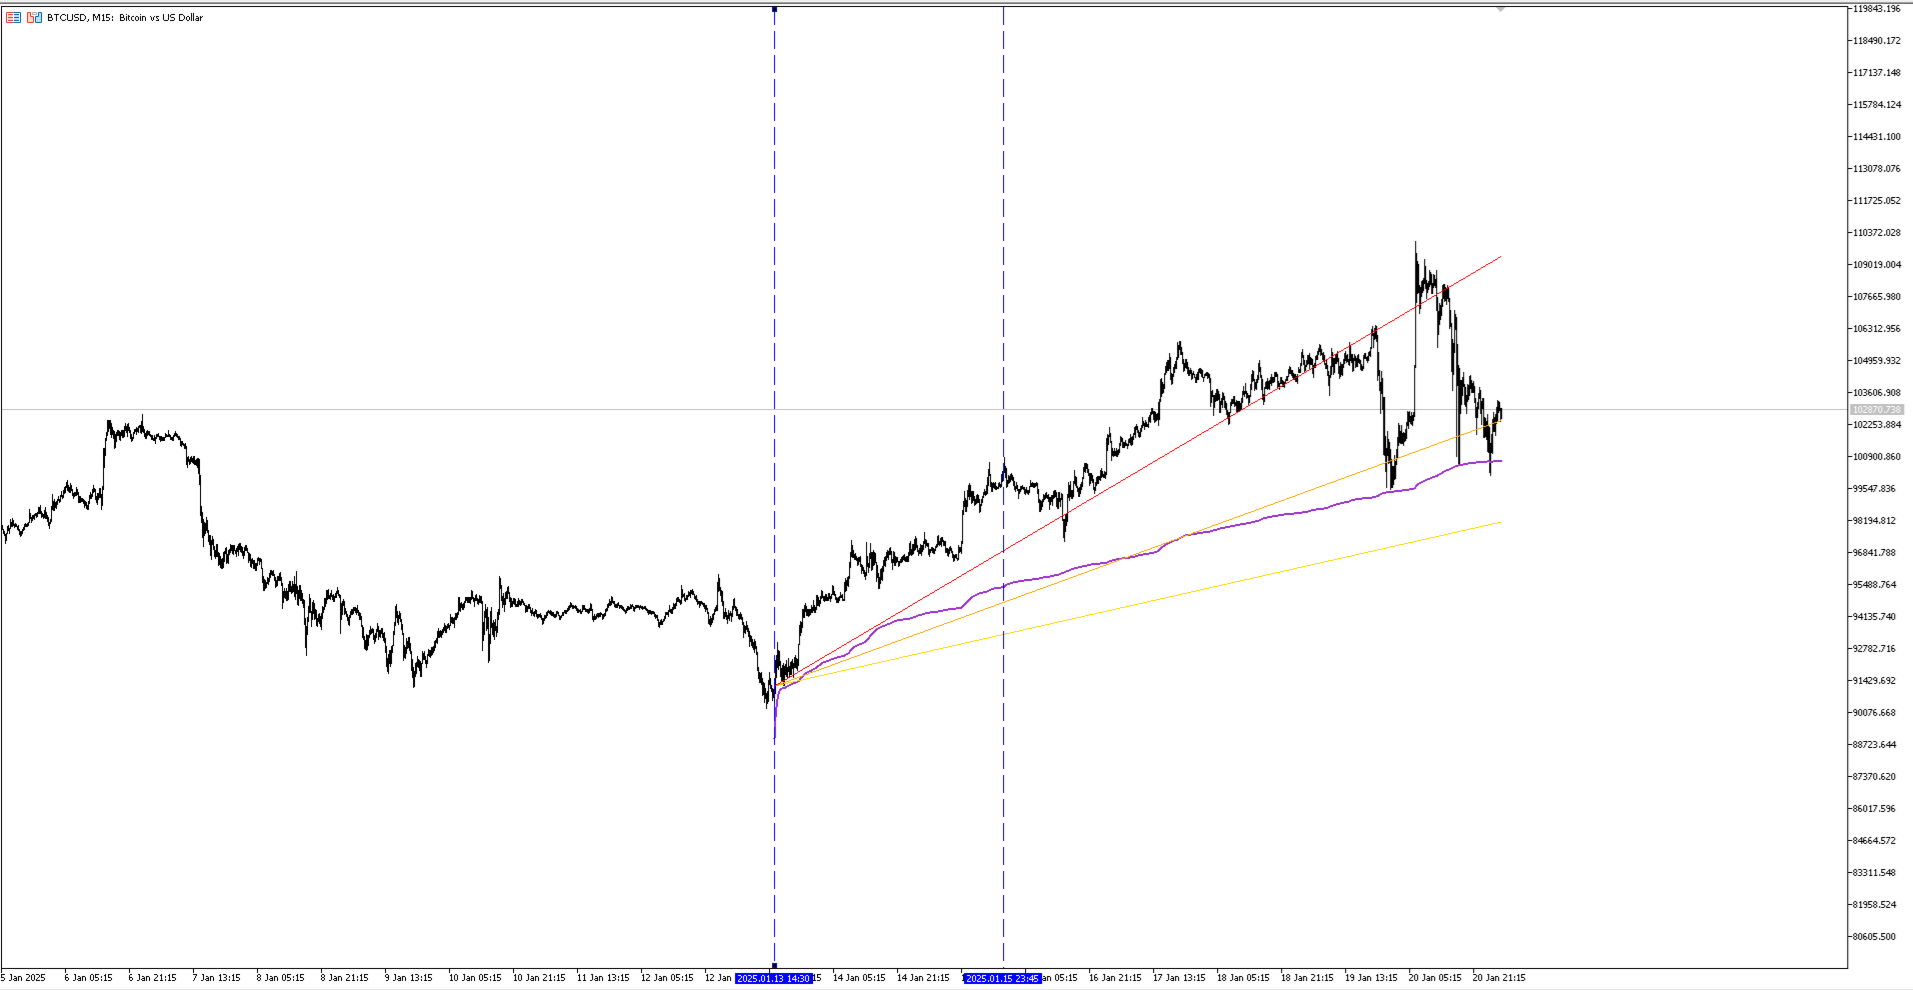
✨ Simple mais puissant : Déplacez simplement les lignes verticales et l'indicateur trace automatiquement VWAP et les lignes Fibonacci Fan.
🚀 Stratégie de trading intelligente : Attendez que le prix revienne dans les zones tracées pour capturer des pullbacks parfaits aux niveaux de support et de résistance.
📊 Outil visuel avancé : Identifiez rapidement les zones de confluence des prix pour prendre des décisions de trading éclairées.
Pourquoi choisir VWAP FanMaster ?
🔹 Facile à utiliser, même pour les débutants.
🔹 Améliore la précision de vos transactions en combinant deux outils d'analyse puissants.
🔹 Améliore la gestion des risques avec des projections de prix claires et cohérentes.
💡 Optimisez votre stratégie de trading et dominez le marché avec VWAP FanMaster !