AI Trading Station MT4
- Utilitaires
- Andrey Barinov
- Version: 1.2
- Mise à jour: 27 janvier 2025
- Activations: 5
Wouldn't it be great if AI had a second look at your trading data — graphics, indicators, and beyond?
Introducing AI Trading Station, a revolutionary utility seamlessly integrated with the MetaTrader platform. Powered by the advanced intelligence of OpenAI's ChatGPT, this complete solution covers every step of your trading journey, from data gathering to trade execution.
The Complete Trading Process. Reinvented
- Data Gathering & Visualization: Collect and display vital market data on intuitive dashboards, giving you a clear, actionable overview.
- AI-Powered Analysis: Leverage cutting-edge GPT technology to uncover insights, analyze patterns, and evaluate market conditions.
- Predictive Forecasting: Anticipate trends with AI-driven projections to make better, smarter trading decisions.
- Trade Execution & Management: Execute and manage trades effortlessly with all the tools you need integrated in one platform.
Why Choose AI Trading Station?
- Simplify Your Trading Workflow: A unified system for data, analysis, and execution—no more juggling between tools.
- Solve the Guesswork: Say goodbye to hesitation with precise, actionable insights.
- Value for Money: Institutional-level resources and capabilities at a fraction of the cost.
- Empower Financial Freedom: Take charge of your trading strategies and elevate your potential profits.
Unmatched Benefits
- True AI Expertise: Unlike competitors, this isn’t just a buzzword — ChatGPT integration ensures expert-level insights and guidance.
- Be Competitive: Go head-to-head with institutions by leveraging the same level of data-driven analysis and tools.
- Streamline Success: All steps of the trading process are covered, empowering you to focus on strategy and results.
"This is what happens when MetaTrader meets GPT."
AI Trading Station isn’t just a tool — it’s your complete partner in trading. Experience the future of trading today.
DEMO VERSION for live accounts: get free demo
Please, contact me if you have any questions or doubts before making a purchase decision.
Join my channel: AI Trading Solutions
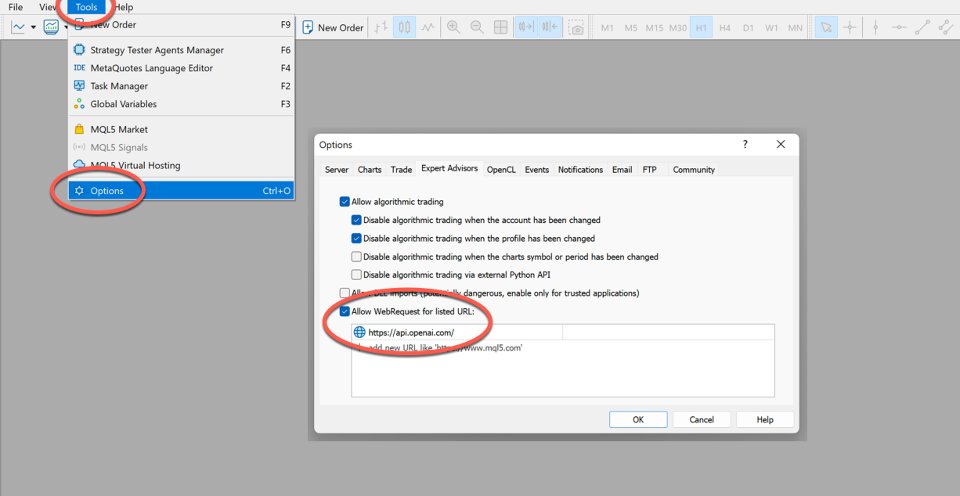
You have to allow webrequests to OpenAI resources in MetaTrader settings. See screenshots for more information.
Functionality
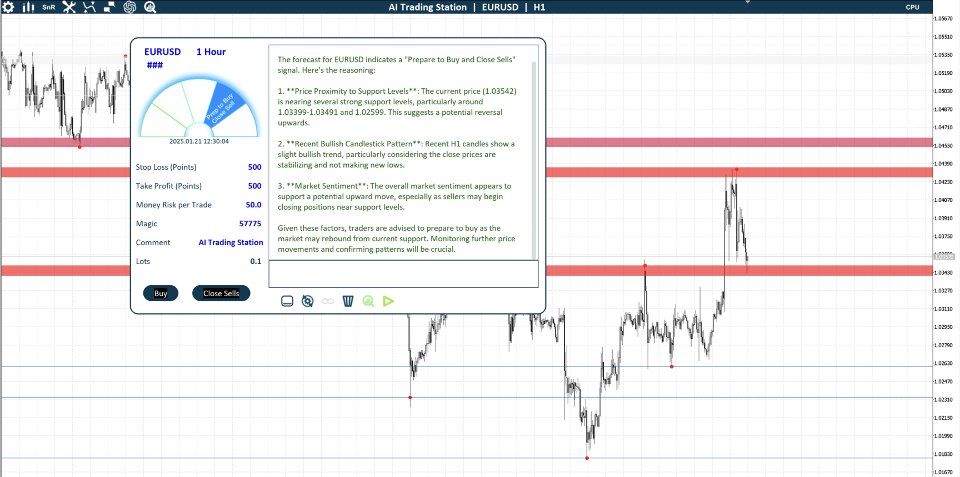
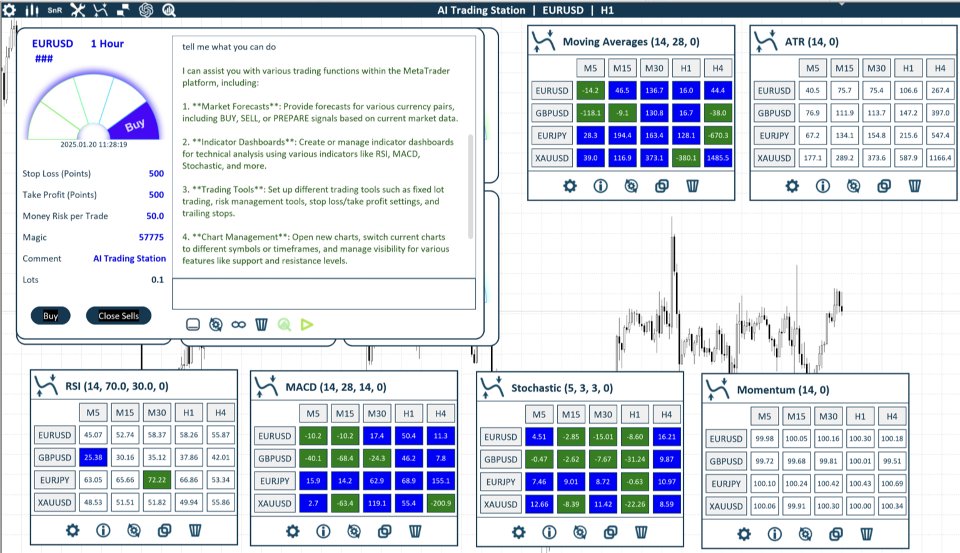
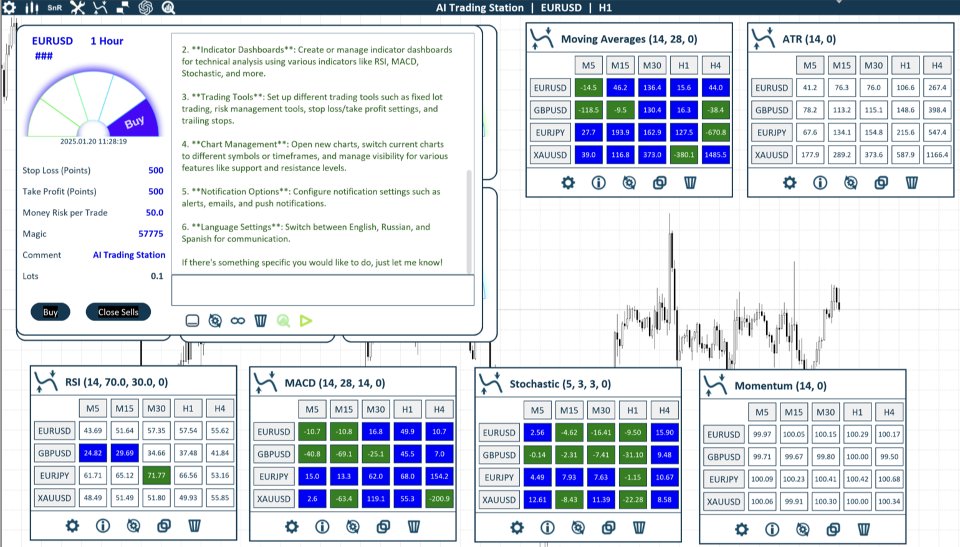
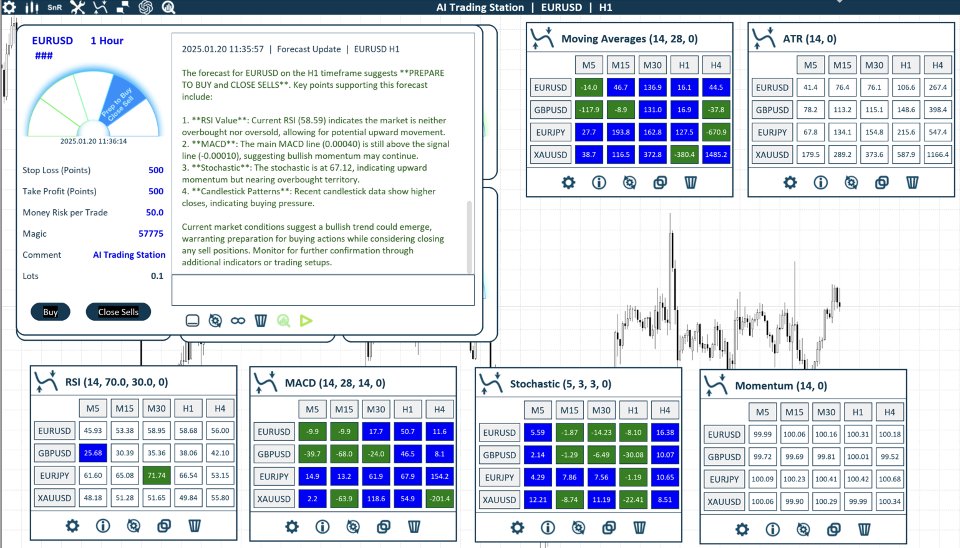
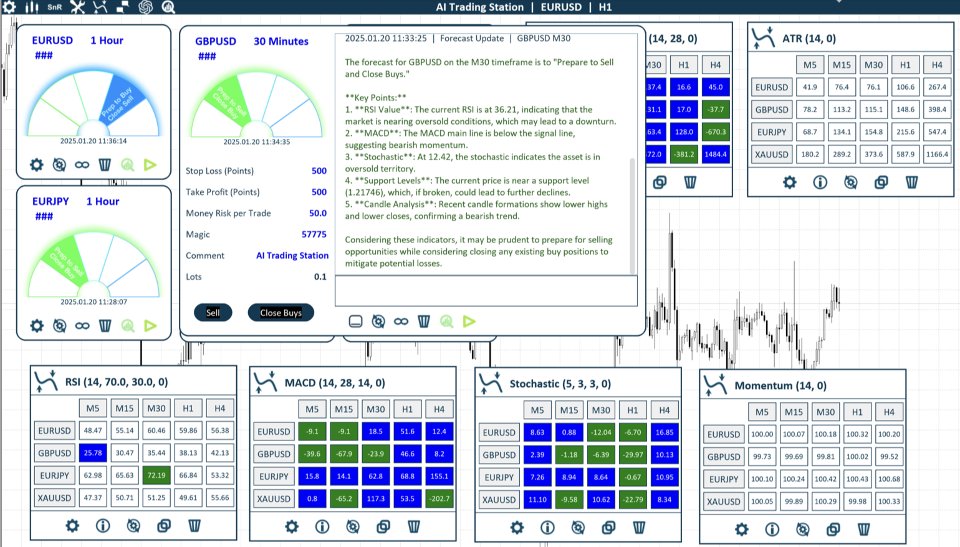
GPT Forecasts, Assistants and Chats. Forecasts can analyse market data and provide analytics for different symbols and timeframes. They also can execute user commands.Assistants can execute user commands, but it takes them longer to generate responses. Chat gives a reply faster, but can really only be used for chatting. It can not execute any commands.
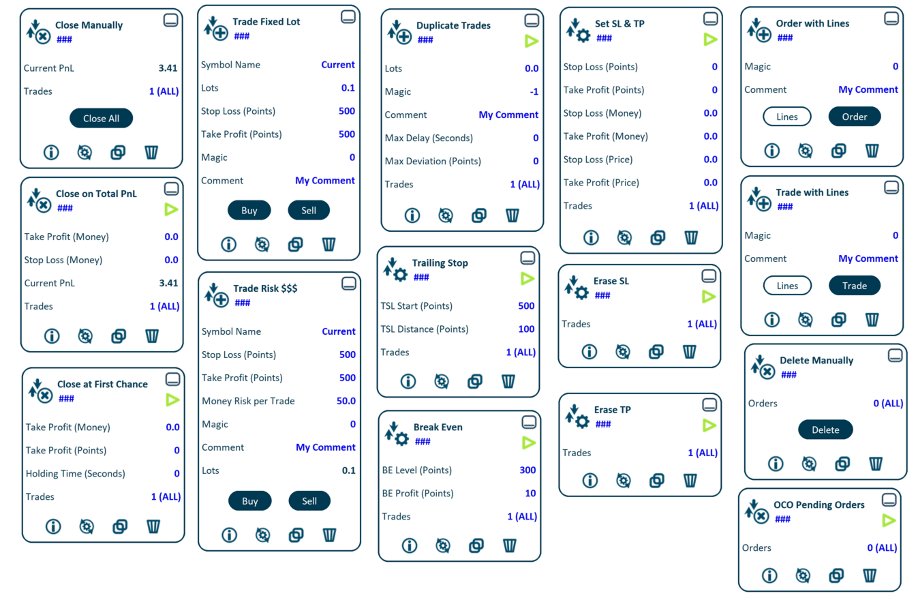
15+ Trading Tools for opening new trades and managing existing ones. More tools will come soon.
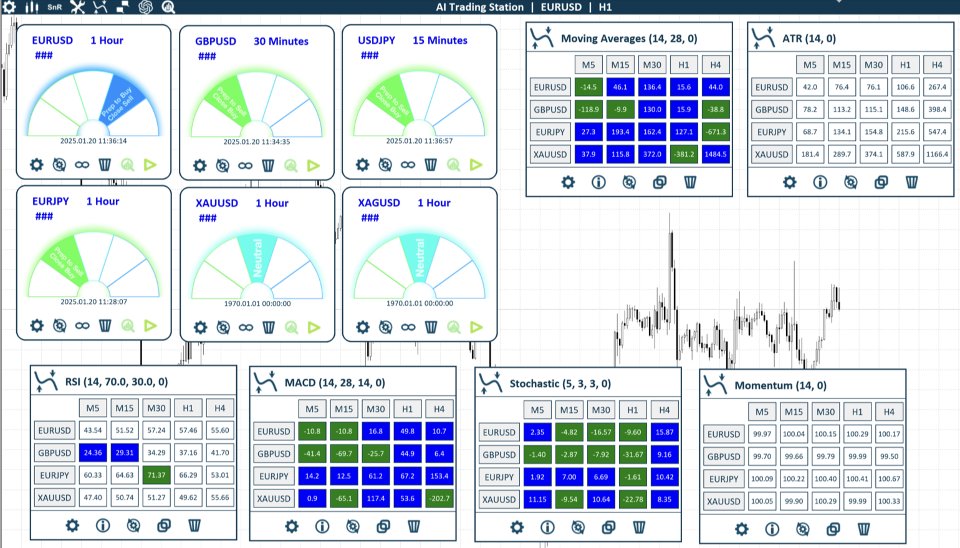
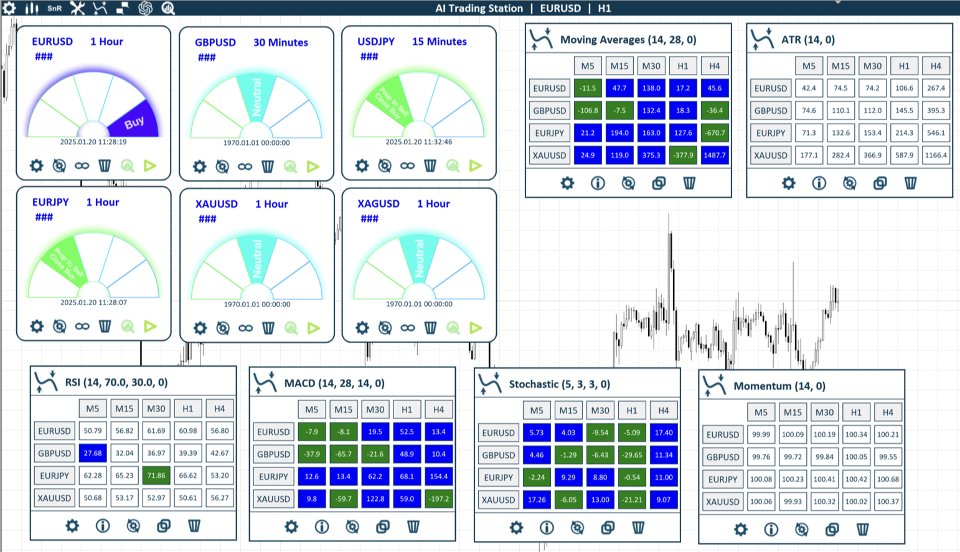
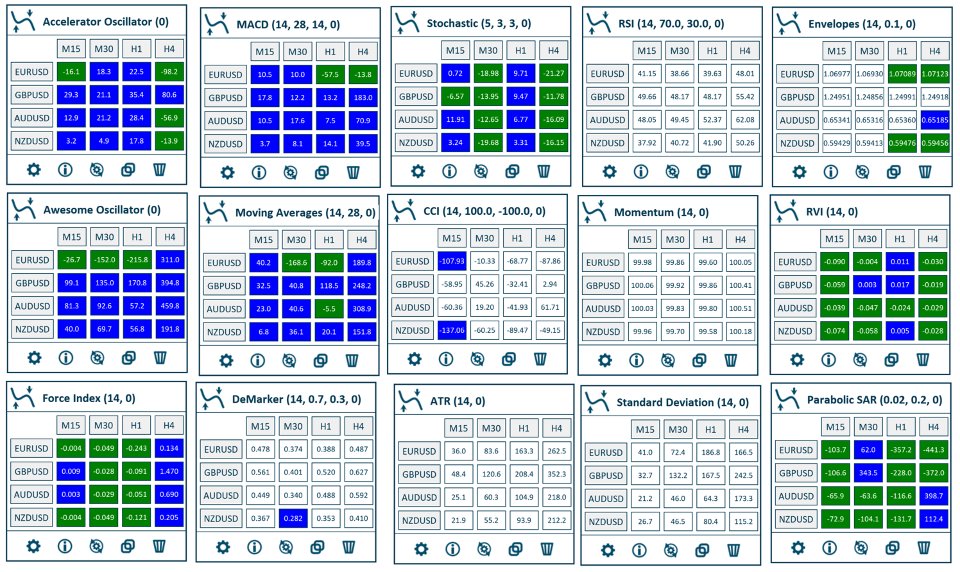
20+ Indicators dashboards showing multiple symbols and timeframes at once. They also show recommended buy/sell signals.
Support and Resistance Levels for a given chart may be shown and used for market analysis or to adjust SL and TP levels for your trades.
English, Spanish and Russian localizations.
Built-in descriptions for all tools and dashboards.
Available for both MetaTrader4 and MetaTrader5 platforms.
No need for you to register on OpenAI website or to have your own API keys. The tool works right from the box.
Inputs
There is only one input parameter in AI Trading Station: Profile ID # which specifies the name of the currently used Profile. It should be set different for EVERY instance (even with the same chart symbol) of the utility running in your terminal.
Limitations
Not all countries / locations are allowed to access OpenAI resources. From some locations AI Trading Station will not work. You can check if your location is allowed by trying to check ChatGPT on OpenAI website. If you can access this webpage https://chat.openai.com/ everything should work properly.
Tools
Trade with Lines and Pending Order with lines - allows adjusting trade's parameters using visual lines, before opening it. It can also calculate the lot size, based on given Stop Loss / Take Profit values in money.
Trade with Fixed Lot or Risk $ - Opens a trade with predefined parameters. Can trade any symbol or multiple symbols from a single chart. Automatically calculates the lot size using given Risk value in money and Stop Loss value in points.
Trades Duplicator - Duplicates selected incoming trades. Can be used as a signal duplicator. Can overwrite different parameters, including lot size, magic and comment. Allows setting maximum price deviation in points and maximum time delay in seconds.
Setting / Erasing Stop Loss and Take Profit - Allows setting Stop Loss and Take Profit for selected trades. Values can be set in points, money or as a fixed price level. Erase SL and TP utilities set SL / TP for selected trades as 0.
Trailing Stop and Break Even - classic functionality. But, with this tool you can set both TSL and BE INDIVIDUALLY for every trade.
Close on Total PnL - closes a group of trades when their total profit / loss reaches certain levels.
Close in Profit at First Chance - closes selected trades after certain holding time when they reach minimum profit levels, set in Money or Points.
One Cancels Others functionality for pending orders. Multiple orders can be selected. When / if one of them becomes triggered / turns into a trade, all other orders will be deleted.
Closing Trades and Deleting Pending Orders - manual closing of all selected trades / orders at once.
Dashboards
Accelerator Oscillator - Displays the value of AC indicator in points. Colored as buy signal if value is above 0 and as sell signal if it is below 0.
Awesome Oscillator - Displays the value of AO indicator in points. Colored as buy signal if value is above 0 and as sell signal if it is below 0.
Bulls Power - Displays the value of Bulls indicator in points. Colored as buy signal if value is above 0 and as sell signal if it is below 0.
Bears Power - Displays the value of Bears indicator in points. Colored as buy signal if value is above 0 and as sell signal if it is below 0.
MACD - Displays the difference between Main Line and Signal Line in points. Colored as buy signal if Main Line is above Signal Line and as sell signal if it is below.
Moving Averages - Displays the difference between Fast MA and Slow MA in points. Colored as buy signal if Fast MA is above Slow MA and as sell signal if it is below.
Stochastic - Displays the difference between Main Line and Signal Line. Colored as buy signal if Main Line is above Signal Line and as sell signal if it is below.
CCI - Displays the value of CCI indicator. Colored as buy signal if value is below Oversold Level and as sell signal if it is above Overbought Level.
WPR - Displays the value of WPR indicator. Colored as buy signal if value is below Oversold Level and as sell signal if it is above Overbought Level.
RSI - Displays the value of RSI indicator. Colored as buy signal if value is below Oversold Level and as sell signal if it is above Overbought Level.
Momentum - Displays the value of Momentum indicator.
Envelopes - Displays the value of Middle Envelopes Line. Colored as buy signal if Close Price is above Upper Line and as sell signal if Close Price is below Lower Line.
Bollinger Bands - Displays the value of Middle Bollinger Bands Line. Colored as buy signal if Close Price is above Upper Line and as sell signal if Close Price is below Lower Line.
RVI - Displays the difference between Main Line and Signal Line. Colored as buy signal if Main Line is above Signal Line and as sell signal if it is below.
Money Flow Index - Displays the value of MFI indicator. Colored as buy signal if value is below Oversold Level and as sell signal if it is above Overbought Level.
Force Index - Displays the value of Force indicator. Colored as buy signal if value is above 0 and as sell signal if it is below 0.
DeMarker - Displays the value of DeMarker indicator. Colored as buy signal if value is below Oversold Level and as sell signal if it is above Overbought Level.
ATR - Displays the value of Average True Range indicator in points.
Standard Deviation - Displays the value of StdDev indicator in points.
Parabolic SAR - Displays the difference between High/Low price and PSAR value in points. Colored as buy signal if PSAR dot is below candle and as sell signal if it is above candle.
Future Development
I am planning to further develop this project using my own ideas and valuable inputs / feedback from the users.
Please, do let me know if you have any comments or requests which can help make AI Trading Station even better. I am listening.
About me
I am a professional developer with 12+ years of MQL programming experience and 1000+ performed job orders as a freelancer.
Now my full time job is to create professional solutions for traders.
