Coloured MACD
- Indicateurs
- Moegamat Luqmaan Titus
- Version: 1.0
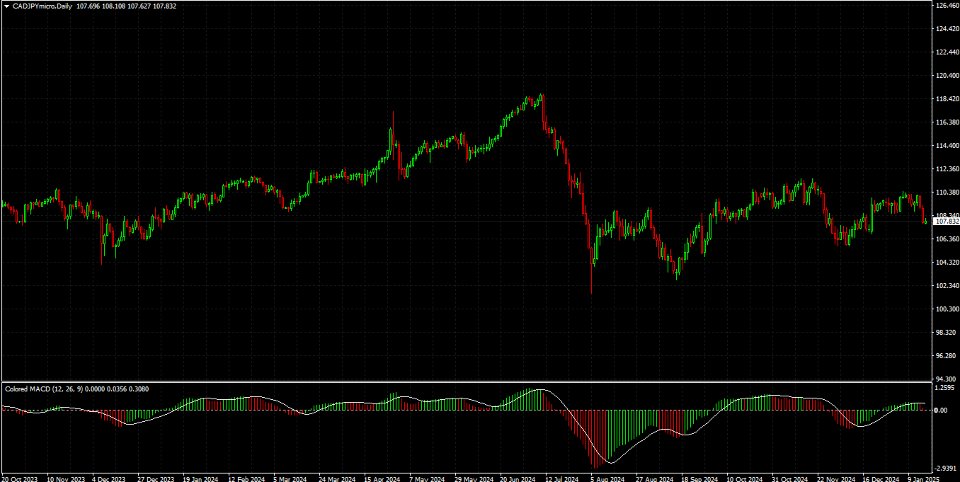
The Colored MACD indicator is a versatile and powerful tool designed to enhance your technical analysis by providing an intuitive visualization of market momentum and trend changes. Built on the foundation of the popular Moving Average Convergence Divergence (MACD) indicator, this version introduces color-coded histograms to easily distinguish between bullish and bearish momentum.
Key Features:
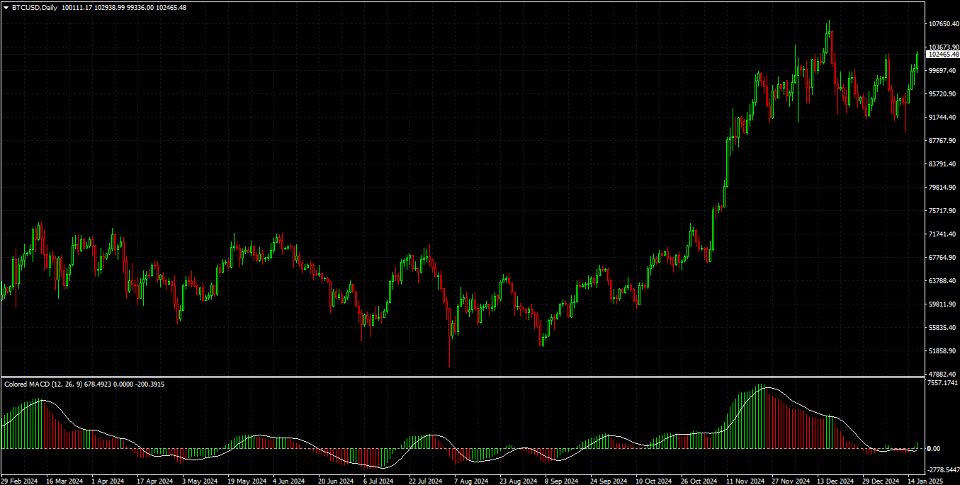
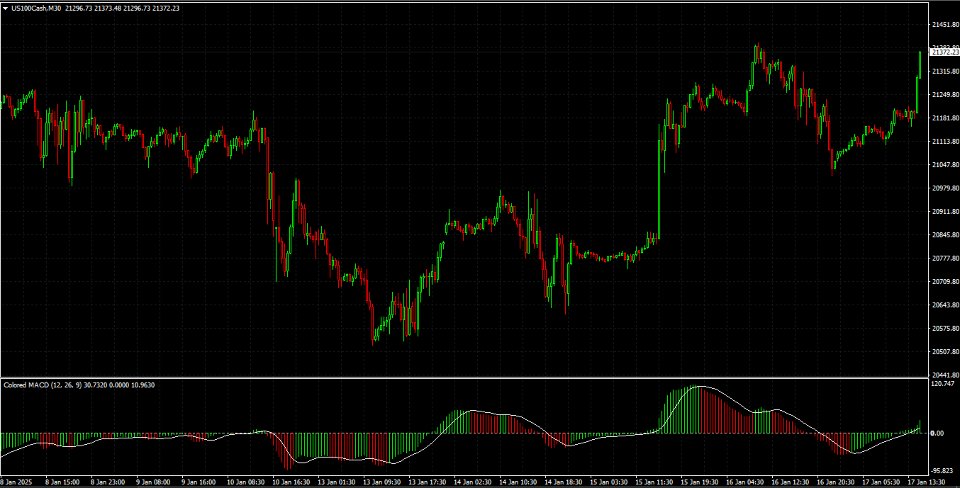
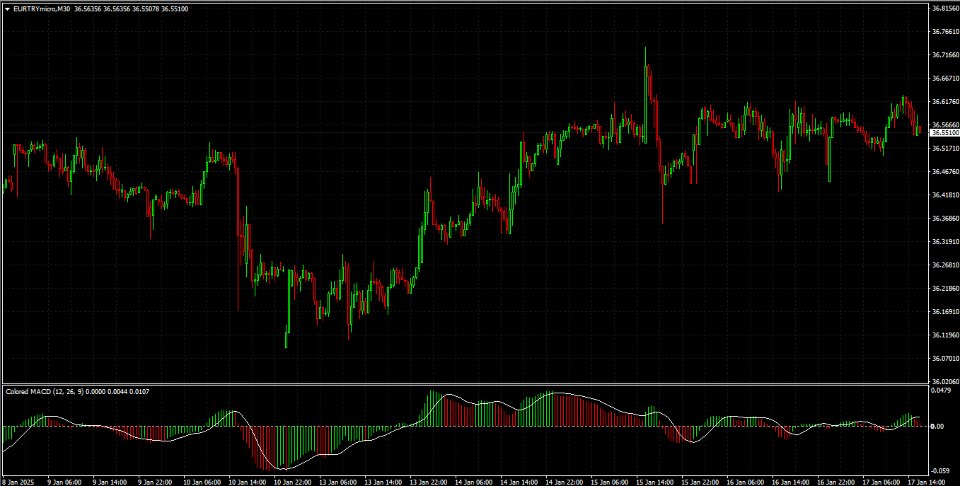
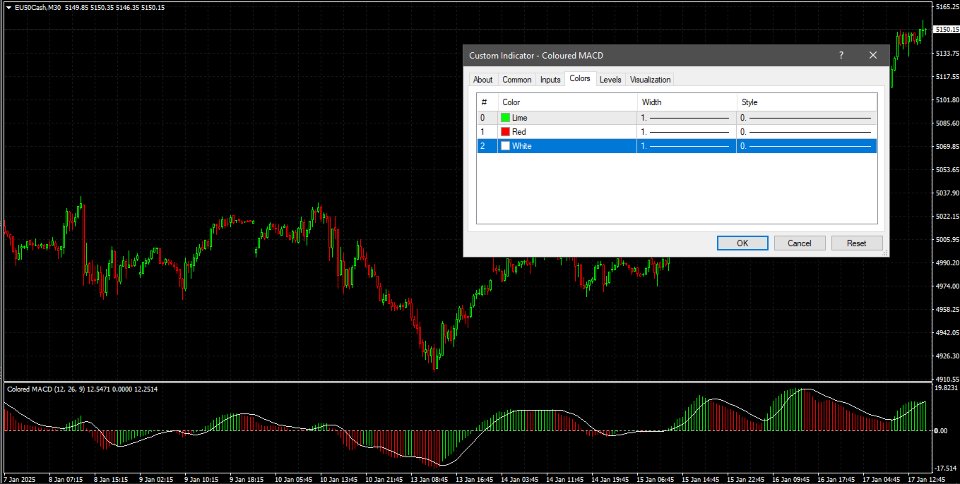
- Color-Coded Visualization: The indicator features a lime-colored histogram when the MACD is above the signal line (bullish), and a red-colored histogram when the MACD is below the signal line (bearish), making it easier to identify market conditions at a glance.
- Signal Line: A white line represents the MACD signal line, giving you a clear reference for potential trend reversals or crossovers.
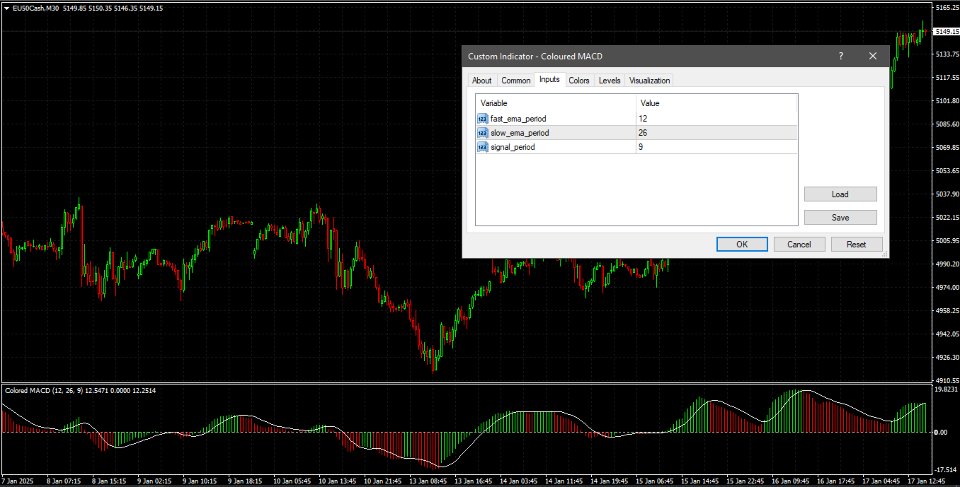
- Customizable Settings: You can adjust the key periods for the fast EMA, slow EMA, and signal line to suit your trading style and timeframe. Default settings are 12, 26, and 9 periods respectively.
- Clear and Precise Analysis: The indicator helps you identify moments of trend strength or weakness, providing valuable insights for entries and exits.
- Separate Window Display: The indicator is displayed in a separate window, offering a clean and uncluttered view of market momentum.
Whether you're a day trader looking for short-term signals or a swing trader analyzing market trends, the Colored MACD indicator gives you a dynamic edge in your trading strategy. By clearly showing momentum shifts, it can help you make more informed trading decisions.

