SilentLevels
- Indicateurs
- Barakah Muslih B Alharbi
- Version: 4.1
- Mise à jour: 15 janvier 2025
- Activations: 5
One of the key elements in trading is identifying zones or levels that allow traders to make buy or sell decisions during trading.
أحد العناصر الأساسية في التداول هو تحديد المناطق أو المستويات التي تسمح للمتداولين باتخاذ قرارات الشراء أو البيع أثناء التداول.
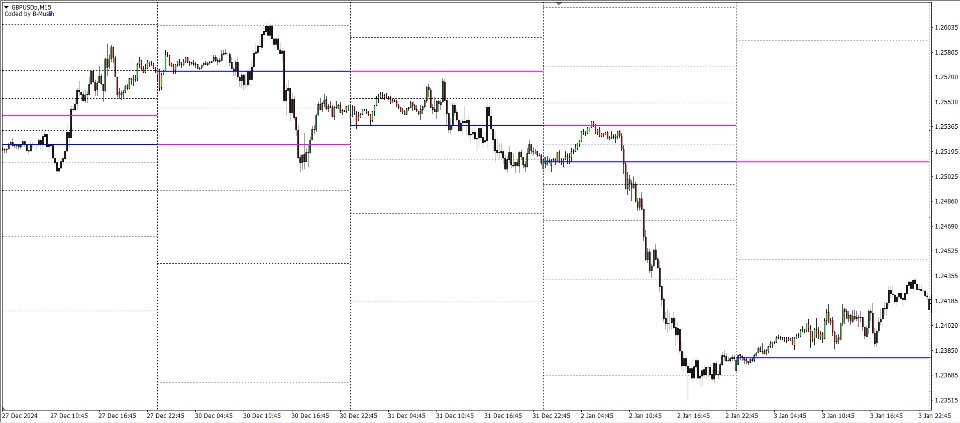
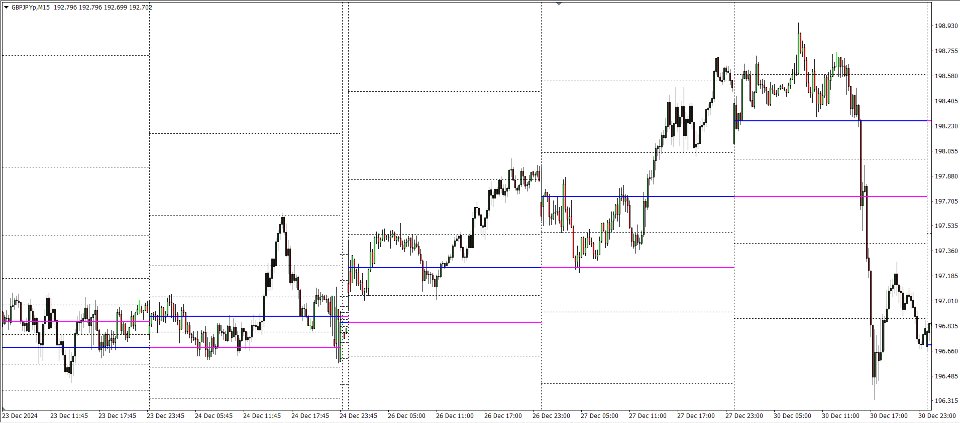
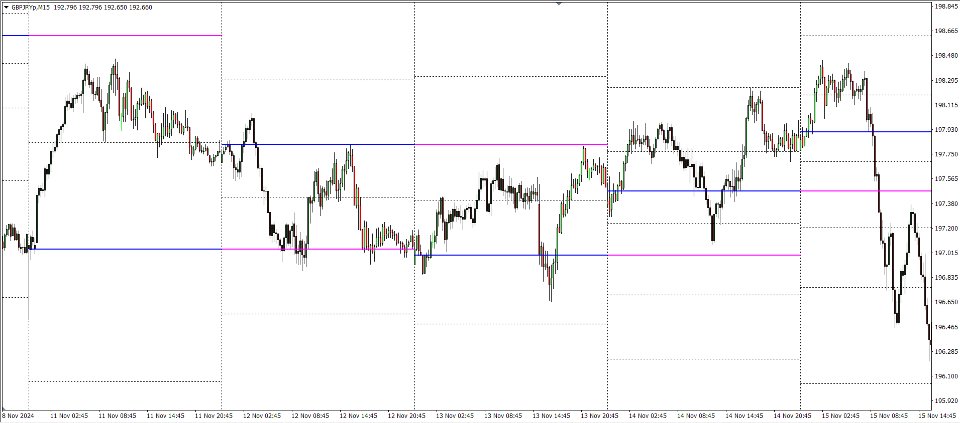
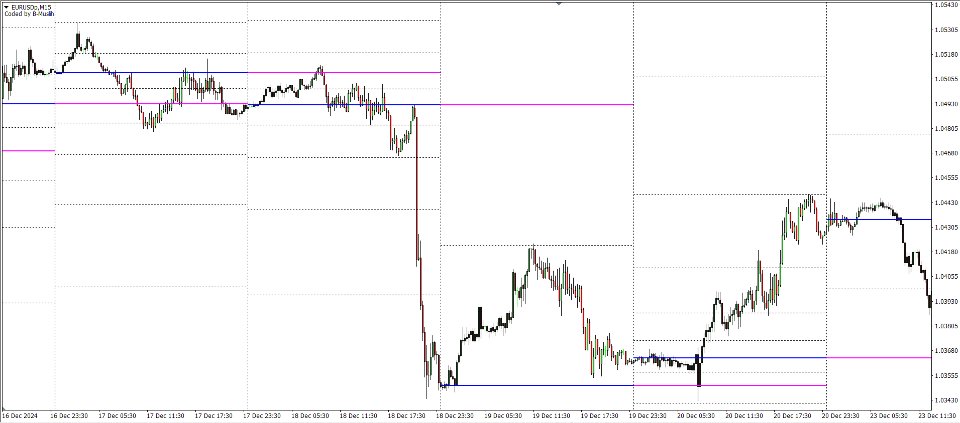
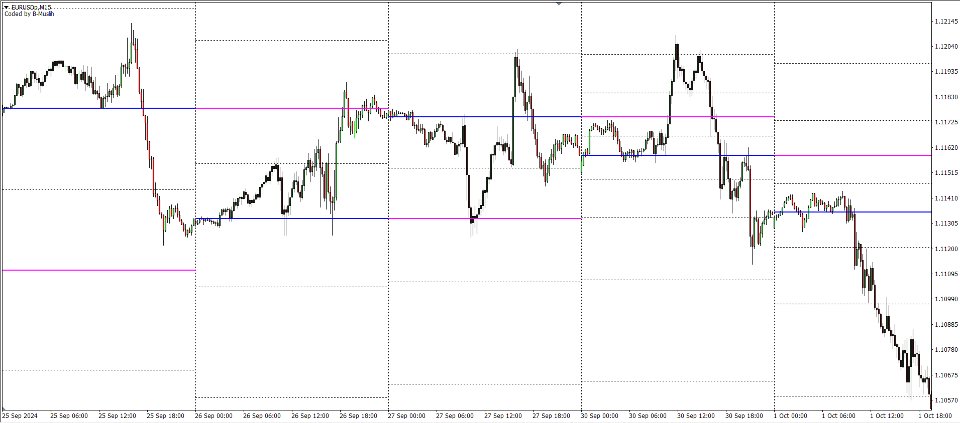
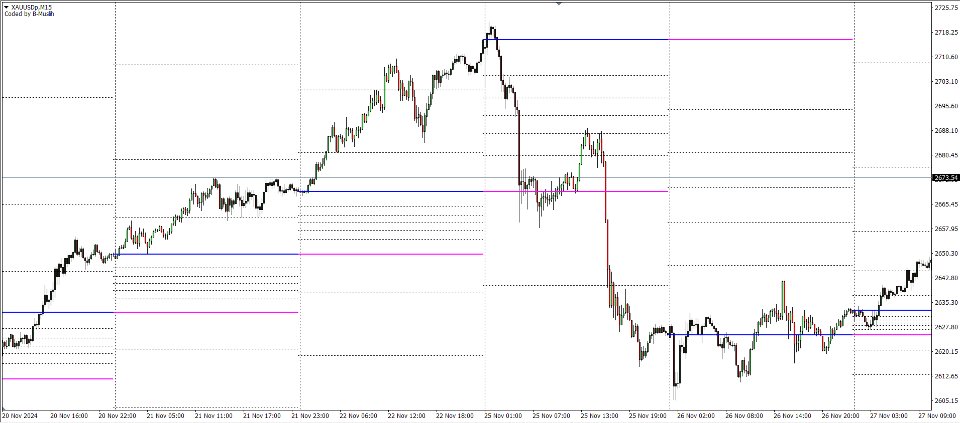
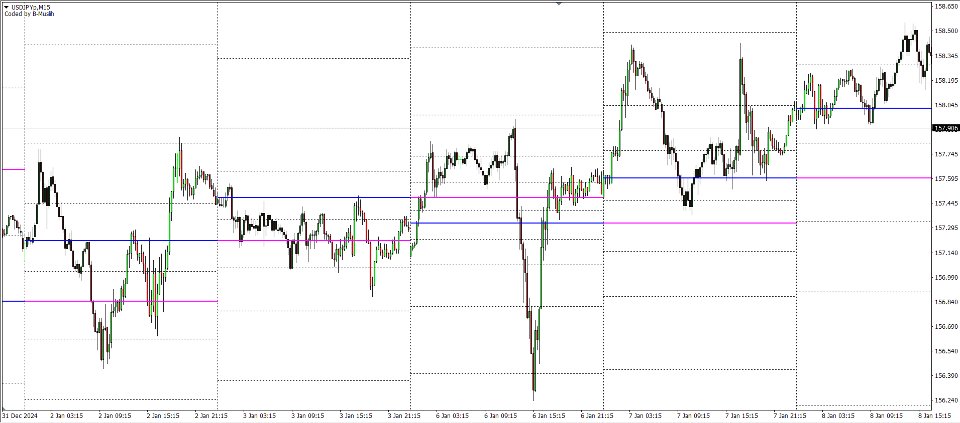
drawing levels based on historical daily or weekly data.
مستويات الرسم بناءً على البيانات التاريخية اليومية أو الأسبوعية.
Daily levels update with each new day’s opening, while weekly levels remain fixed throughout the current trading week
. يتم تحديث المستويات اليومية مع افتتاح كل يوم جديد، بينما تظل المستويات الأسبوعية ثابتة طوال أسبوع التداول الحالي.
The interface is simple and clear, free from unnecessary complexity, ensuring ease of use.
الواجهة بسيطة وواضحة، وخالية من التعقيد غير الضروري، مما يضمن سهولة الاستخدام.
The levels are divided into two categories:
وتنقسم المستويات إلى فئتين:
* Main Levels: These are marked with the letters “L” and “C” and represent strong pivots that can be relied upon during trading, alongside Fibonacci levels.
* المستويات الرئيسية: تتميز بالحرفين "L" و"C" وتمثل نقاط ارتكاز قوية يمكن الاعتماد عليها أثناء التداول إلى جانب مستويات فيبوناتشي.
*The smaller the area between C and L, the more likely to expect:
1. Price fluctuations
2. Strong price action
------------------------------------------------------
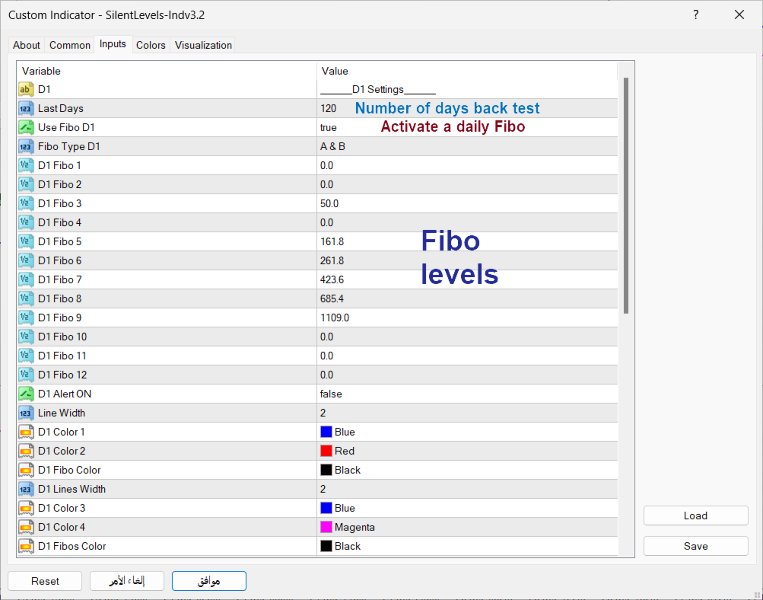
The price is often dealt with when retracing from Fibonacci 161.8
*Weekly levels can be combined with daily
* يمكن دمج المستويات الأسبوعية مع المستويات اليومية
You can also make it alone on the chart
يمكنك أيضًا القيام بذلك بمفردك على الرسم البياني
In a way different from what you know.
بطريقة مختلفة عما تعرفه.
The current version is the final
الإصدار الحالي هو النهائي
