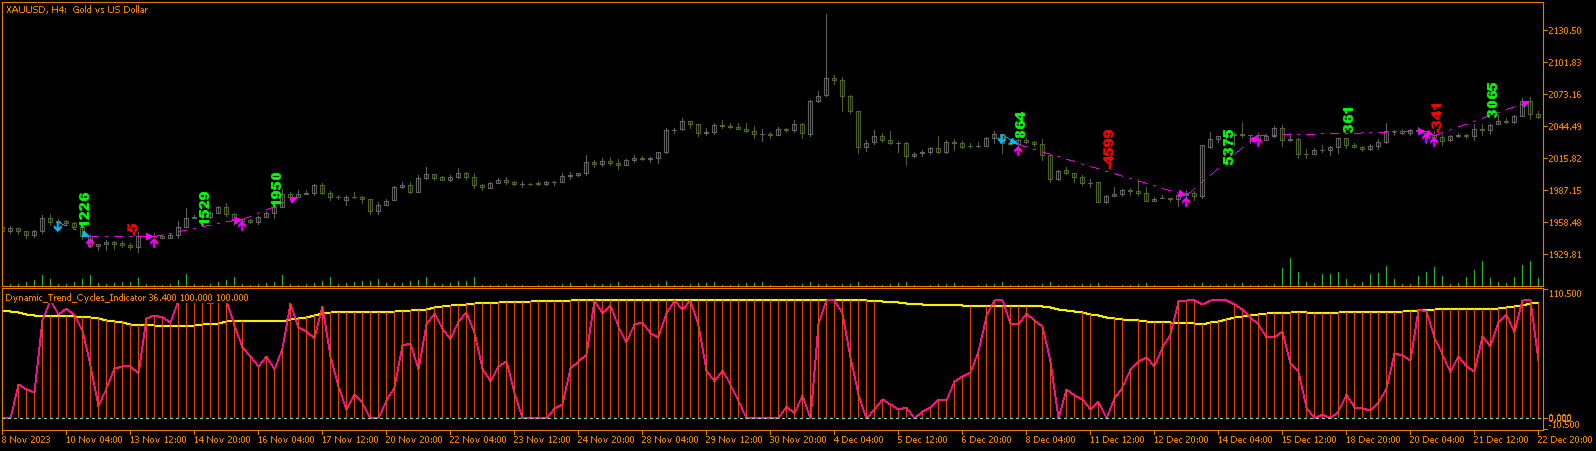
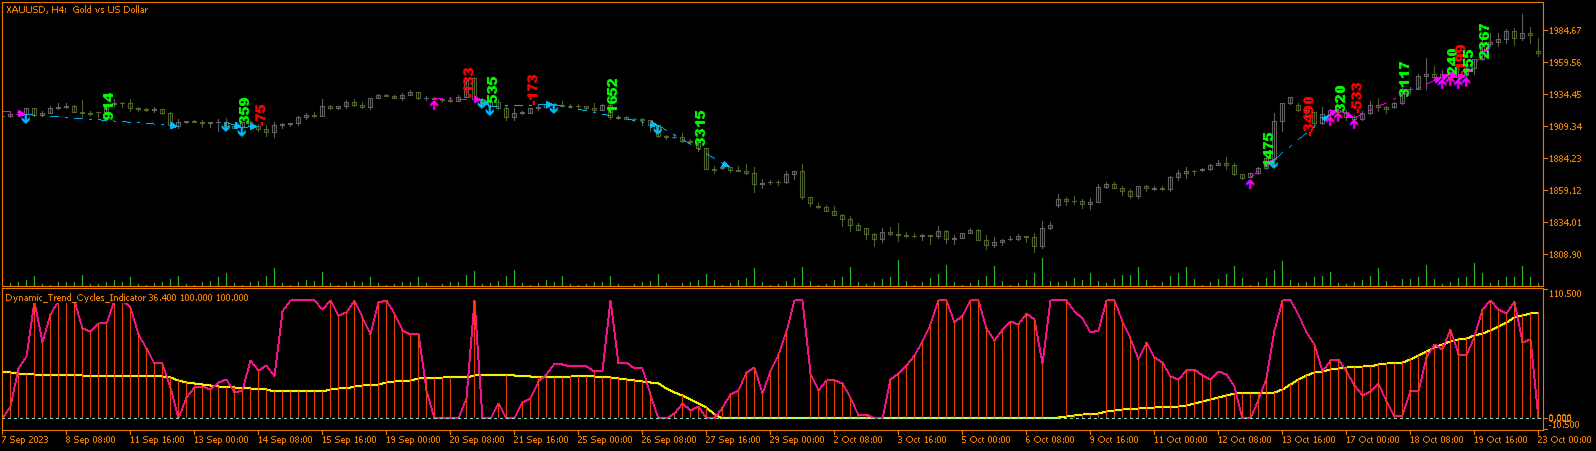
Dynamic trend cycles oscillator
- Indicateurs
- Ekaterina Saltykova
- Version: 1.0
- Activations: 5
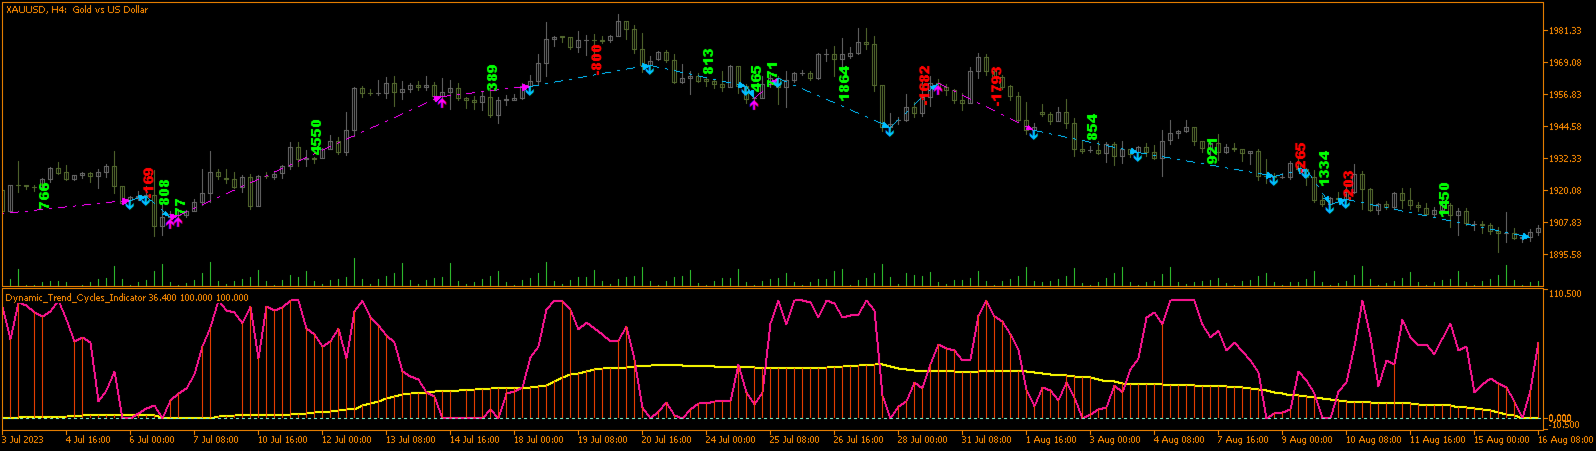
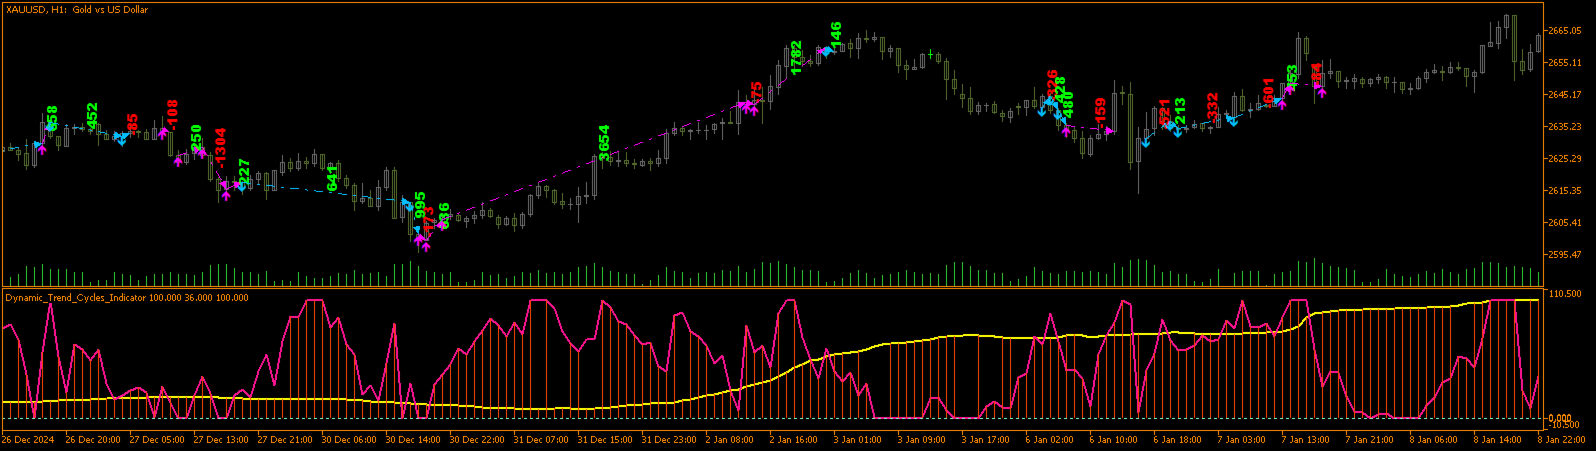
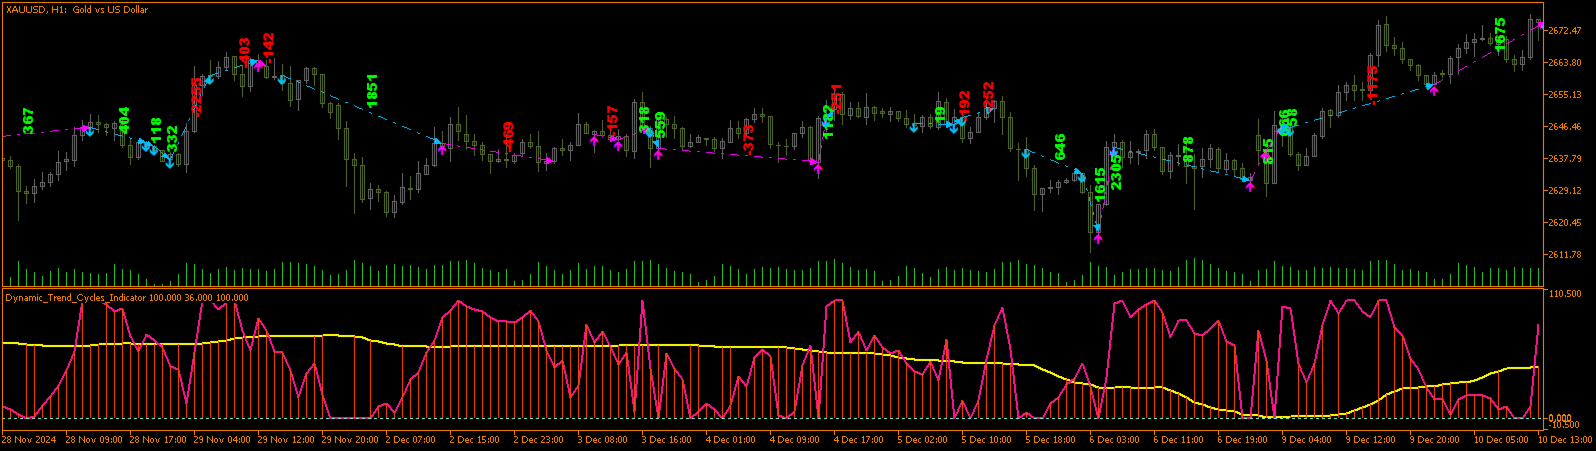
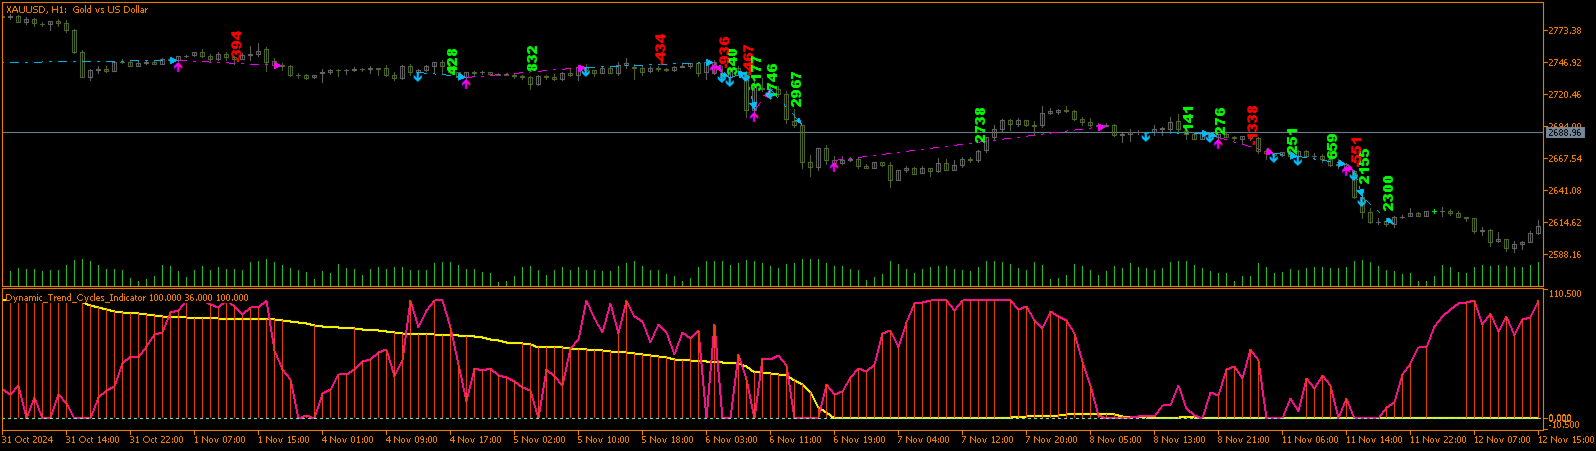
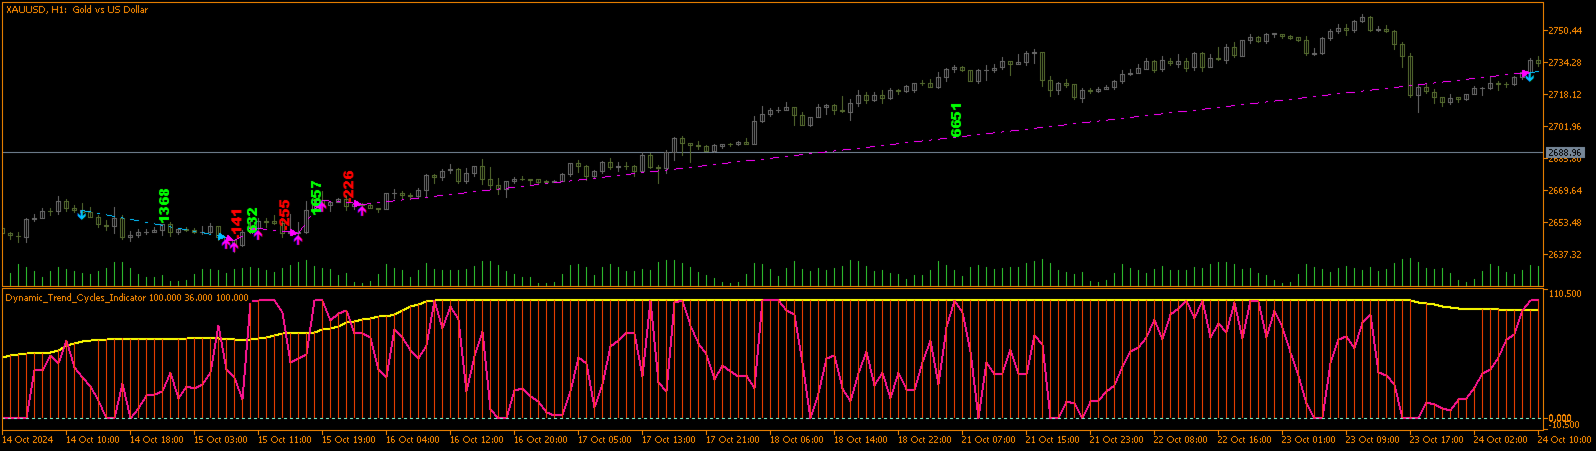
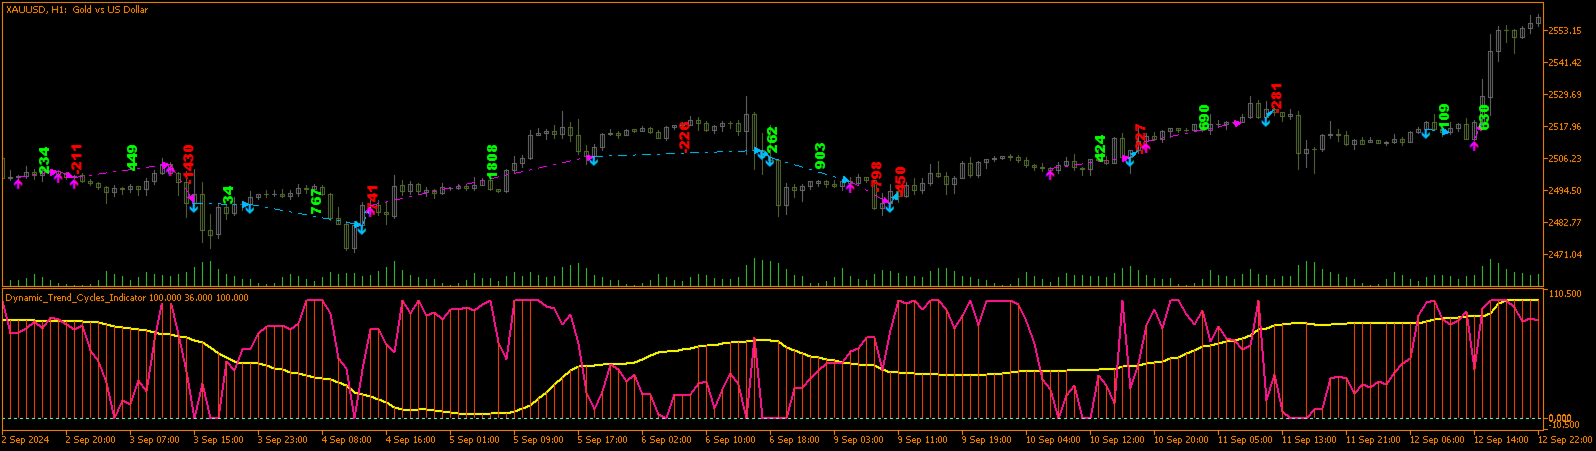
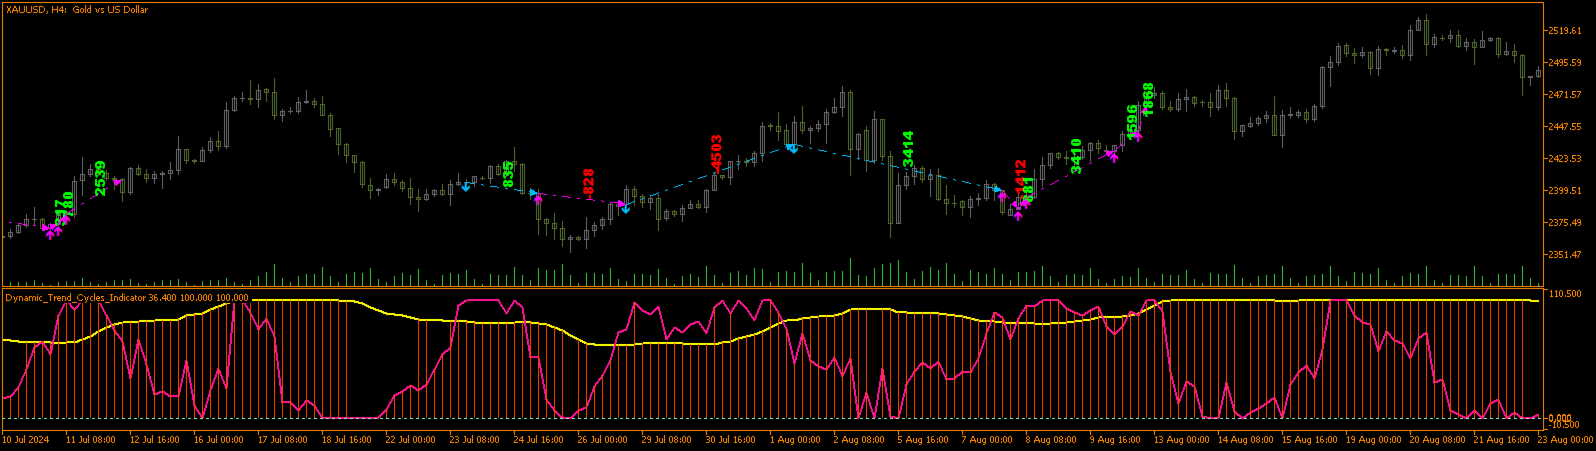
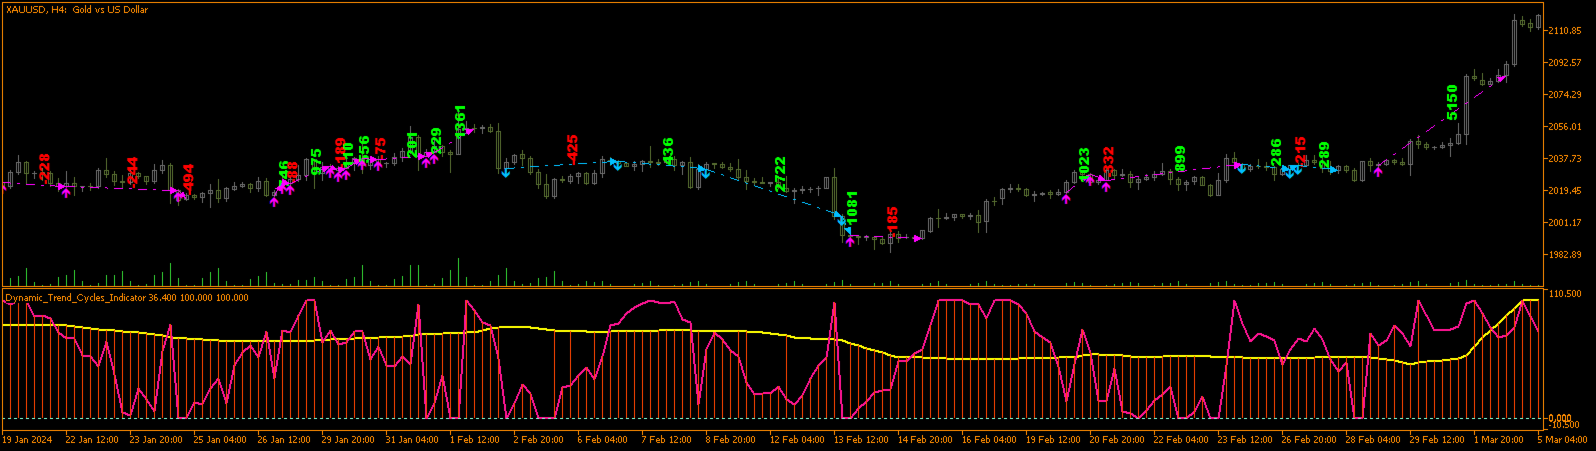
Introducing the unique trading system Dynamic trend cycles oscillator (DTC) — a powerful tool for H1-H4 trading with volatility pairs !
Technical capabilities
- pairs to trade : EURUSD,GBPUSD,XAUUSD;
- timeframes : M30,H1,H2,H3,H4;
Why Choose DTC?
- Accurate Trend Analysis: DTC adapts to current market volatility, providing precise tracking of price trends. This allows you to confidently open positions in line with the main trend and maximize your profits.
- Filtering False Signals: In times of high volatility, DTC uses a short averaging period, while during low volatility it employs a longer one. Thus, the robot avoids unnecessary trades during periods of uncertainty, minimizing your risks.
- Identifying Cyclical Movements: DTC effectively identifies turning points within market cycles, helping you determine the best moments to close a position or change your trading strategy. Now you can respond promptly to market changes.
- Overbought/Oversold Levels: The robot signals when a currency pair becomes overbought or oversold relative to its average value. These insights enable you to open opposing positions and capitalize even from unfavorable situations.
- Short-Cycle Analysis: DTC helps identify short cycles within broader market movements, offering excellent opportunities for intraday trading. Take advantage of every market fluctuation!
What makes DTC unique?
Synergy between trend and cycle analysis: DTC combines the best features of trend analysis and cyclical approaches, ensuring maximum accuracy in forecasting and managing your trades.
Don't miss the opportunity to enhance your trading performance! Dynamic Trend Cycles Robot (DTC) is your reliable partner in the world of finance.
Trust the professionals, trust DTC!