Visual Wave Cross Indicator
- Indicateurs
- AL MOOSAWI ABDULLAH JAFFER BAQER
- Version: 1.2
- Mise à jour: 12 mars 2025
- Activations: 5
Visual Wave Cross Indicator
Unlock the Power of Crossovers with Precision
The Visual Wave Cross Indicator is your gateway to mastering market dynamics through the interplay of price action and wave crossovers. Designed to visualize key market behaviors, this indicator provides traders with a unique perspective to identify potential entry and exit points.
Important Note: This indicator is not optimized. It has been created as a flexible tool for you to optimize according to your trading style and strategy.
What Does the Visual Wave Cross Indicator Do?
The indicator identifies the crossing points of wave movements in the price, signaling potential trend changes or continuation points. By combining a calculated algorithm of wave detection and precise crossover logic, this tool can be an invaluable resource for:
- Spotting emerging trends early
- Identifying optimal entry and exit points
- Understanding market reversals and momentum shifts
The Strategy and Entry Logic Behind the Visual Wave Cross Indicator
Wave Dynamics:
- The indicator detects price movements and calculates wave-like structures that naturally form in trending and ranging markets. Each wave is analyzed for its amplitude, duration, and velocity to determine its significance.
Crossover Logic:
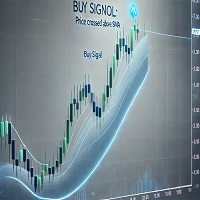
- When two specific waves intersect—indicating a change in momentum or direction—the Visual Wave Cross Indicator marks these points on the chart as potential actionable signals.
- Crossovers below or above certain thresholds signal bearish or bullish movements, giving you the advantage of timely decision-making.
Market Adaptability:
- This indicator is highly versatile, performing well in trending and ranging market conditions. While its core logic is universal, fine-tuning parameters will enhance its performance for your chosen asset or timeframe.
Why Choose the Visual Wave Cross Indicator?
- Customizable: Tailor it to your trading preferences for better synergy with your strategies.
- Clear Visuals: Each crossover point is visually marked, eliminating ambiguity in your analysis.
- Universal Application: Works across forex, stocks, commodities, and cryptocurrencies.
- Support for Optimization: You’re in control. Fine-tune and backtest it to maximize its potential.
Need Support?
If you have any questions or require assistance, feel free to contact me via direct message. I am here to help you make the most of this tool.
Explore More:
Visit my MQL5 profile to discover other powerful tools and Expert Advisors that can elevate your trading game.
Why Wait?
Add the Visual Wave Cross Indicator to Your Toolkit Today for Just $65! Start optimizing and uncover the potential hidden within your charts!
