• Aperçu
  • Avis
  • Commentaires

NTL HLines

HLines User Guide

Overview and Features

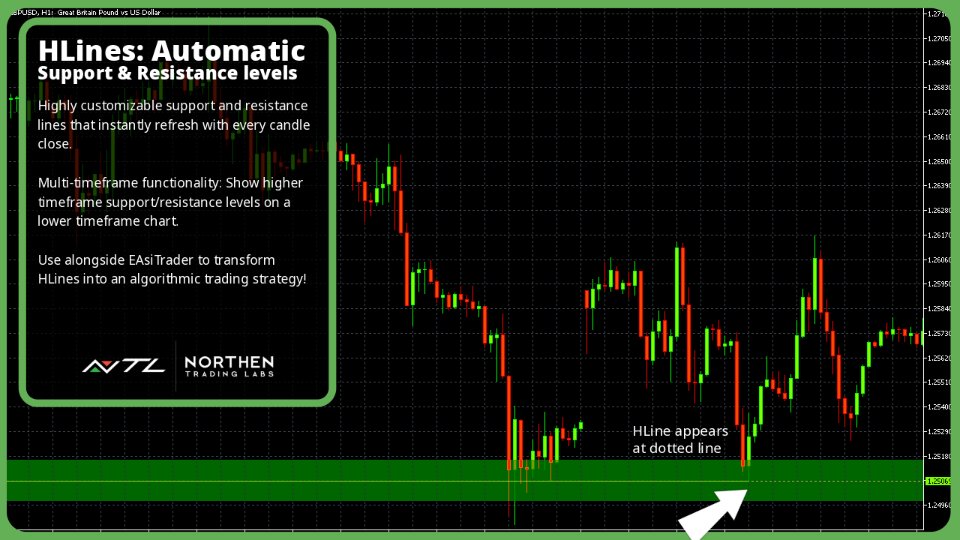
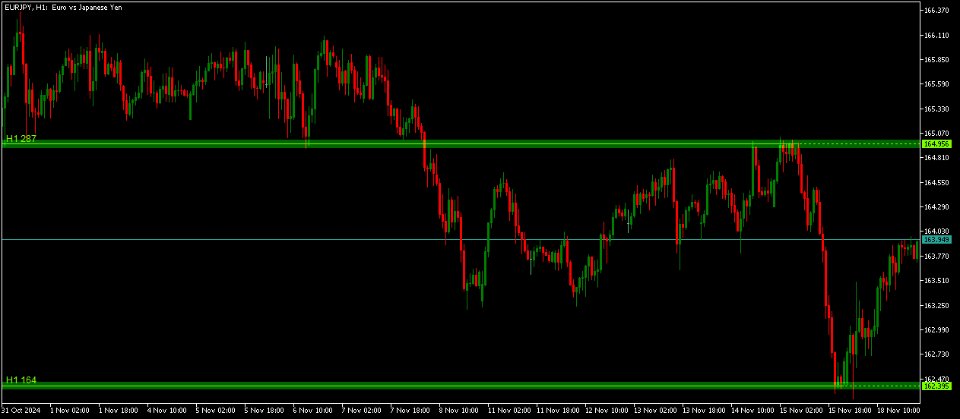
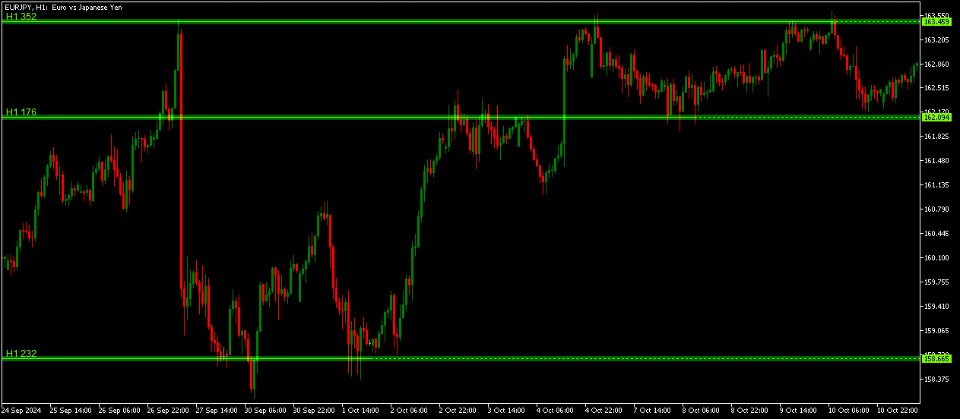
The NTL HLines Indicator is designed to elevate your trading with precise support and resistance analysis. Utilizing a sophisticated algorithm, this MQL5 indicator scans for high-probability price levels across multiple timeframes, helping traders pinpoint strategic entry and exit zones. With fully customizable pivot scanning and multi-timeframe support, HLines provides a powerful, adaptable toolset for traders of all experience levels.

Key features include customizable Pivot String and Pivot Order settings, allowing traders to define unique patterns of support and resistance pivots. HLines automatically adjusts these levels in real time, reducing subjectivity and maintaining clarity in fast-moving markets. This indicator is compatible with the EAsiTrader EA, offering seamless integration for automated trading strategies. Whether you’re focused on short-term trading or longer-term trend analysis, HLines helps you make data-driven decisions with greater confidence.

Key Features

  • Custom Pivot Scanning
    This feature allows traders to search key pivot points within price action for specific sequences of support and resistance pivots, such as a strong support level followed by a key resistance level, or any custom-defined combination that aligns with their strategy enabling traders to spot optimal entry and exit points with greater confidence.

  • Automatic Line Adjustments
    Continuously updates support and resistance lines to reflect the latest market data, allowing traders to maintain a clear view of critical price zones in real time and stay focused on strategic decision-making.

  • Customizable Settings for Line Sensitivity
    Allows traders to adjust the sensitivity of line generation to suit their unique trading strategy, from short-term scalping to long-term positioning.

  • Multi-Timeframe Scanning: Whether trading on the 1-minute chart or the monthly chart, HLines adapts seamlessly, allowing users to examine support and resistance lines across multiple timeframes, from intra-day to long-term perspectives. Note: To use this feature effectively, fully load tick data for your desired timeframe.

  • Reduces Subjectivity: Manual identification of patterns can be subjective, while HLines applies consistent criteria.

  • Compatible with EAsiTrader EA: Provides signals to NTL EAsiTrader EA for automated trading.

Installation and Settings

This section provides the installation steps for setting up the HLines indicator on the MQL5 platform, as well as detailed explanations of customizable settings to configure it for optimal performance.

Installation

  1. Install the Indicator:

    • Download the HLines indicator file (HLines.ex5) and place it in the  Indicators\NTL  folder in your MQL5 platform directory. If this folder does not exist, create it manually.
    • Typical path:  Terminal -> MQL5 -> Indicators -> NTL . Restart the platform to make the indicator appear in the Navigator panel.
  2. Apply to a Chart:

    • Open your desired chart, select the symbol and timeframe.
    • Drag the HLines indicator from the Navigator panel onto your chart.
    • Configure the Input settings to customize HLines, display options, and other parameters.
  3. Customize Settings:

    • Access the Input settings by double-clicking the indicator on the chart or through the Navigator panel.
  4. Save as Template:

    • Save your preferred settings as a template by right-clicking on the chart and selecting  Template -> Save Template . Give it a descriptive name like  HLines_Custom  for easy access.

Settings

Timeframe

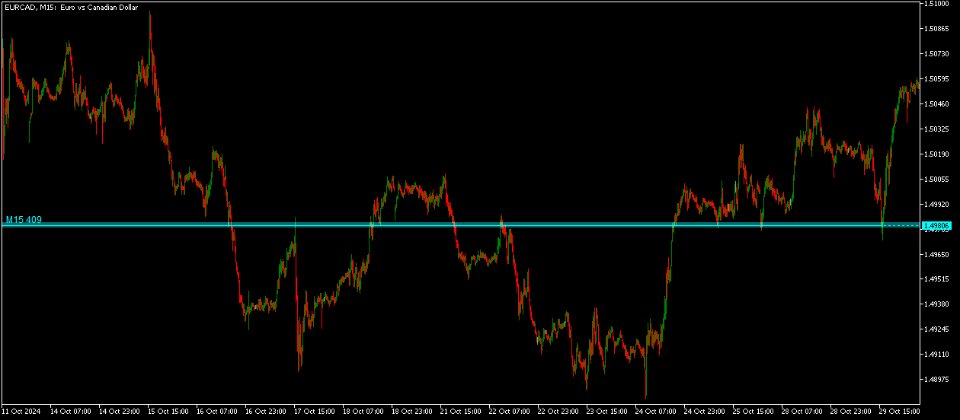
This setting allows you to select the specific timeframe from which HLines will analyze price data, regardless of the chart’s current timeframe. This feature is helpful if you want to analyze support and resistance lines on a higher or lower timeframe than the one currently displayed, giving you a multi-timeframe perspective.

Min Line Strength

Line strength is a measure of the support or resistance line’s importance relative to other lines. Use this setting to specify the minimum strength value of a line that can be shown on the chart. Use values between 20 and 1000.

Pivot String

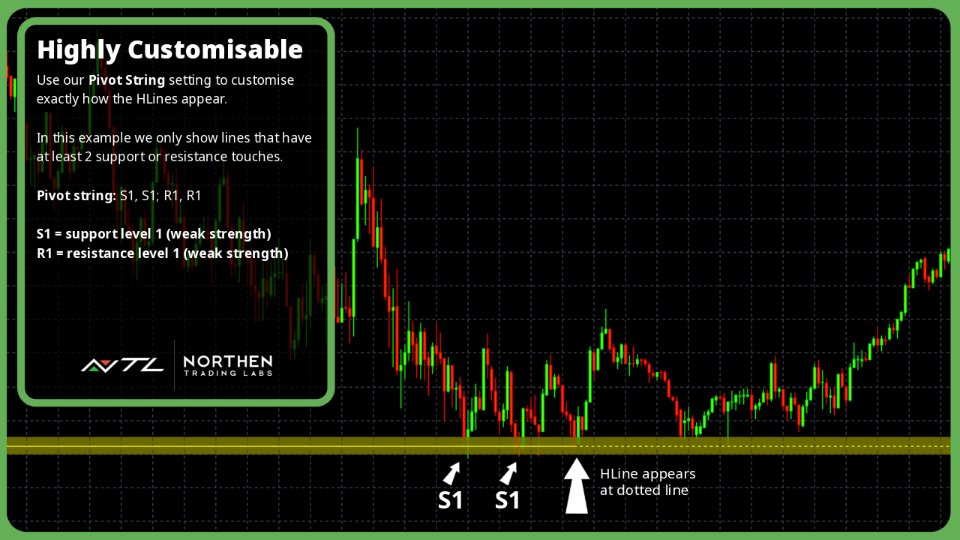
Use this setting to filter line patterns according to their pivot order values. The default value is “S2;R2” meaning HLines will find all support lines with a pivot order value of 2 or more and resistance lines with a pivot order value of 2 or more. Here are more examples:
"S3": matches support lines that have a 3 or greater pivot order value.
"R3": matches resistance lines that have a 3 or greater pivot order value.
"S2;S3": matches support lines that have a 2 or greater pivot order value, or resistance lines that have a 3 or greater pivot order value.
"S3,R3": matches support lines that have a 3 or greater pivot order value followed by a resistance line that has a 3 or greater pivot order. For example, a down trend that finds support, breaks and then find resistance.
"R3,S3": matches resistance lines that have a 3 or greater pivot order value followed by a support line that has a 3 or greater pivot order. For example, an up trend that finds resistance, breaks and then find support.
"S3,R3;R3,S3": matches support lines that have a 3 or greater pivot order value followed by a resistance line that has a 3 or greater pivot order. Or, matches resistance lines that have a 3 or greater pivot order value followed by a support line that has a 3 or greater pivot order.

Max Body Crosses

Defines the maximum number of candle bodies that the support or resistance line can cross before being excluded as a support or resistance line.

Pivot Weight

Defines the tolerance around a candle’s high and low and candle’s body high and body low when calculating line strength and body cross. The smaller this value the less tolerance, meaning support and resistance lines are more precise. More precision usually results in fewer lines.

Overlap Tolerance

Defines the tolerance, in average body height, between adjacent lines of support or resistance. It is used to decide if two adjacent lines should be considered the same line or separate lines. A smaller tolerance will produce more lines whilst a larger tolerance will produce less lines.

ABH Period

Defines the period for the ABH (Average Bar Height) Indicator. HLines uses the ABH Indicator in its calculations to set the value of an average bar height and average body height.

ABH Zone Multiplier

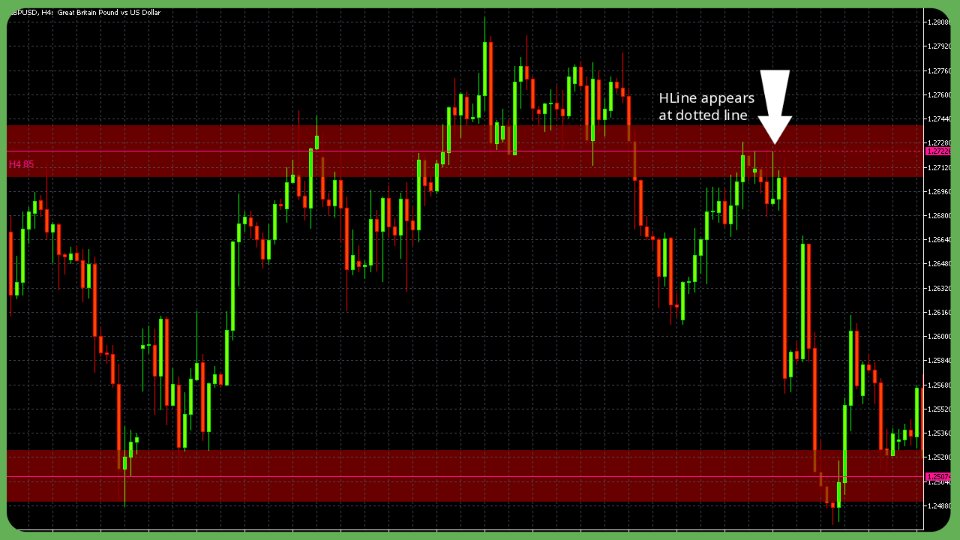
Defines the size of an HLine draw zone above and below the support or resistance lines as a ratio of the average bar height at the time the line is created. A multiplier value of 1.0 draws a zone of half ABH ** 1.0 above and below the line. A multiplier value of 1.5 draws a zone of half ABH * 1.5 above and below the line.

ABH Show Zones

If true, the indicator will draw the zone above and below the lines. If false, no zones are drawn. The zone is an area drawn on the chart above and below each line, whose size is a ratio of the average bar height at the time the line is created. These edges of the zones can be used by traders to set entry, stop loss or take profit prices.

New HLine Alerts

If true, the trader will be alerted with a message in a separate window whenever a new support or resistance line is created. The message includes the symbol, timeframe, local time of the alert and the symbol’s price the line was created. Optionally, a push notification can also be sent to a mobile device.  Tools -> Options -> Notifications

Font Size

Defines the size of font to be used to display the timeframe and strength values on the HLine.

Chart Label Style

Determines the style used to display the timeframe and strength values on the HLine. Use Label to show this information as a simple label, or use Boxed to show the information inside a rectangle box.

Chart Edge Alignment

Allows the trader to align the HLine text content to the left or right edge of the chart.

Advanced Usage and Strategy Integration

Static HLines

To fix an HLine so that it doesn’t get removed when new candles are added, simply click on the HLine - the word Static will appear above the line. Click again to return the HLine to normal.

Leverage HLines to refine complex trading strategies by integrating advanced pivot and support/resistance analysis:

  1. Custom Pivot Sequence for Targeted Signal Generation
    With the Pivot String and Pivot Order settings, traders can construct personalized sequences of support and resistance pivots, enabling focused searches for specific patterns that align with their strategy. For example, combining a high-order support pivot (e.g. S3) followed by a resistance pivot (e.g. R3) can highlight zones of strong trend reversals, providing actionable signals that fit into trend-based or mean-reversion strategies.

  2. Multi-Timeframe Analysis for Strategic Depth
    By configuring HLines to scan higher timeframes, traders can identify significant support and resistance levels from daily or weekly charts while trading on shorter timeframes. This setup allows for more comprehensive analysis, helping to validate signals against broader market trends or longer-term levels.

  3. Dynamic Zone Creation for Entry and Exit Management
    The ABH Zone Multiplier helps define adaptive zones around each line, offering flexible areas where traders can place entry, stop loss, or take profit levels. These zones, based on average bar height, provide a buffer that accommodates minor fluctuations, especially useful in volatile markets.

  4. Automated Alerts for Real-Time Strategy Execution
    HLines can be configured to alert traders when new support or resistance levels are detected. This feature is especially beneficial for strategies that require quick reactions to emerging levels, enabling prompt entries or exits based on the latest market data.

  5. Seamless Integration with EAsiTrader for Automated Trading
    Compatible with NTL’s EAsiTrader EA, the indicator provides automated trading capabilities by sending signals directly to the EA. This feature allows traders to combine manual analysis with automated trade execution, aligning with sophisticated strategies that depend on precision timing.

Insights

Gain deeper insights into market structure and dynamics with HLines’ analytical features:

  1. Pivot Order Depth and Market Significance
    High-order pivots reflect more stable, recurring price levels, suggesting strong support or resistance zones. By focusing on high-order pivots, traders can identify areas with increased probability of price reversal, helping them anticipate potential breakout or reversal points with greater accuracy.

  2. The Role of Sequence in Support and Resistance Strength
    The customizable Pivot String enables traders to spot pivotal sequences, such as a resistance pivot followed by a support pivot, which may indicate a potential shift in market direction. Recognizing these sequences enhances a trader’s ability to interpret market sentiment, allowing for strategic alignment with prevailing trends.

  3. Min Line Strength and Volatility Sensitivity
    The Min Line Strength setting aids in filtering noise by ensuring only significant lines appear on the chart, reducing clutter and focusing attention on levels that are more likely to hold. This sensitivity adjustment is particularly useful in high-volatility periods, where less reliable levels are automatically excluded.

  4. Adaptive Tolerance for Precision Analysis
    The Overlap Tolerance and Pivot Weight settings allow traders to fine-tune the precision of the support and resistance lines, accommodating their specific needs for broader or narrower levels. This flexibility provides an edge in adapting the indicator’s analysis to both trending and ranging market conditions.

Terms

Pivot Order

Ordering pivots ranks price highs and lows based on their significance. The higher the order, the more significant the price compared to lower-ordered pivots.

  • a 0 order high pivot is a bar without a lower high bar on its immediate left (older) and right (newer).
  • a 0 order low pivot is a bar without a higher low bar on its immediate left (older) and right (newer).
  • a 1 order high pivot is a bar with a lower high bar on its immediate left and right.
  • a 1 order low pivot is a bar with a higher low bar on its immediate left and right.
  • a 2 order high pivot is a bar with a 1 order high pivot on its left and right.
  • a 2 order low pivot is a bar with a 1 order low pivot on its left and right.
  • a 3 order pivot has a 2 order pivot on its left and right.
  • a 4 order pivot has a 3 order pivot on its left and right, and so on.

Rev:10.11.2024

Produits recommandés
Transaction Data Analysis Assistant: This is a statistical analysis tool for transaction data, and there are many data charts for analysis and reference. language: Support language selection switch (currently supports Chinese and English active recognition without manual selection) The main window shows: Balance display Total profit and loss display Now the position profit and loss amount is displayed Now the position profit and loss ratio is displayed The total order volume, total lot size, and
FREE
Market Steps MT5
Mahdi Ebrahimzadeh
L'indicateur Market Steps est conçu et construit sur la base des corrélations temps/prix de Gann et optimisé par des règles de Price Action spécifiques au marché Forex. Il utilise les concepts de flux d'ordres du marché pour prédire les zones de prix potentielles pour un volume élevé d'ordres.  L'indicateur Levels peut être utilisé pour le trading lui-même ou comme une combinaison pour filtrer les signaux erronés d'autres stratégies/indicateurs. Chaque trader a besoin d'un outil aussi puissant
This is a simple arrow system based on Engulfing Candlestick Pattern. It gives you alerts on your smartphone when there is an engulfing candlestick pattern happens. Which type of alerts available? 1. It paints on chart Up/Down Arrows. 2. Popup message and sound alert in trading terminal window. 3. Push notification or Alert on your Android and IOS mobile phones (requires MT4 or MT5 app installed!) *Note: Use it on higher timeframes like H4 (4 hours), D1 (1 Day) then find trade opportunities on s
KT Candlestick Patterns Scanner is a Multi-Symbol and Multi-Timeframe scanner that fetches and shows various candlestick patterns on 28 currency pairs and 9 time-frames concurrently . The scanner finds the candlestick patterns by loading the KT Candlestick Patterns indicator as a resource in the background. Features The scanner can find the candlestick patterns on 252* combinations of symbols and time-frames from a single chart. Open the signal's chart loaded with a predefined template with a s
Pro Thunder V10 : L’indicateur ultime pour le trading d’options binaires ! Élevez votre trading à un niveau supérieur avec Pro Thunder V10 , l'apogée du trading d'options binaires ! Propulsé par la technologie avancée de réseaux neuronaux IA , cet indicateur révolutionnaire est conçu pour offrir une précision et une fiabilité inégalées. Des signaux en temps réel qui ne se repeignent pas jusqu’à des performances impeccables, même sur des marchés volatils, Pro Thunder V10 est votre allié
MTF MultiMeter5
GRANTLEY LAURENCE CAUSE
Benefits: A new and innovative way of looking across multiple timeframes and multiple indicators on any chart. Provides instant multi-timeframe analysis of any market. i.e. forex currency pairs, cryptocurrency pairs, commodities, etc. It offers precise indications across multiple timeframes of volatility as measured by RSI, ADX and STOCH within one chart. Helps you determine high probability trading setups. See example strategy in comments. Can see bullish/bearish volatility building across mult
Auto3M Pro MT5
Mr Anucha Maneeyotin
3.33 (3)
AUTO3M Pro MT5 – Advanced Automated Trading Expert Advisor Smart, Reliable, and Efficient Trading Automation AUTO3M Pro MT5 is a fully automated Expert Advisor designed to analyze market conditions using a combination of technical indicators (including   MACD, EMA, SMA, STD, MFI, and ATR ) to execute trades with precision. Key Features   Adaptive Strategy   – Dynamically adjusts to market changes.   Multi-Asset Compatibility   – Works on   Forex, Gold, and Cryptocurrencies .   Flexible Tim
The "Super Trend Alert MT5" is an indicator designed for the MetaTrader 5 (MT5) trading platform. The specific details and functionality of this indicator may depend on the version or settings you are using. The Super Trend indicator is a popular technical analysis tool that helps identify the direction of the current market trend. It is displayed as a line on the price chart and is accompanied by alerts to notify traders of potential trend changes. To use the "Super Trend Alert MT5" indicator i
Le Capteur de Tendance : La Stratégie du Capteur de Tendance avec Indicateur d'Alerte est un outil d'analyse technique polyvalent qui aide les traders à identifier les tendances du marché et les points d'entrée et de sortie potentiels. Elle présente une stratégie dynamique de Capteur de Tendance, s'adaptant aux conditions du marché pour une représentation visuelle claire de la direction de la tendance. Les traders peuvent personnaliser les paramètres selon leurs préférences et leur tolérance a
FREE
AXIS Neural EA for MT5
Enrique Enguix
4.69 (13)
Vas-tu continuer à regarder les autres gagner, ou es-tu prêt à vraiment entrer dans le jeu ? NODE Neural EA était l’échauffement. AXIS est le vrai match. C’est ici que tu commences à jouer sérieusement. AXIS Neural EA Ce n'est pas juste un autre EA. C'est le système utilisé par les traders qui savent ce qu'ils font. Trade sur EUR/USD, GBP/USD et AUD/USD – Il ne se contente pas de diversifier, il maximise tes opportunités sur les paires les plus liquides. Rendement mensuel historique de 4,74 % –
The Easy Trend Trading Indicator delivers quick and accurate BUY/SELL signals, ensuring that traders can make timely decisions. It works flawlessly across various timeframes and supports all symbols, making it a versatile tool for any market. Whether you're trading short-term or long-term, this indicator adapts to your needs with ease. Quick Setup: Simply "Enable" the indicator via input settings With a low memory footprint, the indicator is designed for efficiency, ensuring smooth performance e
Visual EMA Trend Force Indicator
AL MOOSAWI ABDULLAH JAFFER BAQER
VisualEMA TrendForce Indicator — Empower Your Trading with Precision Price: $65 Discover a Smarter Way to Trade with EMAs! The VisualEMA TrendForce Indicator is designed to elevate your trading with a reliable and visually intuitive trend-following system. Leveraging the power of Exponential Moving Averages (EMAs), this indicator provides actionable buy and sell signals based on dynamic market conditions, enabling traders to capture profitable trends with confidence. Core Features: Dynamic EMA
Support Resistance Breakout 2
Sylvestre Setufa Djagbavi
INTRODUCTION   Do you want to make money with trading robots Read this. Before investing in a trading robot, take a moment to understand what it entails. Trading is a game of probabilities. No one can guarantee a profit on every trade or every month. What truly matters is long-term profitability. My robots are designed with this reality in mind. They have been rigorously backtested and optimized to maximize the chances of success in real mar
ROMAN5 Time Breakout Indicator automatically draws the boxes for daily support and resistance breakouts. It helps the user identifying whether to buy or sell. It comes with an alert that will sound whenever a new signal appears. It also features an email facility. Your email address and SMTP Server settings should be specified in the settings window of the "Mailbox" tab in your MetaTrader 5. Blue arrow up = Buy. Red arrow down = Sell. You can use one of my Trailing Stop products that automatical
FREE
CChart
Rong Bin Su
Overview In the fast-paced world of forex and financial markets, quick reactions and precise decision-making are crucial. However, the standard MetaTrader 5 terminal only supports a minimum of 1-minute charts, limiting traders' sensitivity to market fluctuations. To address this issue, we introduce the Second-Level Chart Candlestick Indicator , allowing you to effortlessly view and analyze market dynamics from 1 second to 30 seconds on a sub-chart. Key Features Support for Multiple Second-Level
Manyal trading system, CovEchoTrend Robot, focuses on reliability and flexibility. By employing statistical analysis methods to study the relationships between the base indicator and market patterns, the system enables a deeper understanding of market processes. Intelligent pattern analysis: The application of statistical data processing helps identify key trend reversal points more accurately, signaling significant market shifts. Informed decision-making is based on the intersection of indicato
L'une des séquences de numéros s'appelle « Séquence des incendies de forêt ». Il a été reconnu comme l'une des plus belles nouvelles séquences. Sa principale caractéristique est que cette séquence évite les tendances linéaires, même les plus courtes. C'est cette propriété qui a constitué la base de cet indicateur. Lors de l'analyse d'une série chronologique financière, cet indicateur essaie de rejeter toutes les options de tendance possibles. Et seulement s'il échoue, il reconnaît alors la prés
Free automatic Fibonacci is an indicator that automatically plots a Fibonacci retracement based on the number of bars you select on the BarsToScan setting in the indicator. The Fibonacci is automatically updated in real time as new highest and lowest values appears amongst the selected bars. You can select which level values to be displayed in the indicator settings. You can also select the color of the levels thus enabling the trader to be able to attach the indicator several times with differe
FREE
Binary Options Assistant (BOA) BOIL Signals Indicator provides signals based on Ana Trader Binary Options Strategy. Indicators: Stochastic Stop missing trades, stop jumping from chart to chart looking for trade set-ups and get all the signals on 1 chart! U se any of the BOA Signals Indicator with the  Binary Options Assistant (BOA) Multi Currency Dashboard .  All BOA Signal Indicator settings are adjustable to give you more strategy combinations. The signals can be seen visually and heard audi
LT Candle Counter
Thiago Duarte
5 (3)
Candle Counter is a simple indicator that list the amout of candles in the day according to the current chart timeframe. It is specially useful for those teaching others how to trade, as it can draw attention to a specific candle of the day. Configuration: Reverse mode - if on, the actual candle is the first one. Position - Above or below the candles. Vertical distance - Vertical distance from the candles in pipets/points. Size - Font size. If you need help please don't hesitate to contact me.
FREE
This trading strategy is suitable for USDJPY only, with an average annualized rate of return 20%~25% Trading conditions reminder: Select the USDJPY currency pair; Initial deposit: >= 1000USD; Leverage: >1:100; 1:500 mode is recommended; This strategy is a fully automated trading script, no need to manually open and close positions; of course, it also supports manual opening and closing; If you are pursuing stable and steady growth, please choose it. P.S  Patience and perseverance are always r
SyncDB LT
Maxim Kuznetsov
A   service   to   keep   the   SQLite   database up   to   date .   Fast   real -t ime   operation .   Saves   open   positions   and   orders ,   current   quotes ,   and   trading   history .   Take   advantage   of   SQLite 's   capabilities   for   intermediate   data   storage ,   analytics ,   and   integration   of the   MetaTrader   platform .   Save   all   your   data   in   one   place .   Use   the   saved   data   in   SQL   analytical   queries ,   from   Python   and   other   la
FREE
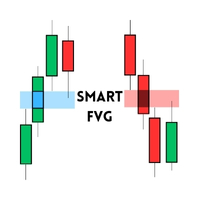
Smart FVG Indicator – Advanced Fair Value Gap Detection for MT5 Enhance Your Trading with the Smart FVG Indicator! Are you looking to identify Fair Value Gaps (FVGs) effectively and integrate them into your trading strategy? The Smart FVG Indicator for MetaTrader 5 (MT5) offers a comprehensive solution to detect and utilize FVGs, providing you with a trading edge. Key Features: Dynamic FVG Detection: Automatically scans and highlights FVGs on your charts, indicating potential institutional
FREE
Are you tired of drawing trendlines every time you're analyzing charts? Or perhaps you would like more consistency in your technical analysis. Then this is for you. This indicator will draw trend lines automatically when dropped on a chart. How it works Works similar to standard deviation channel found on mt4 and mt5. It has 2 parameters: 1. Starting Bar 2. Number of bars for calculation The   starting bar   is the bar which drawing of the trend lines will begin, while the   number of bars for c
FREE
SR Arrows mt5
Natasha Diedericks
This indicator gives you arrows, two SR lines and a golden trend line. Uses a special trend algorithm to plot the arrows, combined with support and resistance inputs. Perfect for channel trading. Features alert functions. Parameter TrendArrowPeriod. Parameter TrendLinePeriod. (Change to your preference) How to use: Simply attach to any chart with default settings. Zoom in the chart, to see the two blue SR lines and arrows more clearly. When the blue SR line is below the price, golden trend line
Range Directional Force Indicator – Designed for You to Optimize! The Range Directional Force Indicator is a cutting-edge tool designed to empower traders by visualizing market dynamics and directional strength. Built to offer insights into market trends and reversals, this indicator is an invaluable asset for traders seeking precision in their strategies. However, it is important to note that this indicator is not optimized, leaving room for you to tailor it to your unique trading preferences.
Follow The Line MT5
Oliver Gideon Amofa Appiah
4.52 (29)
This indicator obeys the popular maxim that: "THE TREND IS YOUR FRIEND" It paints a GREEN line for BUY and also paints a RED line for SELL. (you can change the colors). It gives alarms and alerts of all kinds. IT DOES NOT REPAINT and can be used for all currency pairs and timeframes. Yes, as easy and simple as that. Even a newbie can use it to make great and reliable trades. NB: For best results, get my other premium indicators for more powerful and reliable signals. Get them here: https://www.m
FREE
Binary Options Assistant (BOA) BURN Signals Indicator provides signals based on Ana Trader Binary Options Strategy. Indicators: MACD & Stochastic Stop missing trades, stop jumping from chart to chart looking for trade set-ups and get all the signals on 1 chart! U se any of the BOA Signals Indicator with the  Binary Options Assistant (BOA) Multi Currency Dashboard .  All BOA Signal Indicator settings are adjustable to give you more strategy combinations. The signals can be seen visually and hear
20 Sources, Non-Repainting, Fast Performance Introducing the All-In-One Supertrend: my first attempt at creating the ultimate trading tool. Designed with flexibility and customization in mind, each source is fully adjustable and integrates seamlessly with the others, allowing you to craft a strategy that fits your unique trading style, without compromising on speed or performance. General settings (applicable across all sources): ATR Period ATR Multiplier Change ATR Calculation [when switched
Trend Screener Pro MT5
STE S.S.COMPANY
4.85 (80)
Indicateur de tendance, solution unique révolutionnaire pour le trading et le filtrage des tendances avec toutes les fonctionnalités de tendance importantes intégrées dans un seul outil ! Il s'agit d'un indicateur multi-période et multi-devises 100 % non repeint qui peut être utilisé sur tous les symboles/instruments : forex, matières premières, crypto-monnaies, indices et actions. Trend Screener est un indicateur de suivi de tendance efficace qui fournit des signaux de tendance fléchés avec des
Les acheteurs de ce produit ont également acheté
Golden Trend Indicator MT5
Noha Mohamed Fathy Younes Badr
4.89 (18)
Golden Trend indicator  is The best indicator for predicting trend movement this indicator never lags and never repaints and never back paints    and give  arrow buy and sell    before the candle appear  and it will help you and  will make your trading decisions clearer its work on all currencies and  gold and crypto and all time frame This unique  indicator uses very secret algorithms to catch the  trends, so you can trade using this indicator and see the trend clear on charts  manual guide and
Quantum TrendPulse
Bogdan Ion Puscasu
5 (13)
Présentation de   Quantum TrendPulse   , l'outil de trading ultime qui combine la puissance de   SuperTrend   ,   RSI   et   Stochastic   dans un seul indicateur complet pour maximiser votre potentiel de trading. Conçu pour les traders qui recherchent précision et efficacité, cet indicateur vous aide à identifier les tendances du marché, les changements de dynamique et les points d'entrée et de sortie optimaux en toute confiance. Caractéristiques principales : Intégration SuperTrend :   suivez f
MTF Supply Demand Zones MT5
Georgios Kalomoiropoulos
5 (1)
Nouvelle génération de zones d'approvisionnement et de demande automatisées. Algorithme nouveau et innovant qui fonctionne sur n'importe quel graphique. Toutes les zones sont créées dynamiquement en fonction de l'action des prix du marché. DEUX TYPES D'ALERTES --> 1) QUAND LE PRIX ATTEINT UNE ZONE 2) QUAND UNE NOUVELLE ZONE SE FORME Vous n'obtenez pas un indicateur inutile de plus. Vous obtenez une stratégie de trading complète avec des résultats prouvés.     Nouvelles fonctionnalités:   
TPSpro RFI Levels MT5
Roman Podpora
4.55 (20)
Zones de retournement / Volumes de pointe / Zones actives d'un acteur majeur =       SYSTÈME TS TPSPRO INSTRUCTIONS RUS       /       INSTRUCTIONS       FR       /           Version MT4        Chaque acheteur de cet indicateur reçoit en plus GRATUITEMENT : 6 mois d'accès aux signaux de trading du service RFI SIGNALS - points d'entrée prêts à l'emploi selon l'algorithme TPSproSYSTEM. Supports de formation avec mises à jour régulières - plongez-vous dans la stratégie et développez votre niveau p
MetaBands M5
Vahidreza Heidar Gholami
4.5 (2)
MetaBands uses powerful and unique algorithms to draw channels and detect trends so that it can provide traders with potential points for entering and exiting trades. It’s a channel indicator plus a powerful trend indicator. It includes different types of channels which can be merged to create new channels simply by using the input parameters. MetaBands uses all types of alerts to notify users about market events. Features Supports most of the channel algorithms Powerful trend detection algorith
The   Time_Price_SQ9_Degree   indicator is based on the 9 Gann square. Using this indicator, you can identify strong time and price zones. The indicator displays the levels as a degree value. The degrees can be set in the settings. After launching, the MENU button appears. If it is highlighted, it can be moved to any point on the graph, and after double-clicking on it, it stops being highlighted and menu buttons appear. To hide the menu, just double-click on the button, it will become highlight
Top indicator for MT5   providing accurate signals to enter a trade without repainting! It can be applied to any financial assets:   forex, cryptocurrencies, metals, stocks, indices .  Watch  the video  (6:22) with an example of processing only one signal that paid off the indicator! MT4 version is here It will provide pretty accurate trading signals and tell you when it's best to open a trade and close it. Most traders improve their trading results during the first trading week with the help of
RelicusRoad Pro MT5
Relicus LLC
4.78 (18)
Maintenant 147 $ (augmentant à 499 $ après quelques mises à jour) - Comptes illimités (PCS ou Mac) Manuel d'utilisation RelicusRoad + Vidéos de formation + Accès au groupe Discord privé + Statut VIP UNE NOUVELLE FAÇON DE REGARDER LE MARCHÉ RelicusRoad est l'indicateur de trading le plus puissant au monde pour le forex, les contrats à terme, les crypto-monnaies, les actions et les indices, offrant aux traders toutes les informations et tous les outils dont ils ont besoin pour rester rentables
DESCRIPTION ICSM (Impulse-Correction SCOB Mapper) est l'indicateur qui analyse le mouvement des prix et identifie les impulsions valides, les corrections et les SCOB (Single Candle Order Block). C'est un outil puissant qui peut être utilisé avec tout type d'analyse technique car il est flexible, informatif, facile à utiliser et améliore considérablement la conscience du trader des zones d'intérêt les plus liquides. PARAMÈTRES Général | Visuels Thème de couleur — définit le thème de couleur
Blahtech Supply Demand MT5
Blahtech Limited
4.54 (13)
Was: $299  Now: $149  Supply Demand uses previous price action to identify potential imbalances between buyers and sellers. The key is to identify the better odds zones, not just the untouched ones. Blahtech Supply Demand indicator delivers functionality previously unavailable on any trading platform. This 4-in-1 indicator not only highlights the higher probability zones using a multi-criteria strength engine, but also combines it with multi-timeframe trend analysis, previously confirmed swings
[ MT4 Version ]  [ Order Blocks ]  [ Kill Zones ]  [ SMT Divergences ] How to trade using Order Blocks :  Click here User Interface Performance:  During testing in the strategy tester, the UI may experience lag. Rest assured, this issue is specific to the testing environment and does not affect the indicator's performance in live trading. Elevate your trading strategy with the  Order Blocks ICT Multi TF  indicator, a cutting-edge tool designed to enhance your trading decisions through advanced o
Precision trading: leverage wolfe waves for accurate signals Wolfe Waves are naturally occurring trading patterns present in all financial markets and represent a fight towards an equilibrium price. These patterns can develop over short and long-term time frames and are one of the most reliable predictive reversal patterns in existence, normally preceding strong and long price movements. [ Installation Guide | Update Guide | Troubleshooting | FAQ | All Products ] Clear trading signals Amazingly
IQ Gold Gann Levels a non-repainting, precision tool designed exclusively for XAUUSD/Gold intraday trading. It uses W.D. Gann’s square root method to plot real-time support and resistance levels, helping traders spot high-probability entries with confidence and clarity. William Delbert Gann (W.D. Gann) was an exceptional market analyst, whose trading technique was based on a complex blend of mathematics, geometry, astrology, and ancient mathematics which proved to be extremely accurate. Download
Was: $249  Now: $149   Market Profile defines a number of day types that can help the trader to determine market behaviour. A key feature is the Value Area, representing the range of price action where 70% of trading took place. Understanding the Value Area can give traders valuable insight into market direction and establish the higher odds trade. It is an excellent addition to any system you may be using. Inspired by Jim Dalton’s book “Mind Over Markets”, this indicator is designed to suit the
L'oscillateur de l'indice de précision (Pi-Osc) de Roger Medcalf de Precision Trading Systems La version 2 a été soigneusement recodée pour être ultra-rapide à charger sur votre graphique, et quelques autres améliorations techniques ont été incorporées pour améliorer l'expérience. Le Pi-Osc a été créé pour fournir des signaux de synchronisation de trading précis conçus pour trouver des points d'épuisement extrêmes, les points auxquels les marchés sont contraints d'aller simplement pour élimin
Trade smarter, not harder: Empower your trading with Harmonacci Patterns This is arguably the most complete harmonic price formation auto-recognition indicator you can find for the MetaTrader Platform. It detects 19 different patterns, takes fibonacci projections as seriously as you do, displays the Potential Reversal Zone (PRZ) and finds suitable stop-loss and take-profit levels. [ Installation Guide | Update Guide | Troubleshooting | FAQ | All Products ] It detects 19 different harmonic pri
Advanced Supply Demand MT5
Bernhard Schweigert
4.5 (14)
La meilleure solution pour tout commerçant débutant ou expert ! Cet indicateur est un outil de trading unique, de haute qualité et abordable car nous avons intégré un certain nombre de fonctionnalités propriétaires et une nouvelle formule. Avec cette mise à jour, vous pourrez afficher des zones à double horaire. Vous pourrez non seulement afficher un TF plus élevé, mais afficher les deux, le graphique TF, PLUS le TF supérieur : AFFICHAGE DES ZONES NICHÉES. Tous les traders Supply Demand vont ado
This indicator is a classic implementation of the Market Profile (Volume Profile Visible Range), allowing for the display of price density over time while highlighting the most significant price levels, the value area, and the control price within a specific trading session. MT4-version:   https://www.mql5.com/en/market/product/125261 The indicator can be applied across timeframes from M1 to D1, enabling the analysis of market profiles for daily, weekly, monthly, or intraday trading. Utilizing
KT Candlestick Patterns MT5
KEENBASE SOFTWARE SOLUTIONS
KT Candlestick Patterns identifie et marque en temps réel les 24 figures de chandeliers japonais les plus fiables. Depuis le 18e siècle, les traders japonais utilisent ces figures pour prévoir la direction des prix. Il est vrai que tous les modèles ne se valent pas, mais lorsqu’ils sont combinés à des méthodes comme les supports et résistances, ils offrent une lecture plus précise du marché. Cet indicateur inclut de nombreux motifs étudiés en détail dans le livre de Steve Nison : "Japanese Can
CBT Quantum Maverick Système de Trading Binaire Haute Efficacité CBT Quantum Maverick est un système de trading binaire hautement performant, conçu pour les traders recherchant précision, simplicité et discipline. Aucune personnalisation n'est nécessaire : ce système est optimisé pour des résultats efficaces dès son installation. Avec un peu de pratique, il est facile de maîtriser les signaux. Caractéristiques principales : Précision des signaux : Signaux basés sur la bougie actuelle, ciblant
MetaForecast M5
Vahidreza Heidar Gholami
5 (3)
MetaForecast prédit et visualise l'avenir de n'importe quel marché en se basant sur les harmoniques des données de prix. Bien que le marché ne soit pas toujours prévisible, s'il y a un motif dans les prix, MetaForecast peut prédire l'avenir aussi précisément que possible. Comparé à d'autres produits similaires, MetaForecast peut générer des résultats plus précis en analysant les tendances du marché. Paramètres d'entrée Past size (Taille passée) Spécifie le nombre de barres que MetaForecast util
Indicateur unique qui met en œuvre une approche professionnelle et quantitative pour signifier le trading de réversion. Il capitalise sur le fait que le prix dévie et revient à la moyenne de manière prévisible et mesurable, ce qui permet des règles d'entrée et de sortie claires qui surpassent largement les stratégies de trading non quantitatives. [ Installation Guide | Update Guide | Troubleshooting | FAQ | All Products ] Des signaux de trading clairs Étonnamment facile à échanger Couleurs et t
Volume by Price MT5
Brian Collard
3.25 (4)
Volume Profile, Footprint and Market Profile TPO (Time Price Opportunity). Volume and TPO histogram bar and line charts. Volume Footprint charts. TPO letter and block marker collapsed and split structure charts. Static, dynamic and flexible range segmentation and compositing methods with relative and absolute visualizations. Session hours filtering and segment concatenation with Market Watch and custom user specifications. Graphical layering, positioning and styling options to suit the user's a
Multi Currency Multi Time Market Scan Signals It is an Advanced multi-utility dashboard which works with full customization of signal settings and graphical interface. It works with Multi Symbols and Multi-Time frames from 1 SINGLE CHART TEMPLATE. It will automatically open the charts where the latest signals had formed- showing the important levels (Entry, Targets, Stop Loss) Many types of sorting methods for the scanner. A robust ENTRY based on  TREND OF MULTI-TIME FRAMES ( Complex Signals
Introducing Indicator for PainX and GainX Indices Traders on Weltrade Get ready to experience the power of trading with our indicator, specifically designed for Weltrade   broker's PainX and GainX Indices.  Advanced Strategies for Unbeatable Insights Our indicator employs sophisticated strategies to analyze market trends, pinpointing optimal entry and exit points.  Optimized for Maximum Performance To ensure optimal results, our indicator is carefully calibrated for 5-minute timeframe charts on
TPA True Price Action indicator reveals the true price action of the market makers through 100% non-repainting signals strictly at the close of a candle! TPA shows entries and re-entries, every time the bulls are definitely stronger than the bears and vice versa. Not to confuse with red/green candles. The shift of power gets confirmed at the earliest stage and is ONE exit strategy of several. There are available now two free parts of the TPA User Guide for our customers. The first "The Basics"
[ MT4 Version ] Are you tired of spending months on demo or live accounts to test your trading strategies? The Backtesting Simulator is the ultimate tool designed to elevate your backtesting experience to new heights. Utilizing Metatrader historical symbol information, it offers an unparalleled simulation of real market conditions. Take control of your testing speed, test ideas quickly or at a slower pace, and witness remarkable improvements in your testing performance. Forget about wasting tim
Berma Bands
Muhammad Elbermawi
5 (3)
L'indicateur Berma Bands (BB) est un outil précieux pour les traders qui cherchent à identifier et à capitaliser sur les tendances du marché. En analysant la relation entre le prix et les BB, les traders peuvent déterminer si un marché est dans une phase de tendance ou de range. Visitez le [ Berma Home Blog ] pour en savoir plus. Les bandes de Berma sont composées de trois lignes distinctes : la bande de Berma supérieure, la bande de Berma moyenne et la bande de Berma inférieure. Ces lignes sont
FxaccurateLS
Shiv Raj Kumawat
WHY IS OUR FXACCCURATE LS MT5 THE PROFITABLE ? PROTECT YOUR CAPITAL WITH RISK MANAGEMENT Gives entry, stop and target levels from time to time. It finds Trading opportunities by analyzing what the price is doing during established trends. POWERFUL INDICATOR FOR A RELIABLE STRATEGIES We have made these indicators with a lot of years of hard work. It is made at a very advanced level. Established trends provide dozens of trading opportunities, but most trend indicators completely ignore them! The
KT Trend Trading Suite MT5
KEENBASE SOFTWARE SOLUTIONS
KT Trend Trading Suite est un indicateur multifonction qui combine une stratégie de suivi de tendance avec plusieurs points de cassure servant de signaux d’entrée. Une fois qu’une nouvelle tendance est établie, l’indicateur fournit plusieurs opportunités d’entrée permettant de suivre la tendance efficacement. Un seuil de repli est utilisé pour éviter les points d’entrée moins significatifs. Version MT4 disponible ici  https://www.mql5.com/en/market/product/46268 Fonctionnalités Combine plus
Plus de l'auteur
EAsiTrader: Advanced Strategy Creation & Automation for MetaTrader 5 EAsiTrader is designed for those who want to eliminate the hassle of programming and drastically accelerate the process of creating Expert Advisors, making strategy development faster and more efficient. EAsiTrader is a versatile trading tool designed specifically for MetaTrader 5, providing automation features and a comprehensive set of tools to help users build, test, and refine and run trading strategies. EAsiTrader adapts
FREE
AutoFib: Advanced Fibonacci Retracement for MetaTrader 5 Automate Fibonacci Analysis for Smarter Trading Decisions AutoFib simplifies Fibonacci retracement analysis by automatically identifying key levels of support and resistance directly on your MT5 charts. Whether you're new to Fibonacci analysis or an advanced trader, AutoFib enhances your ability to identify potential reversals, continuations, and critical price levels. Key Features: Automatic Fibonacci Levels – Identify retracement and ext
Japanese Candle Patterns (JCP) User Guide Overview and Features Japanese candlestick patterns, a foundational element of technical analysis, provide traders with visual insights into market psychology. Each pattern represents the battle between bulls and bears, encapsulating critical information about market sentiment, potential reversals, and continuation signals. Developed centuries ago and later popularized by Steve Nison in Japanese Candlestick Charting Techniques , these patterns are now wi
NTL Pivot Lines
Northen Trading Labs
Pivot Lines (PL) User Guide Overview and Features The Pivot Lines Indicator (PL) provides traders with a powerful tool for identifying potential support and resistance levels based on well-established pivot point calculation methods. By offering insights into possible price turning points, this indicator helps traders make more informed trading decisions and refine their entry and exit strategies. With customizable settings for different timeframes and calculation methods, PL is versatile and a
ABH - Candle Component Analysis - User Guide Overview and Features The   ABH - Average Bar Height   indicator is designed to help traders analyze market volatility and identify potential buy and sell signals by measuring the average size of each candlestick component over a specific period. The indicator calculates and displays four lines representing different candlestick metrics. By analyzing these values, traders can interpret market strength, volatility, and potential trend changes. Beyond
NTL Market Times
Northen Trading Labs
NTL Market Times Indicator The NTL Market Times Indicator for MT5 provides a clear unobtrusive display of the opening and closing times of the world’s major Forex trading centers. It automatically adjusts for UK daylight saving time, ensuring reliable market session information all year round. Main Features Major Markets: Displays New York, London, Frankfurt, Sydney, and Tokyo trading hours. Color-Coded Sessions: Each market session is uniquely color-coded for quick identification on the chart.
Filtrer:
Aucun avis
Répondre à l'avis