Previous Daily Weekly HLOC levels
- Indicateurs
- Alasgar Baghirov
- Version: 1.0
- Activations: 5
Revolutionize Your Chart Analysis with "Previous Daily Weekly HLOC Levels"!
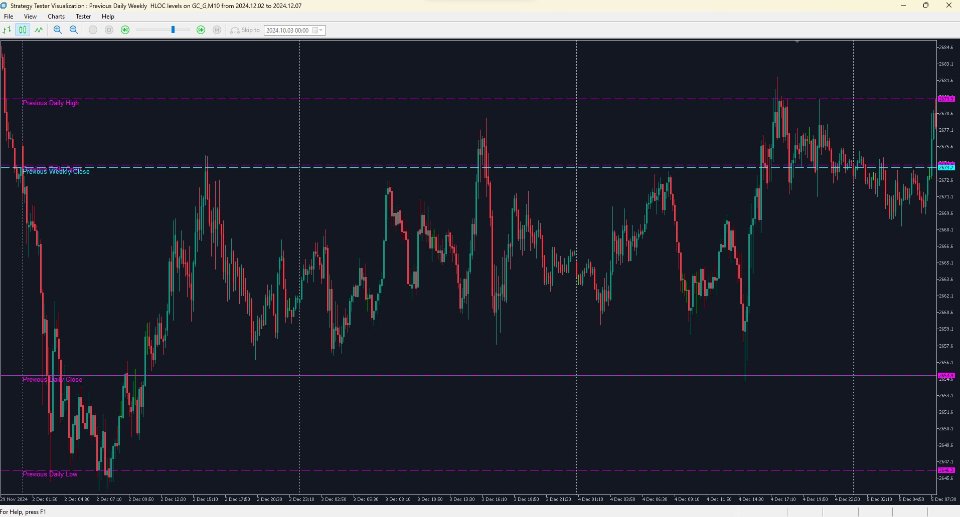
The Previous Daily Weekly HLOC Levels indicator is a must-have tool for traders who want to sharpen their technical analysis. This intuitive and powerful indicator automatically plots the High, Low, Open, and Close levels of the previous day and week on your chart, giving you a clear view of critical support and resistance zones.
Key Features:
✅ Daily and Weekly Levels: Effortlessly displays the High, Low, Open, and Close levels of the previous day and week as horizontal lines.
✅ Real-Time Updates: Seamlessly adjusts to reflect accurate levels at the start of each new day and week.
✅ Customizable Design: Tailor line colors, styles, and labels to fit your charting preferences.
✅ Clean Visualization: Organized and clutter-free display to enhance your trading focus.
Why Choose Previous Daily Weekly HLOC Levels?
Understanding historical price levels is vital for spotting potential market moves. Whether you’re trading intraday or analyzing long-term trends, this indicator simplifies your chart analysis, helping you identify key breakout points, reversals, and continuation zones—all in a single glance.
No more manual plotting or missed opportunities. The Previous Daily Weekly HLOC Levels indicator ensures you stay one step ahead in your trading decisions.
Take the Guesswork Out of Trading!
Enhance your trading precision today. Add Previous Daily Weekly HLOC Levels to your trading arsenal and make confident, data-driven decisions.
Get started now and transform your charting experience!


