MR Score
- Indicateurs
- Mujeeb J
- Version: 1.1
- Activations: 5
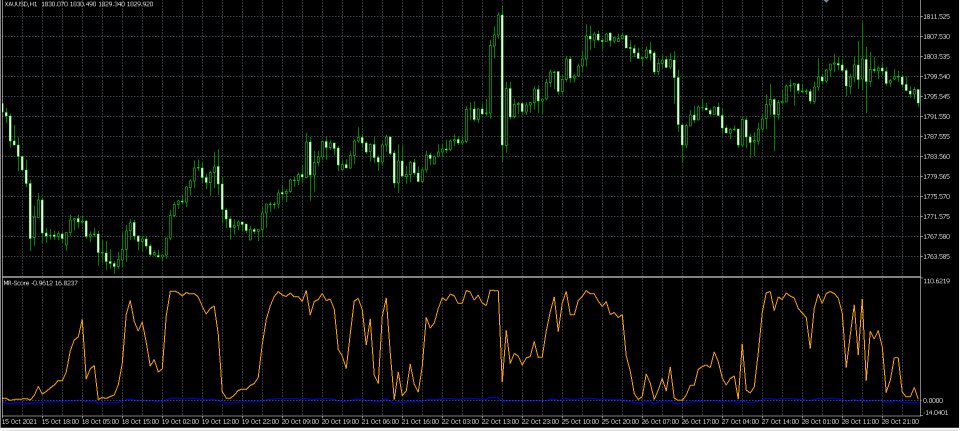
The MR-Score Probability Indicator is a powerful tool designed for traders seeking an edge in identifying overbought and oversold conditions. It calculates the statistical MR-Score of price movements, providing an intuitive measure of how far the current price deviates from its historical average. Additionally, it computes the probability of price movements using the cumulative normal distribution, helping traders assess market conditions with confidence.
Key Features
MR-Score Calculation:
- Measures price deviations from the mean in standard deviations.
- Helps identify statistically significant price levels.
Probability Estimation:
- Computes the likelihood of current price movements using a cumulative normal distribution.
- Outputs probabilities as a percentage for easier interpretation.
Customizable Period:
- Adjust the calculation period to suit your trading style or market conditions.
User-Friendly Visualization:
- Displays the MR-Score and probability as separate lines in a dedicated indicator window.
- Uses distinct colors for better clarity (Blue for MR-Score, Orange for Probability).
Versatile Application:
- Ideal for mean reversion strategies, volatility assessments, or identifying potential breakout conditions.
How It Works
The indicator calculates the mean and standard deviation of price movements over a user-defined period. The MR-Score is computed as:
Z = Price − Mean Standard Deviation Z = \frac{\text{Price} - \text{Mean}}{\text{Standard Deviation}}The cumulative normal distribution (Erf function) is used to estimate the probability of price movements beyond the current level.
Benefits for Traders
- Mean Reversion: Spot overbought and oversold levels with precision.
- Breakout Detection: Identify areas where prices may break away from the mean.
- Improved Risk Management: Assess probabilities to make data-driven trading decisions.
Inputs
- Period: Define the number of bars used for the calculation.
- Colors and Line Styles: Customize the appearance of MR-Score and probability lines.
Use Cases
Mean Reversion:
- Use extreme MR-Score values (e.g., greater than +2 or less than -2) to anticipate price reversals.
Trend Continuation:
- Utilize probabilities to confirm trends or identify low-risk entry points during retracements.
Volatility Analysis:
- Detect periods of high or low volatility using fluctuations in the MR-Score.
Example Usage: EA Code for MR-Score Indicator
Here’s an example of how you can use the MR-Score Probability Indicator within an Expert Advisor (EA):
//+------------------------------------------------------------------+
//| Example EA using MR-Score Probability Indicator                 |
//+------------------------------------------------------------------+
#property strict

// Input parameters for the indicator
input int period = 14; // Period for the MR-Score calculation

// Indicator handles
int mrScoreHandle;
int probHandle;

// Variables to store indicator values
double mrScore[];
double prob[];

//+------------------------------------------------------------------+
//| Expert initialization function                                   |
//+------------------------------------------------------------------+
int OnInit()
{
   // Create the MR-Score indicator
   mrScoreHandle = iCustom(Symbol(), Period(), "MR-Score", period);
   if(mrScoreHandle == INVALID_HANDLE)
   {
      Print("Error creating MR-Score indicator: ", GetLastError());
      return INIT_FAILED;
   }

   // Create the Probability indicator
   probHandle = iCustom(Symbol(), Period(), "MR-Score", period);
   if(probHandle == INVALID_HANDLE)
   {
      Print("Error creating Probability indicator: ", GetLastError());
      return INIT_FAILED;
   }

   // Successful initialization
   Print("Indicators initialized successfully");
   return INIT_SUCCEEDED;
}

//+------------------------------------------------------------------+
//| Expert deinitialization function                                 |
//+------------------------------------------------------------------+
void OnDeinit(const int reason)
{
   // Release the indicator handles when the EA is removed
   if(mrScoreHandle != INVALID_HANDLE)
      IndicatorRelease(mrScoreHandle);

   if(probHandle != INVALID_HANDLE)
      IndicatorRelease(probHandle);
}

//+------------------------------------------------------------------+
//| Expert tick function                                             |
//+------------------------------------------------------------------+
void OnTick()
{
   // Copy the MR-Score and Probability values
   if(CopyBuffer(mrScoreHandle, 0, 0, 1, mrScore) < 0 || CopyBuffer(probHandle, 0, 0, 1, prob) < 0)
   {
      Print("Error copying indicator data: ", GetLastError());
      return;
   }

   // Get the most recent MR-Score and Probability values
   double currentMRScore = mrScore[0];
   double currentProbability = prob[0];

   // Example Use Case: Mean Reversion Strategy
   if(currentMRScore > 2)
   {
      // Condition for an overbought market (MR-Score above +2)
      // Place your sell order logic here
      Print("Overbought condition: MR-Score is ", currentMRScore);
   }
   else if(currentMRScore < -2)
   {
      // Condition for an oversold market (MR-Score below -2)
      // Place your buy order logic here
      Print("Oversold condition: MR-Score is ", currentMRScore);
   }

   // Example Use Case: Breakout Detection
   if(currentProbability > 70)
   {
      // High probability of continued price movement in the same direction
      // You can confirm trend continuation and place your order logic here
      Print("High probability: ", currentProbability, "% for price continuation.");
   }
}
Why Choose This Indicator?
The MR-Score Probability Indicator combines statistical rigor with trading practicality. It is perfect for traders looking for reliable, data-driven signals to enhance their strategies. Whether you're a scalper, swing trader, or long-term investor, this indicator adapts seamlessly to your trading needs.
Note: This indicator does not provide standalone buy or sell signals. It is a supplementary tool designed to enhance your trading strategy. Always use it in conjunction with your analysis and risk management practices.


